TrustRadius: an HG Insights company

Infor Birst

Score5.3 out of 10

186 Reviews and Ratings

What is Infor Birst?

Infor Birst offers multi-tenant cloud BI for deployment in a public or private cloud, or on-premises. It provides an in-memory columnar data store and a BI layer comprising a reporting engine, predictive analytics tools, mobile native apps, dashboards, discovery tools, and an open client interface.

Media

1 / 5

Top Performing Features

  • Report Delivery Scheduling

    Report Delivery Schedule is the ability to have reports delivered to a destination at a specific data and time.

    Category average: 8.4

  • Multi-User Support (named login)

    Named model access means that users have access based on name and password.

    Category average: 8.6

  • Customizable dashboards

    Customizable dashboards are dashboards providing the builder some degree of control over the look and feel and display options.

    Category average: 8.5

Areas for Improvement

  • Predictive Analytics

    Predictive Analytics is the ability to build forecasting models based on existing data sets.

    Category average: 7.8

  • Mobile Application

    A dedicated app for iOS and/or Android.

    Category average: 7.4

  • Dashboard / Report / Visualization Interactivity on Mobile

    In-app dashboard reports and data visualization.

    Category average: 7.9

Infor Birst OEM and embedded analytics - Best BI product.

Use Cases and Deployment Scope

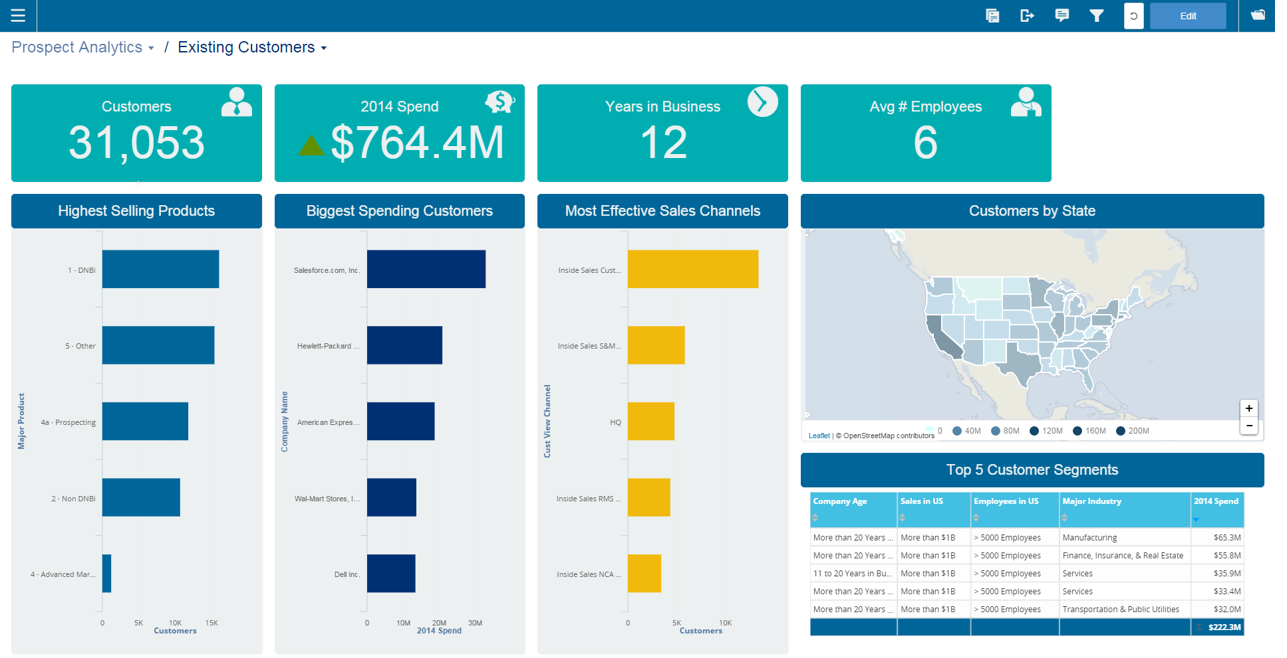
Infor Birst OEM and Embedded Analytics are used for advanced and complex BI reporting and management information for warehousing and sales functions in the organization. Market leader for BI products and easy-to-use reporting features. Good view on data mind maps for source and target data mapping without code use. End-user can map source and target with relationships for reporting.

Pros

  • Automated data refinement.
  • Deliver data as a service (DaaS) model.
  • Support users through guided self service to data objects and semantic definitions.

Cons

  • Integration with other applications.
  • Ability for customization to suit business needs and requirements.
  • Workflow for business rules.

Most Important Features

  • Connection with multiple data sources like SQL, Jira, Salesforce, ASW S3, R server, Google analytics, and dropbox.
  • Customizable enterprise semantic layer.
  • Low TCO to perform time-intensive and error-prone ETL process.

Return on Investment

  • Informed data decision capability for C-Suite.
  • Lower Total Cost of Ownership.
  • Good customer base on implementation.

Alternatives Considered

SAP Analytics Cloud, IBM Analytics Engine and Oracle Analytics Cloud

Other Software Used

SAP Analytics Cloud, IBM Analytics Engine, Oracle Analytics Cloud

Solid tool with opportunites to become even better.

Pros

  • For end users, Birst has a friendly UI that allows them to naturally interact with reporting data via web browser.
  • For properly modeled data, the visualizer tool makes it easy do build quick visualizations.
  • Surfacing data on dashboards with global filters allows users the flexibility to view multiple metrics with the same lens.

Cons

  • Data modeling is a particular challenge for both novice and experienced data engineers. The ETL tools are insufficient to meet even 1/2 of our needs, and as a result we have a separate platform for data warehousing and use the back end of Birst solely for data exploration projects.
  • There are occasionally delays in the UI when applying filters that often lead users to think that something is broken when in fact they just need to wait a few more seconds for the UI to change, even to let them know that it's still updating.
  • Customer service, while it has improved, is still poor relative to other vendors that we work with. I often feel that both our CSM and our support technicians are defensive and try to push the responsibility for sub-optimal experiences back on us, and while it sometimes *is* the case that it is an issue on our end, more often it is not and even when it is we shouldn't FEEL like that. None of our other vendors take this approach, and even when the problem is on our end, they support us getting through it in a much less defensive way.

Alternatives Considered

Pentaho, Snowflake, Tableau Server and Tableau Desktop

Other Software Used

Google Analytics Premium, Tableau Server, Mixpanel

Birst is the best tool we found to meet our needs, but has some significant issues

Pros

  • Easy to create visualizations
  • Very attractive visualizations
  • Connect to many data sources

Cons

  • Terrible documentation and training resources. Sometimes not enough documentation, sometimes it is WRONG! Often we are told to post our issues to the Birst user forum, as if we should be able to figure out our own problems rather than Birst troubleshooting their own product.
  • Sometimes when there are bugs we are told they will only be addressed by voting on them as feature requests, not addressing the bugs. Some feature requests are years old.
  • When using Birst Connect there is a lot that can go wrong on the Birst side of things completely out of our control, and then we are waiting on technical support to resolve. In particular the space can get "locked" if we try to process while it's already processing. I've also experienced where a staging table was deleted in the user interface, but not the backend of the tool, so it failed until the support team manually removed it.
  • Birst technical support is very weak. They often do not answer the phone, and they always ask to go on a call with you after submitting a ticket, no matter if we've provided extensive documentation within the ticket.
  • The ETL features are incredibly hard to use, though very powerful. As someone who has an understanding of database theory I found the fact that the training refused to teach to "primary keys" and "foreign keys" and "facts and dimensions" and instead made us learn a whole different terminology of "levels" and "hierarchies" very confusing.
  • Processing is entirely mysterious to us. There's little explanation of what is happening when it is processing, which makes it hard to troubleshoot when things go wrong.
  • Terrible or non-existent error messages. When a scripted source fails to execute the log in the scripted source doesn't even generate an error message. We've also found that the error message "data format is not correct" doesn't actually mean that, but can mean a whole bunch of other things related to the model.
  • Birst does not allow snowflake data structure more than 2 levels deep. This is a problem as our data warehouse is a snowflake, so we always have to flatten our tables.
  • Even though the visualization tool makes nice views, it is not as robust as even years old versions of Tableau. In particular I've found I often export my data out of Birst and into Tableau when I want to visualize two or more attributes.
  • Birst sends its users to the user Forum, but half of the issues on there have not been resolved. There's a person whose job it is to reply whether the users have figured out a solution. Why is this our responsibility to figure out their tool?
  • Very, very little support for using Live Access to connect to data. Some of the Birst support staff don't even know how to use it.

Alternatives Considered

GoodData, Microsoft Power BI, Tableau Desktop, Tableau Server, Domo, Looker, TIBCO BusinessConnect, Pentaho and Datameer Analytics Solutions

Birst Review

Pros

  • The multi-tenant capabilities of the product is really great.
  • Its relatively easy go get started with the product.
  • The support is great.
  • The flow of new features and improvements are constant.
  • The customer success program is good.

Cons

  • Its fairly complex for "normal" users to master/use the product (normal being supervisors, IT professionals etc.).
  • The administration part of the product could be better, easier to use and manage.

Alternatives Considered

Logi Analytics and QlikView

Return on Investment

We don't use the iOS and Android capabilities of Birst, however we plan to.

Usability

Other Software Used

Microsoft SQL Server

Birst almost live access

Pros

  • Connects directly to many types of external data sources, enabling us to plug into data where it already exists
  • Visualiser provides a user friendly interface for non-tech users to build their own databases
  • HTML dashboards look far better now than the original Flash versions

Cons

  • Connectivity between the live sources frequently drops and does not reconnect automatically
  • Cannot add dynamic titles to reports - so although can create a dynamic text box, this title cannot be exported along with the report
  • Designer runs query as soon as an attribute is dropped on screen - would be useful if you know you need to add another 4, to be able to disable the query execution until all items have been added

Alternatives Considered

sql analysis services, Microsoft Power BI and Tableau Desktop

Usability

Other Software Used

Microsoft Power BI, Tableau Desktop, Microsoft SQL Server