TrustRadius: an HG Insights company

Posit

Score10 out of 10

235 Reviews and Ratings

What is Posit?

Posit, formerly RStudio, is a modular data science platform, combining open source and commercial products.

Media

Posit runs on most desktops or on a server and accessed over the web
Posit supports authoring HTML, PDF, Word Documents, and slide shows
Posit supports interactive graphics with Shiny and ggvis
Shiny combines the computational power of R with the interactivity of the modern web
Remote Interactive Sessions: Start R and Python processes from Posit Workbench within various systems such as Kubernetes and SLURM with Launcher.
Jupyter: Author and edit Python code with Jupyter using the same Posit Workbench infrastructure.
Posit Connect enables users to deploy Interactive Python Applications (including Dash, Bokeh and Streamlit), in the same place Shiny apps are shared.

1 / 7

Top Performing Features

  • Extend Existing Data Sources

    Use R or Python to create custom connectors for any APIs or databases

    Category average: 8.9

  • Interactive Data Analysis

    Ability to analyze data interactively using Python or R Notebooks

    Category average: 8.8

  • Interactive Data Cleaning and Enrichment

    Access to visual processors for data wrangling

    Category average: 9

Areas for Improvement

  • Security, Governance, and Cost Controls

    Built-in controls to mitigate compliance and audit risk with user activity tracking

    Category average: 8.6

  • Connect to Multiple Data Sources

    Ability to connect to a wide variety of data sources including data lakes or data warehouses for data ingestion

    Category average: 8.8

  • Visualization

    The product’s support and tooling for analysis and visualization of data.

    Category average: 8.3

Can't Beat Open-Source Software!

Use Cases and Deployment Scope

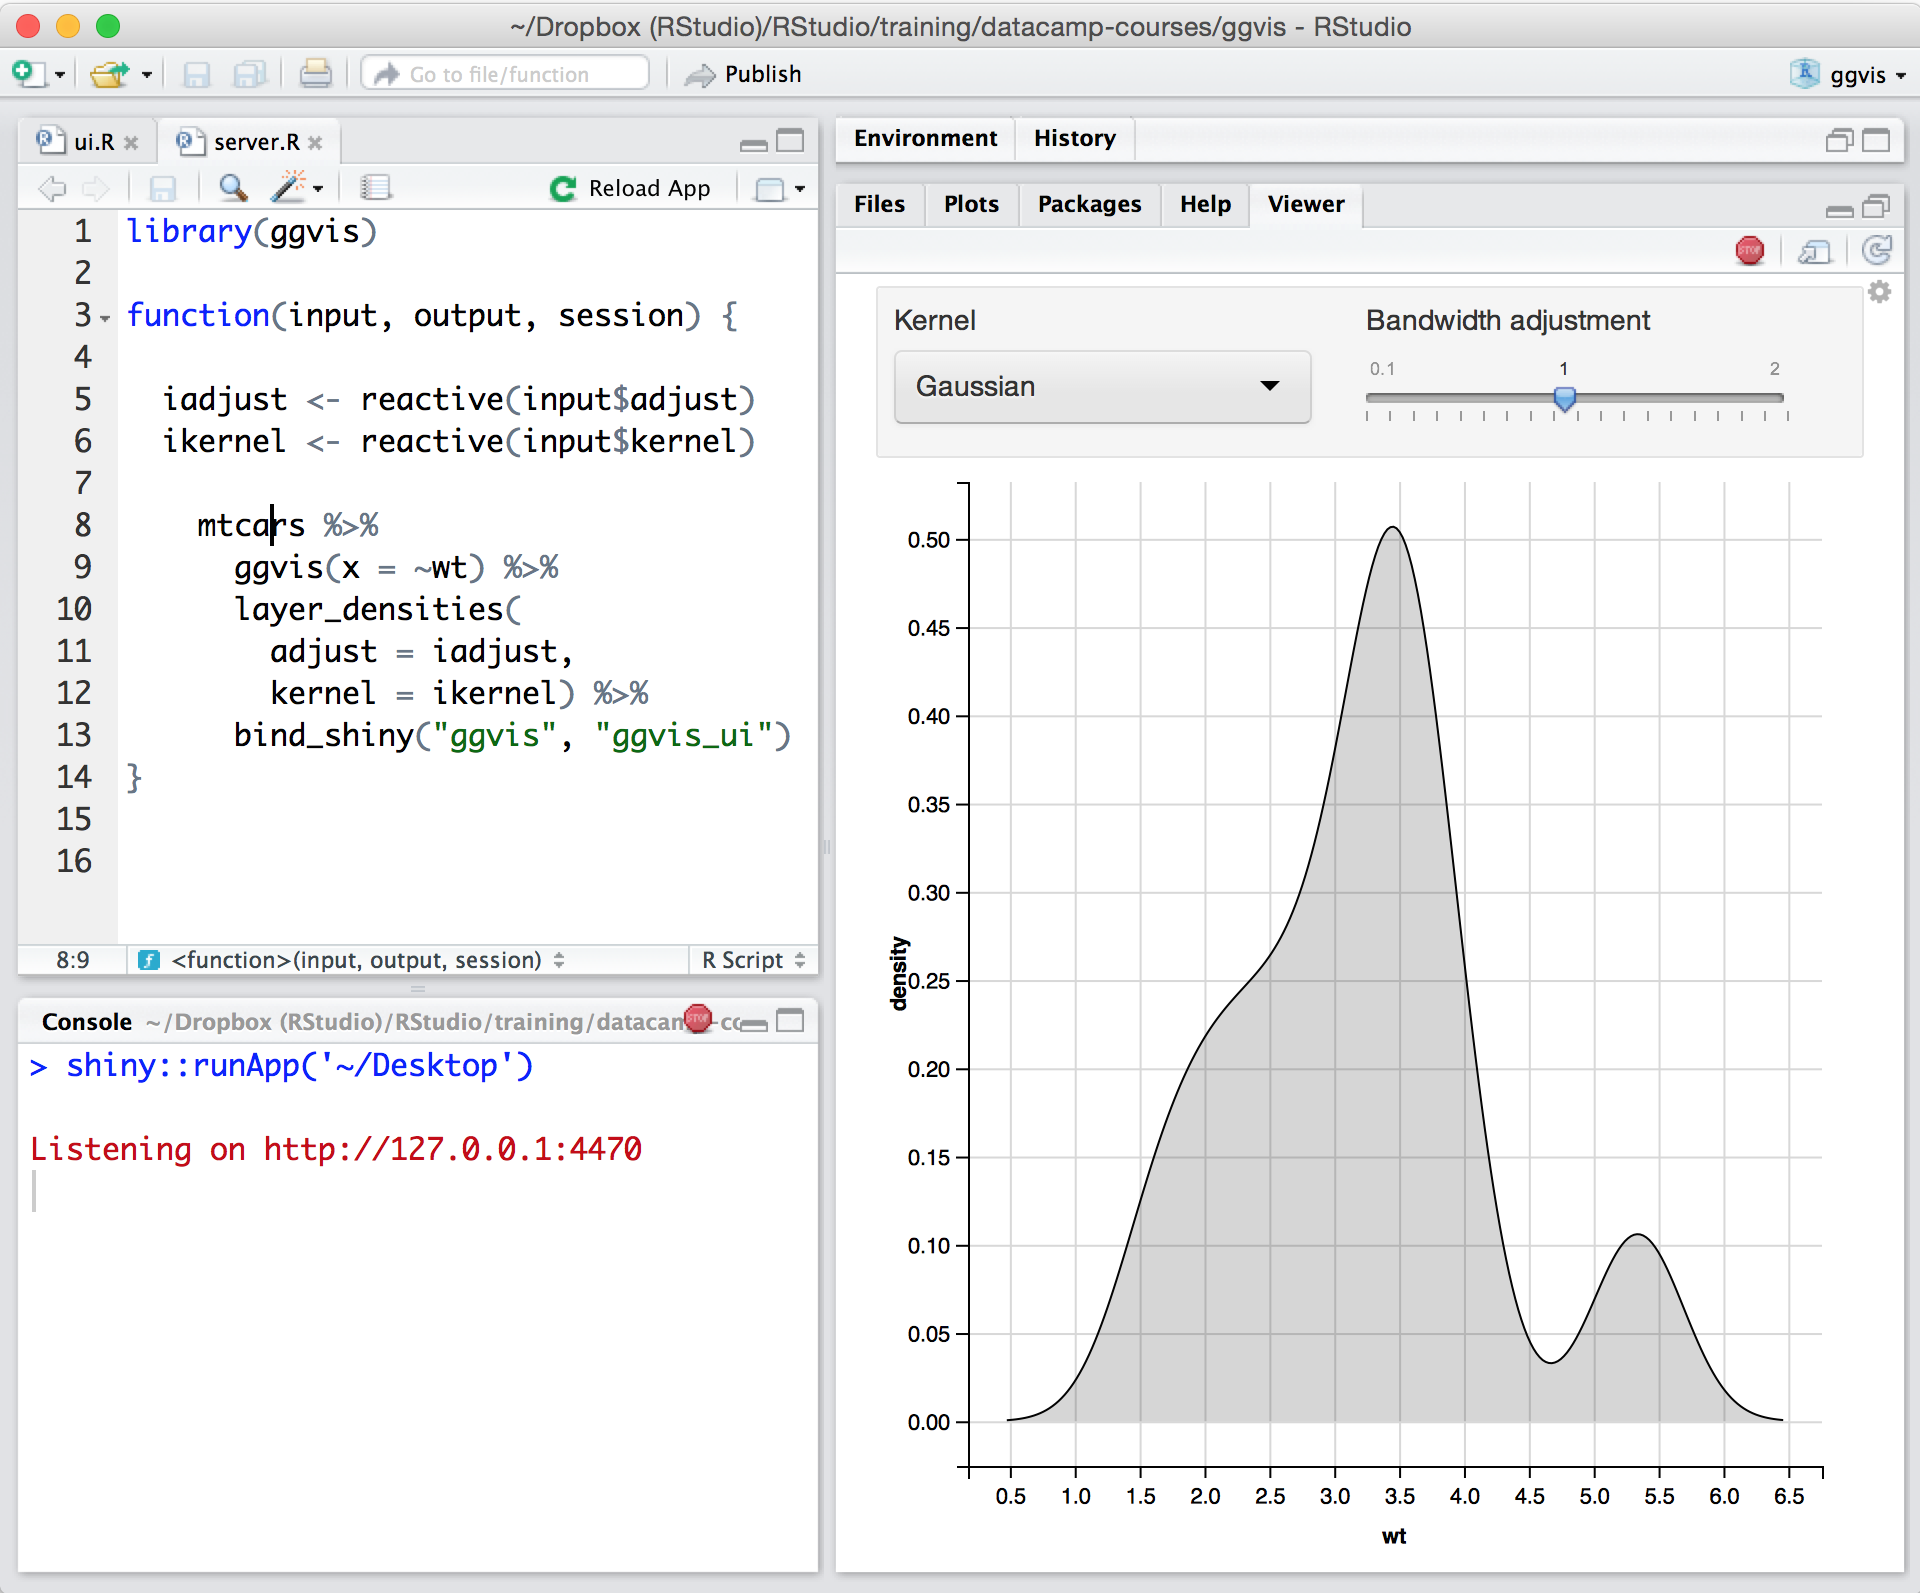
I use the open source software available through Posit, specifically Quarto and some of the main packages they manage (i.e, dplyr) for research analysis at work. Specifically, I work for a large government agency and do analyses on large source (i.e., tens of thousands) data of employees.

Pros

  • User-friendly data analysis
  • Sharing workflows across multiple people on a team
  • Manage and clean large datasets
  • Provide "print-outs" (e.g., LaTex) to share with stakeholders not as versed in analysis

Cons

  • Greater clarity on error codes for software packages that Posit manages
  • Faster LaTex export

Return on Investment

  • Allows us to manage large datasets
  • Allows us to deliver findings to our stakeholders faster
  • Allows us to replicate analyses quickly via the easy sharing and modification of code

Usability

Alternatives Considered

IBM SPSS Statistics

Other Software Used

Microsoft 365, Microsoft Teams

Posit, the Best ever Data Science Software

Use Cases and Deployment Scope

I use Posit software RStudio Pro to analyze, modelling and visualize dataset related to healthcare, medical affairs and pharma. There are lots of R packages available mainly dplyr, stringr, ggplot2, tidyr which we usually use in our day-to-day data management, data wrangling, cleaning, pre-processing tasks. Also, we use lots of other machine learning packages such as caret, tidymodels for statistical modelling and prediction. Our client network is integrated with AWS cloud platform so that we can use Posit software seamlessly and efficiently.

Business problems like patient analytics, feasibility studies are done using Posit Workbench. Based on clients' requirements and requests we use RStudio and R packages for data visualization including Bar plots, Line Plots for various kind of statistical analysis viz. Correlation analysis, LASSO regression, Elasso or Network analysis and Graph.

We have used RStudio for parallel computing with the R package VSURF to handle big data like millions of rows and columns (mostly patient churn and history data). We also used ggplot2 and plotly library for stunning graphs and plots.

Last but not the least, we have used Rmarkdown (or now Quarto) for generating PDF, Word reports to clients for data validation and case studies according to business requirements.

Pros

  • Efficient coding
  • Clean IDE
  • Help page and large community

Cons

  • Data view support for all kinds of data formats
  • More organized help page
  • Installation packages of older version as well as latest one

Return on Investment

  • Open source hence cost effective
  • Clean UI/UX for coding
  • Help page is really a great resource
  • support of multiple programming languages like python, C++ etc

Alternatives Considered

Jupyter Notebook and Minitab Workspace

Other Software Used

Jupyter Notebook, Microsoft Excel, Microsoft Windows

Top quality R and Python products with excellent customer support

Use Cases and Deployment Scope

My team uses RStudio products, but we distribute reports and dashboards to 100+ users. The business problem it addresses is how to get the data science work that we're doing in R and Python (for example, text mining), as well as more day-to-day reporting based on some of the data structures that we have written in R/SQL.

Pros

  • The support is incredibly professional and helpful, and they often go out of their way to help me when something doesn't work.
  • The one-click publishing from RStudio Connect is absolutely amazing, and I really like the way that it deploys your exact package versions, because otherwise, you can get in a terrible mess.
  • Python doesn't feel quite as native as R at the moment but I have definitely deployed stuff in R and Python that works beautifully which is really nice indeed.

Cons

  • I'm only a data scientist, I'm not DevOps, but I did find RStudio Connect hard to install. I have also tried and failed to get proxy authentication with Apache working, I'm sure it's me being thick but I have never gotten there with it.
  • Another thing I don't like is some of the abstractions in RStudio Connect. There isn't really a file system at all, and data refresh is done with a scheduled RMarkdown report, which is okay but it's a bit round the houses and it's very different from the code on my local machine.
  • I don't love the pricing model of RStudio Connect where you pay just as much for publishers as you do for consumers. I wish we could have, say, 5 publishers and more consumers on our current licence.

Return on Investment

  • RStudio has enabled us to launch data science projects in the cloud at scale, which has brought in at least 10x more money than we spent on the licences.
  • RStudio products are nice to use for my staff and I think are good to retain good people.
  • RStudio allows us to put analytic products in the hands of managers rapidly, which is vitally important for us.

Alternatives Considered

Qlik Analytics Platform, Microsoft Power BI and Tableau Desktop

Other Software Used

FileZilla, MySQL, Slack

RStudio Connect(s) your data science products to your clients.

Use Cases and Deployment Scope

We license the RStudio Connect (RSC) product from RStudio. We also use, for free, the open source packages and development environment offered by RStudio. Without going into specifics, our Connect license is about 1/6th the cost of our QlikView license, which we will discontinue once we are done porting legacy dashboards off of it. A direct comparison between Qlik and RSC is unfair. Products such as QlikView and PowerBI are BI tools which licensed users use to build dashboards. I refer to RSC as a content management platform for data science. We use it to: Validate our data and alert us to problems. Email reports to clients in PDF and Excel. Upload data to FTP servers and to send HL7 messages (via a HL7 engine). Hosts our internal API. Host machine learning models. Host custom-built dashboards. And, staff love developing against it.I could calculate an ROI for everything, except staff satisfaction. But the value add is there and it is valuable.

Pros

  • Deliver data/insights to customers
  • Multi-language (R, Python)
  • Empower staff

Cons

  • The name causes people to incorrectly think it is an R-focused product. It isn't.

Return on Investment

  • We will save money replacing legacy dashboard tools.

Alternatives Considered

QlikView

Other Software Used

QlikView

RStudio - Very Powerful Statistical Tool

Pros

  • Performing Statistical Analysis is very efficient. With a lot of open source packages available in R programming, data analysis becomes very easy.
  • Publishing web applications and deploying predictive data models is very easy if you have R Server in your firm using Shiny. It can handle large sets of data.
  • Writing data science algorithms like Clustering, Classification and Apriori Analysis is very efficient. The open source nature of this programming language allows everyone to contribute packages to the environment.

Cons

  • There are some packages in RStudio which aren't very well known hence its very difficult to get help if you get stuck using them.
  • If the dataset size crosses 20 million rows, then you need extremely high RAM otherwise the processing gets very slow. So in such a case R Server is a must. Cloud storage can be a good alternative though.
  • The graphs which are plotted in the console aren't very intuitive and labels, colors, axis, etc have to be manually written to make the visuals look more appeasing.

Return on Investment

  • Positive impact is when you automate excel reports using Shiny applications, it ends up saving a lot of time and money.
  • It's easy to catch on so with a little training and sound math background you can start coding right away.
  • Its compatibility with other platforms like SQL databases, Salesforce, Tableau , etc is amazing and makes it worth the investment. It doesn't have any negatives as such.

Alternatives Considered

Tableau Desktop

Other Software Used

Tableau Desktop, DB2, Oracle Advanced Analytics, IBM Analytics Engine