SPSS Statistics is a software package used for statistical analysis. It is now officially named "IBM SPSS Statistics". Companion products in the same family are used for survey authoring and deployment (IBM SPSS Data Collection), data mining (IBM SPSS Modeler), text analytics, and collaboration and deployment (batch and automated scoring services).
$99
per month per user
Posit
Score 10.0 out of 10
N/A
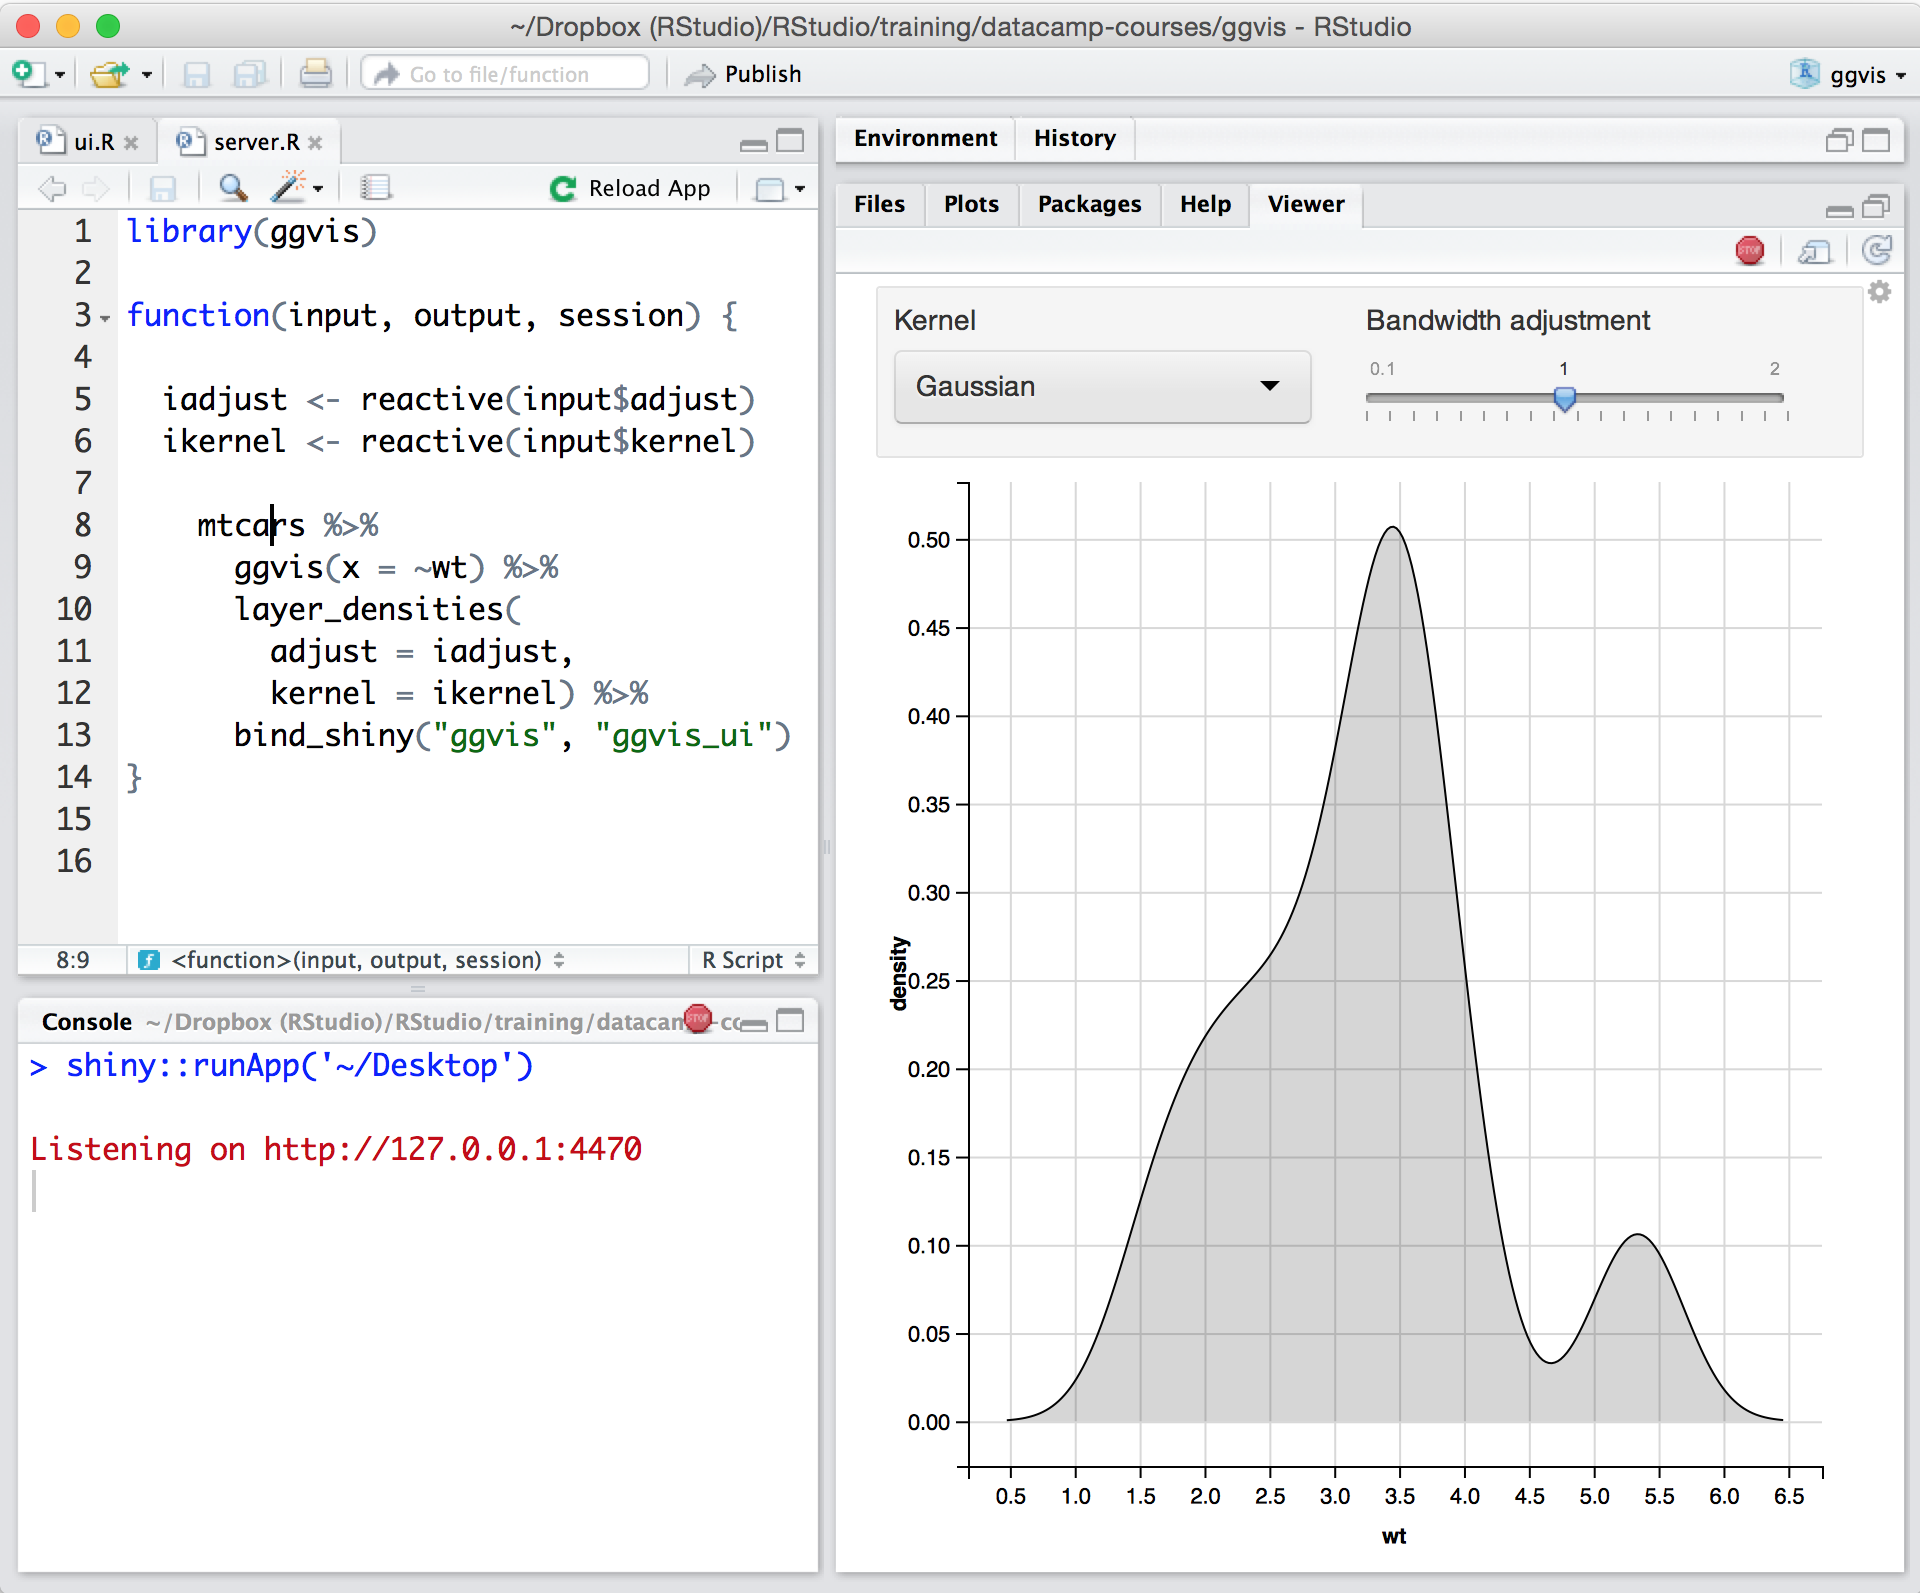
Posit, formerly RStudio, is a modular data science platform, combining open source and commercial products.
N/A
Pricing
IBM SPSS Statistics
Posit
Editions & Modules
Base
USD 3,830
one-time fee per user
Standard
USD 8,440
one-time fee per user
Professional
USD 16,900
one-time fee per user
Premium
USD 25,200
one-time fee per user
Monthly subscription
USD 99
per month per user
Annual subscription
USD 1,188.00
per year per user
No answers on this topic
Offerings
Pricing Offerings
IBM SPSS Statistics
Posit
Free Trial
Yes
Yes
Free/Freemium Version
No
Yes
Premium Consulting/Integration Services
No
No
Entry-level Setup Fee
No setup fee
Optional
Additional Details
—
—
More Pricing Information
Community Pulse
IBM SPSS Statistics
Posit
Features
IBM SPSS Statistics
Posit
Platform Connectivity
Comparison of Platform Connectivity features of Product A and Product B
IBM SPSS Statistics
-
Ratings
Posit
9.3
Ratings
11% above category average
Connect to Multiple Data Sources
00 Ratings
8.00 Ratings
Extend Existing Data Sources
00 Ratings
10.00 Ratings
Automatic Data Format Detection
00 Ratings
10.00 Ratings
Data Exploration
Comparison of Data Exploration features of Product A and Product B
IBM SPSS Statistics
-
Ratings
Posit
9.0
Ratings
7% above category average
Visualization
00 Ratings
8.00 Ratings
Interactive Data Analysis
00 Ratings
10.00 Ratings
Data Preparation
Comparison of Data Preparation features of Product A and Product B
IBM SPSS Statistics
-
Ratings
Posit
10.0
Ratings
20% above category average
Interactive Data Cleaning and Enrichment
00 Ratings
10.00 Ratings
Data Transformations
00 Ratings
10.00 Ratings
Platform Data Modeling
Comparison of Platform Data Modeling features of Product A and Product B
IBM SPSS Statistics
-
Ratings
Posit
10.0
Ratings
18% above category average
Multiple Model Development Languages and Tools
00 Ratings
10.00 Ratings
Single platform for multiple model development
00 Ratings
10.00 Ratings
Self-Service Model Delivery
00 Ratings
10.00 Ratings
Model Deployment
Comparison of Model Deployment features of Product A and Product B
SPSS is well-suited for the following: 1) User Behavior Analysis: SPSS handles large datasets to analyze user behavior data. 2) Customer Satisfaction / Foundational Surveys: SPSS facilitates analysis of quant data from satisfaction surveys, keeping us informed about customer needs and preferences. 3) A/B test analysis: SPSS statistical tools for A/B test analysis, which helps optimize user experience of our products. Scenarios where SPSS are less appropriate: 1) Qualitative Data Analysis: I do not use SPSS for open-ended survey responses/qual data. 2) Live/in-vivo data analysis: SPSS is not ideal for real-time data processing. 3) Complex Data Integration: SPSS isn’t the best fit for complex data integration tasks
In my humble opinion, if you are working on something related to Statistics, RStudio is your go-to tool. But if you are looking for something in Machine Learning, look out for Python. The beauty is that there are packages now by which you can write Python/SQL in R. Cross-platform functionality like such makes RStudio way ahead of its competition. A couple of chinks in RStudio armor are very small and can be considered as nagging just for the sake of argument. Other than completely based on programming language, I couldn't find significant drawbacks to using RStudio. It is one of the best free software available in the market at present.
SPSS has been around for quite a while and has amassed a large suite of functionality. One of its longest-running features is the ability to automate SPSS via scripting, AKA "syntax." There is a very large community of practice on the internet who can help newbies to quickly scale up their automation abilities with SPSS. And SPSS allows users to save syntax scripting directly from GUI wizards and configuration windows, which can be a real life-saver if one is not an experienced coder.
Many statistics package users are doing scientific research with an eye to publish reproducible results. SPSS allows you to save datasets and syntax scripting in a common format, facilitating attempts by peer reviewers and other researchers to quickly and easily attempt to reproduce your results. It's very portable!
SPSS has both legacy and modern visualization suites baked into the base software, giving users an easily mountable learning curve when it comes to outputting charts and graphs. It's very easy to start with a canned look and feel of an exported chart, and then you can tweak a saved copy to change just about everything, from colors, legends, and axis scaling, to orientation, labels, and grid lines. And when you've got a chart or graph set up the way you like, you can export it as an image file, or create a template syntax to apply to new visualizations going forward.
SPSS makes it easy for even beginner-level users to create statistical coding fields to support multidimensional analysis, ensuring that you never need to destructively modify your dataset.
In closing, SPSS's long and successful tenure ensures that just about any question a new user may have about it can be answered with a modicum of Google-fu. There are even several fully-fledged tutorial websites out there for newbie perusal.
Ability to scale across the company is limited based on the users license, cannot share a dashboard to the general view of the company.
Ability to retain session - not simple method to customize view per user (e.g., once session is ended, the users will return next time to the baseline view).
Ability to enable communication between multiple users - leave notes, tag other users, or share specific view.
It's super easy to use for newbies and super powerful for power users! It does EVERYTHING you are usually asked to do analytically. Their Help Desk is PHENOMENAL. And I find the upgrade and renewal price to be a good deal.
There is no other platform that meets our needs. Even if it was terrible we would still use it but fortunately for us it is a very solid project with a great support team. I hope in the future to expand our use and get more licences as well as upgrade to RStudio workbench but for now we are very happy.
SPSS is beginner friendly and user-friendly for beginner analysts and simple statistical tests. It's "click and go" interface does take some learning, but overall this is much easier than other programs I have used and seen. Compared to SAS software, SPSS takes a great deal less familiarizing and it not a matter of learning a coding language like SAS and RStudio.
For someone who learns how to use the software and picks up on the "language" of R, it's very easy to use. For beginners, it can be hard and might require a course, as well as the appropriate statistical training to understand what packages to use and when
RStudio is very available and cheap to use. It needs to be updated every once in a while, but the updates tend to be quick and they do not hinder my ability to make progress. I have not experienced any RStudio outages, and I have used the application quite a bit for a variety of statistical analyses
I have not contacted IBM SPSS for support myself. However, our IT staff has for trying to get SPSS Text Analytics Module to work. The issue was never resolved, but I'm not sure if it was on the IT's end or on SPSS's end
Since R is trendy among statisticians, you can find lots of help from the data science/ stats communities. If you need help with anything related to RStudio or R, google it or search on StackOverflow, you might easily find the solution that you are looking for.
Have a plan for managing the yearly upgrade cycle. Most users work in the desktop version, so there needs to be a mechanism for either pushing out new versions of the software or a key manager to deal with updated licensing keys. If you have a lot of users this needs to be planned for in advance.
If you have made it this far, you should have a very good idea of how SPSS stacks up the competition (data processing and analytics tools). Even the free ones, such as r Studio or Stata, are leaps and bounds ahead of SPSS. IBM is resting on a reputation developed nearly 30 years ago and has shown no desire to improve.
RStudio was provided as the most customizable. It was also strictly the most feature-rich as far as enabling our organization to script, run, and make use of R open-source packages in our data analysis workstreams. It also provided some support for python, which was useful when we had R heavy code with some python threaded in. Overall we picked Rstudio for the features it provided for our data analysis needs and the ability to interface with our existing resources.
I think that RStudio scales pretty well based on the size of the datasets I'm using. It has multithreading capabilities unlike some other statistical analysis programs which is very useful in cutting down on time. The format of RStudio's syntax also makes it very easy to replicate regardless off the scale of the analysis and data set
I found SPSS easier to use than SAS as it's more intuitive to me.
The learning curve to use SPSS is less compared to SAS.
I used SAS, to a much lesser extent than SPSS. However, it seems that SAS may be more suitable for users who understand programming. With SPSS, users can perform many statistical tests without the need to know programming.
Using it for data science in a very big and old company, the most positive impact, from my point of view, has been the ability of spreading data culture across the group. Shortening the path from data to value.
Still it's hard to quantify economic benefits, we are struggling and it's a great point of attention, since splitting out the contribution of the single aspects of a project (and getting the RStudio pie) is complicated.
What is sure is that, in the long run, RStudio is boosting productivity and making the process in which is embedded more efficient (cost reduction).