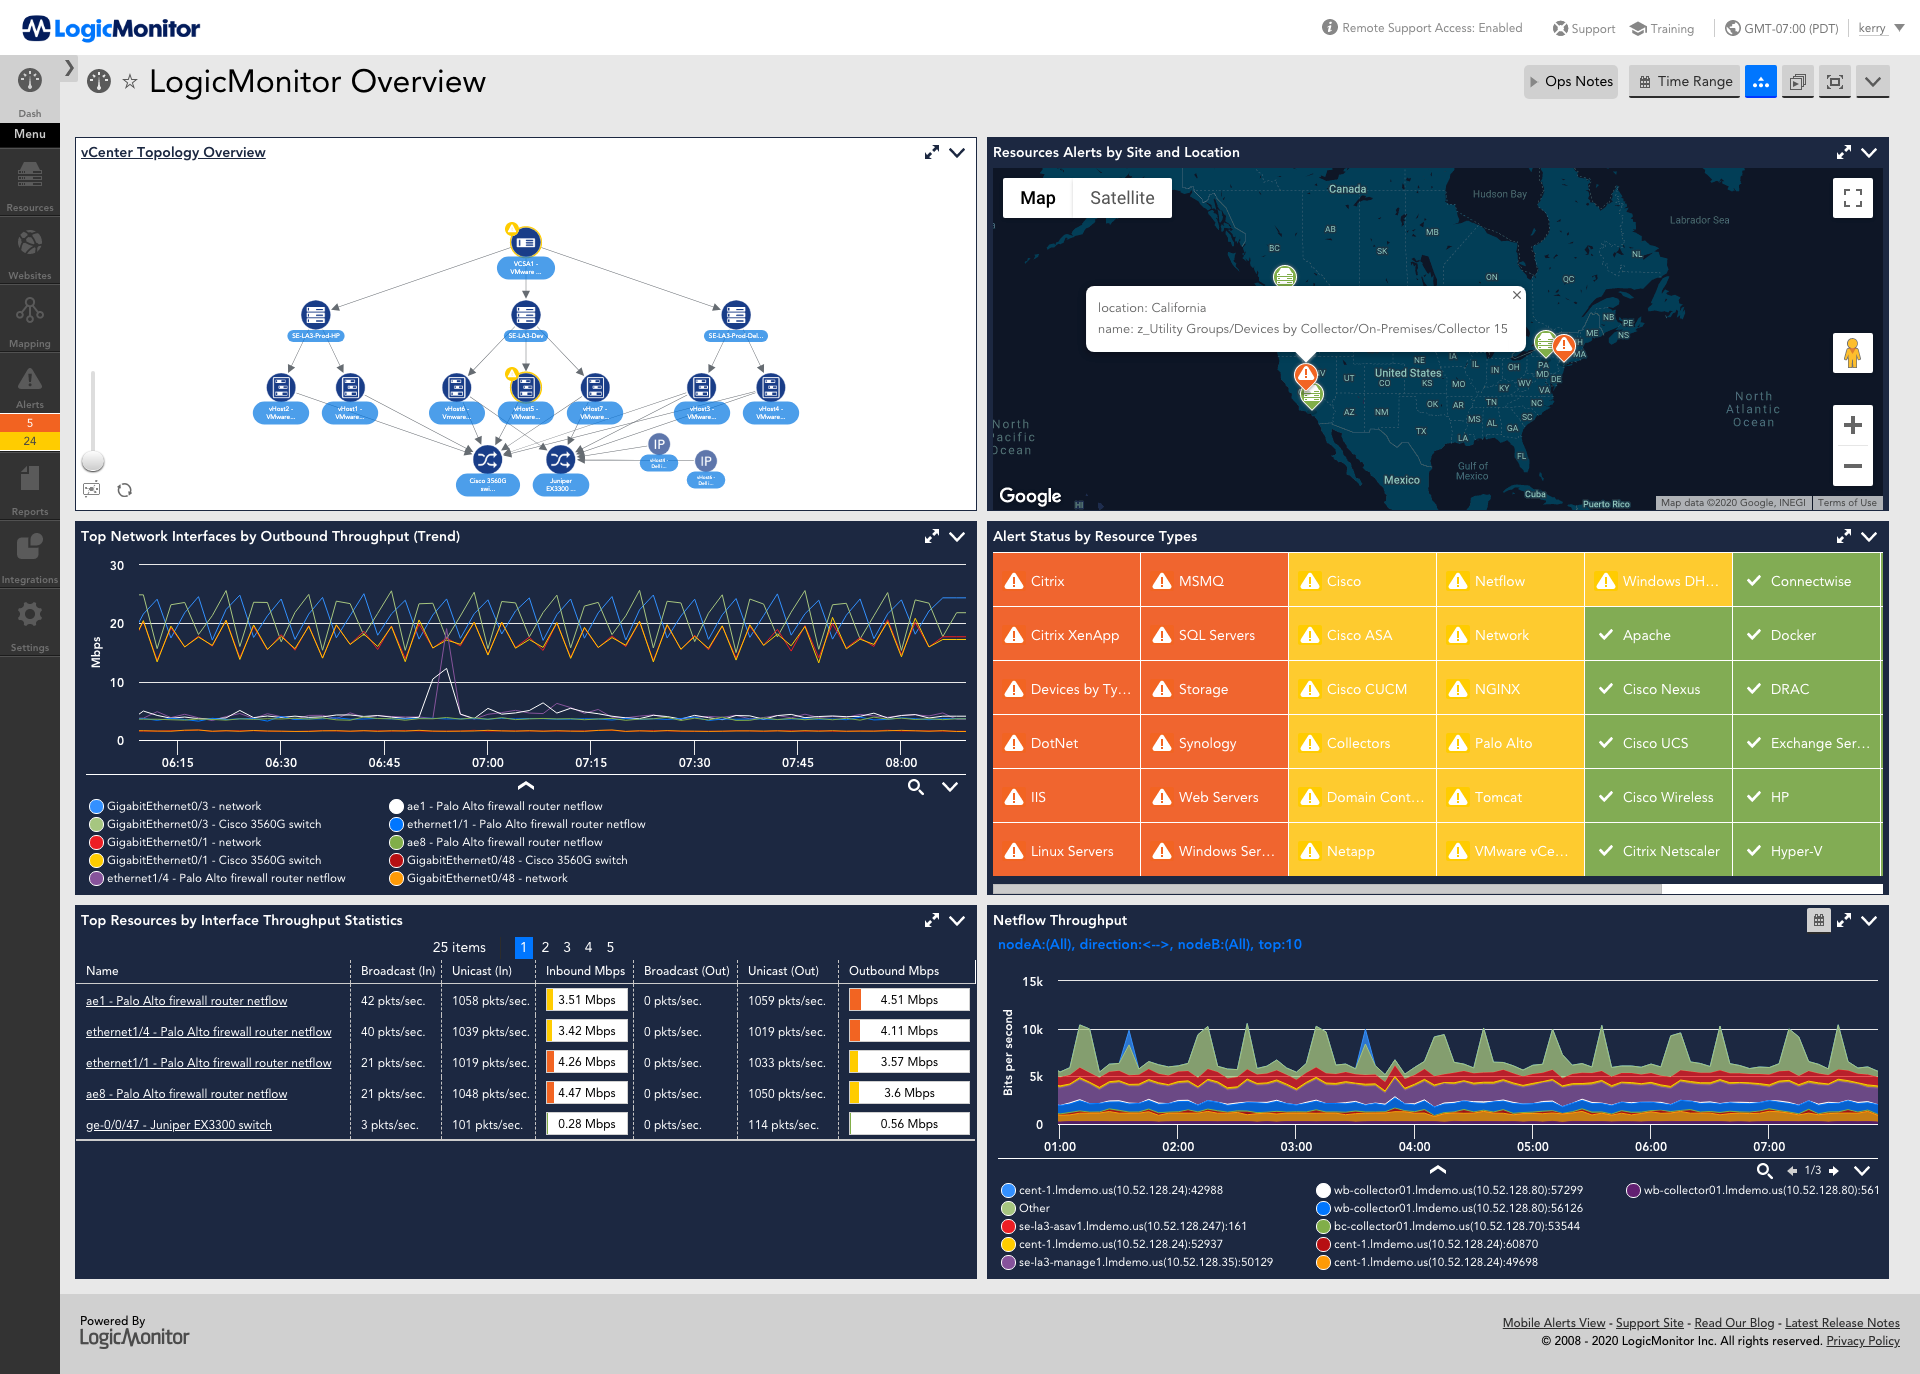
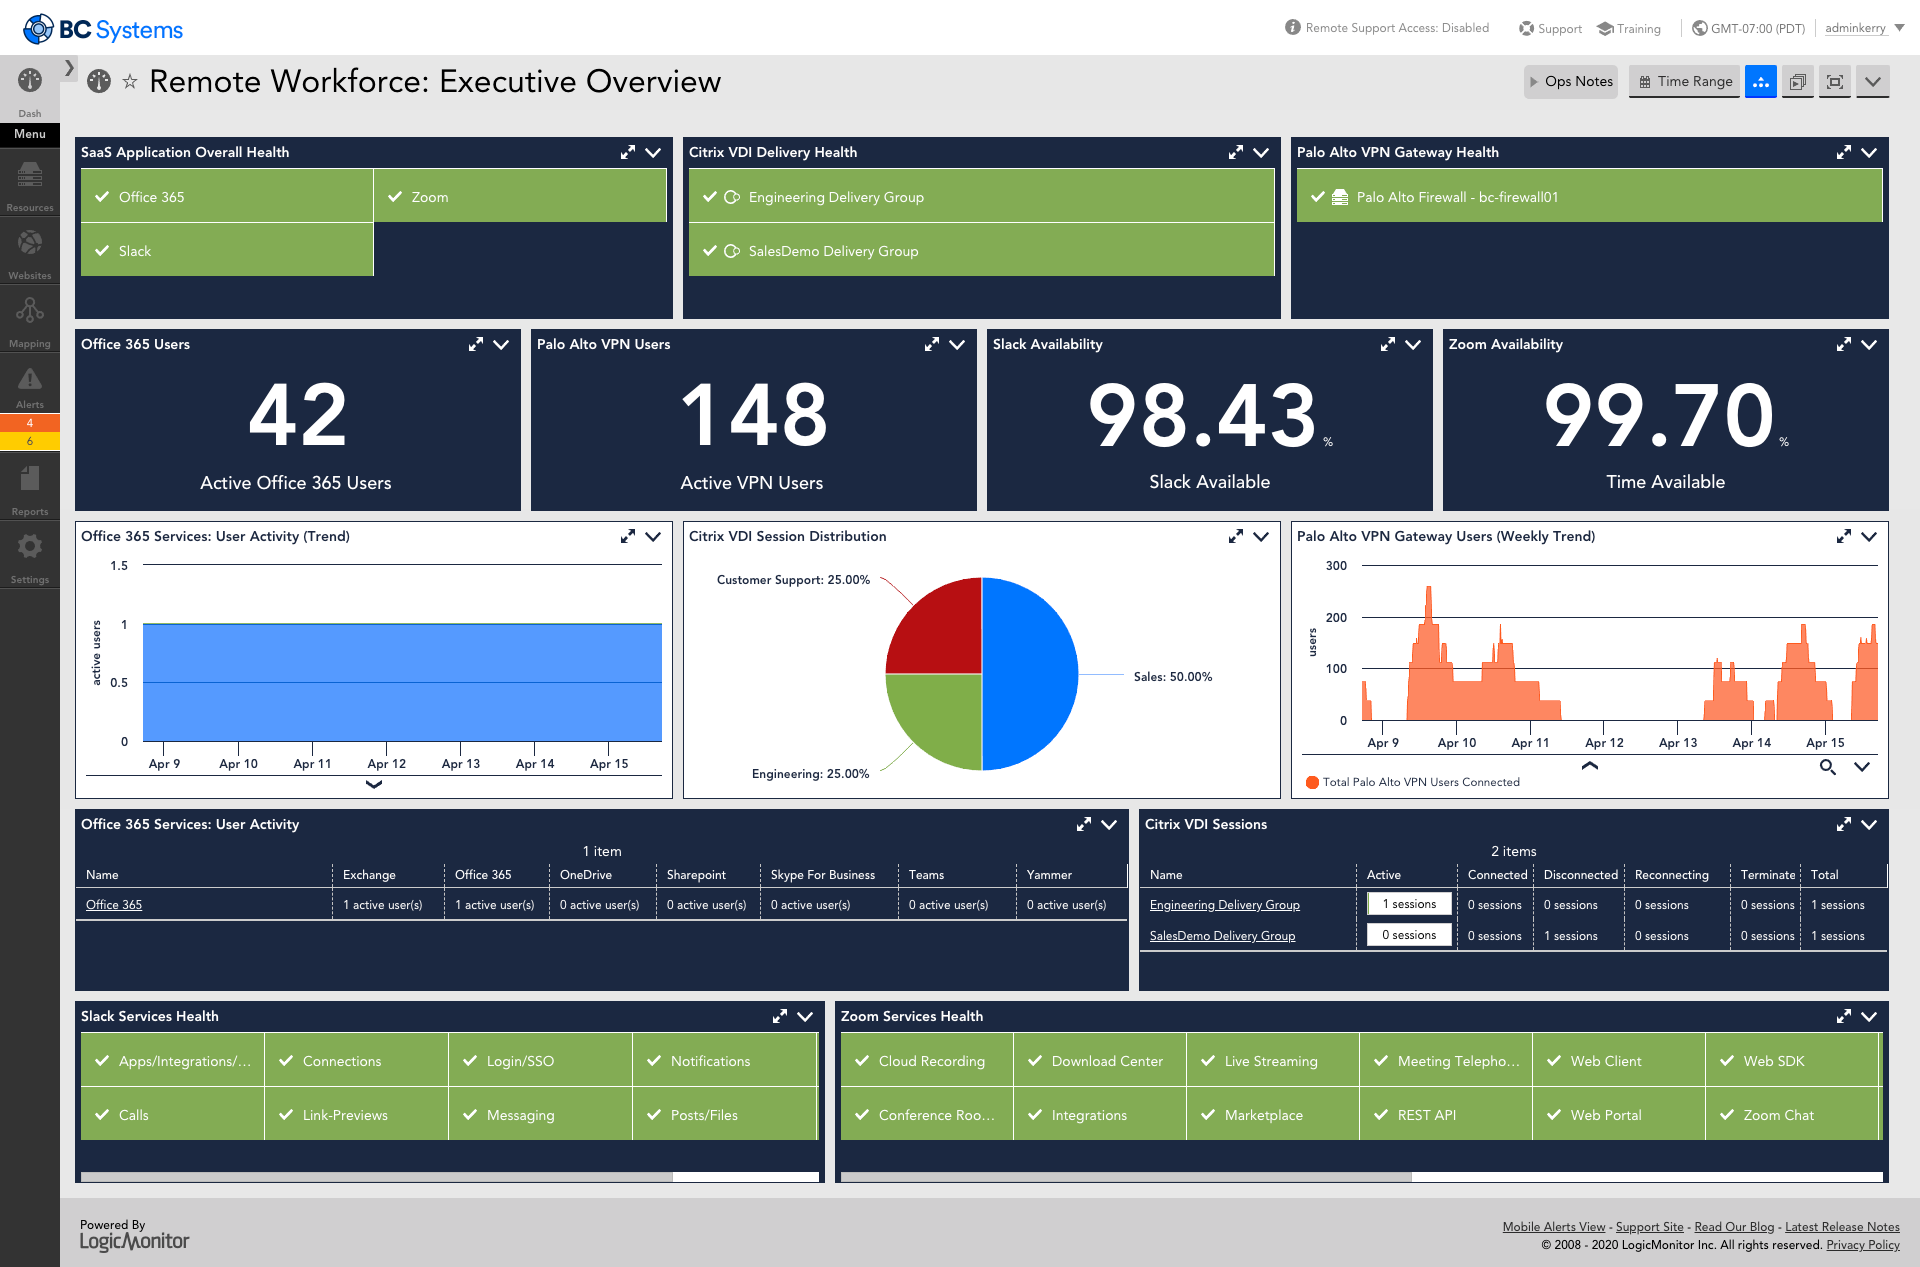
LogicMonitor’s SaaS-based platform, LM Envision, enables observability across on-prem and multi-cloud environments. It provides IT and business teams operational visibility and predictability across their technologies and applications.
N/A
SolarWinds Database Performance Analyzer
Score5.5 out of 10
N/A
SolarWinds Database Performance Analyzer (DPA) enables deep visibility into database performance and expert advice for performance optimization and tuning. What can you monitor with DPA? Oracle Oracle Exadata Oracle EBS Microsoft SQL Server Azure SQL Database Azure SQL Database Managed Instance MySQL DB2 SAP ASE Aurora MariaDB DPA monitors physical, virtual,…
N/A
Pricing
LogicMonitor
SolarWinds Database Performance Analyzer
Editions & Modules
Enterprise
Contact sales team
Website Monitoring
Contact sales team
No answers on this topic
Offerings
Pricing Offerings
LogicMonitor
SolarWinds Database Performance Analyzer
Free Trial
Yes
Yes
Free/Freemium Version
No
No
Premium Consulting/Integration Services
Yes
No
Entry-level Setup Fee
No setup fee
Optional
Additional Details
Our platform is broken down into Pro and Enterprise Pricing. Pro includes monitoring for all of your cloud, hybrid, and on-premises infrastructure. Our Enterprise package includes all of this, plus our AIOps and Machine Learning functionality that provides dynamic thresholds, root cause analysis, anomaly detection and more!
LogicMonitor only charges by the device. What is considered a device? A device is anything with an IP address that you want to monitor, including a physical device or a cloud resource. This means multiple data sources under the same IP address can be monitored for the same price. Unlike some monitoring platforms. we don’t charge per node, interface, or metric.
—
More Pricing Information
Community Pulse
LogicMonitor
SolarWinds Database Performance Analyzer
Considered Both Products
LogicMonitor
Verified User
Chose LogicMonitor
you can monitor windows and linux servers better. Also you can monitor network hardware and non oracle products.
A de minimis incentive was given to thank the reviewer for their time. The incentive was not used to bias or drive a particular response, nor was the incentive contingent on a positive endorsement. More Info
Verified User
Chose LogicMonitor
One of our main objectives while choosing a next gen monitoring platform was scalability in that regard we were not interested in legacy on prem solution and SAAS model was our preferred solution which supports rapid scalability when needed. Another important objective was to …
A de minimis incentive was given to thank the reviewer for their time. The incentive was not used to bias or drive a particular response, nor was the incentive contingent on a positive endorsement. More Info
The example I will give will explain my rating for it. One employee left our company due to a personal issue, and at that time, our team was working on a highly secure project. He wanted to take revenge on our company, so he began hacking our systems from the outside. Since it appears that someone without authorization is attempting to access our systems, LogicMonitor simultaneously alerted our team to the problem. We stopped that threat with LogicMonitor.
A de minimis incentive was given to thank the reviewer for their time. The incentive was not used to bias or drive a particular response, nor was the incentive contingent on a positive endorsement. More Info
This is an easy 10 because I actually have recommended this product to multiple clients and colleagues! Any shop that writes its own SQL queries will benefit from the insight provided by SolarWinds Database Performance Analyzer, so they know which of their queries is causing a bottleneck. Small shops or databases with only a few tables likely will see far fewer opportunities for optimization.
A de minimis incentive was given to thank the reviewer for their time. The incentive was not used to bias or drive a particular response, nor was the incentive contingent on a positive endorsement. More Info
A de minimis incentive was given to thank the reviewer for their time. The incentive was not used to bias or drive a particular response, nor was the incentive contingent on a positive endorsement. TR verified that a representative sample of customers was invited. More Info
A de minimis incentive was given to thank the reviewer for their time. The incentive was not used to bias or drive a particular response, nor was the incentive contingent on a positive endorsement. More Info
A de minimis incentive was given to thank the reviewer for their time. The incentive was not used to bias or drive a particular response, nor was the incentive contingent on a positive endorsement. More Info
Alerts seem to be lacking in DPA compared to competitor's tools. They can be setup but are not quite as easy or as helpful as some other tools I have used.
Grooming/pruning the repository database isn't very easy. We don't manage a lot of instances but our repo DB has grown pretty significantly.
At times when I am drilled-down to a chart, it can be difficult to navigate around from that point to another time range/query/metric.
A de minimis incentive was given to thank the reviewer for their time. The incentive was not used to bias or drive a particular response, nor was the incentive contingent on a positive endorsement. More Info
This product has met virtually all of our needs. It was easy to implement and has been simple to support. Customization has been intuitive with many options available. They keep adding features and expanding available options. The future of LogicMonitor looks even better than it is today which is very promising. The management and support teams at LogicMonitor are always helpful
A de minimis incentive was given to thank the reviewer for their time. The incentive was not used to bias or drive a particular response, nor was the incentive contingent on a positive endorsement. More Info
We have relied on this product for a very long time and it continues to exceed expectations. The product is a vital part of our organization at this point, it would not be very ideal for us to abandon it. We use it almost every day and depend on its alerts for critical parts of our business
A de minimis incentive was given to thank the reviewer for their time. The incentive was not used to bias or drive a particular response, nor was the incentive contingent on a positive endorsement. More Info
Set up is super easy. Just stand up a small Linux or Windows server to act as a collector. There are no agents to install on monitored devices and all you need is SNMP or WMI access. When creating dashboards, all you have to do is find the widget on the device you want to show up and choose the menu option to add it.
A de minimis incentive was given to thank the reviewer for their time. The incentive was not used to bias or drive a particular response, nor was the incentive contingent on a positive endorsement. More Info
I don't want to think about managing clusters of SQL servers in the future without this tool. We have demoed other tools and SolarWinds Database Performance Analyzer is the gold standard for usability and insight into what your servers are doing. The UI is a bit dated, but everything is laid out in a logical manner and drilling down into queries or timeslices is extremely intuitive.
A de minimis incentive was given to thank the reviewer for their time. The incentive was not used to bias or drive a particular response, nor was the incentive contingent on a positive endorsement. TR verified that a representative sample of customers was invited. More Info
The sales team support we received was top notch. They worked hand in hand to make sure the product met all expectations. So far we have not really had to work with support that much; we have worked with setup team after purchase to deploy product fully. No issues so far and we are four weeks in.
A de minimis incentive was given to thank the reviewer for their time. The incentive was not used to bias or drive a particular response, nor was the incentive contingent on a positive endorsement. More Info
I have had to use their support on a few occasions, for reasons that I am not clear about until recently I have always had problems upgrading the software (although the last 2 updates have gone without issue which I am very pleased to say). On those unfortunate occasions, the support has been brilliant with either excellently documented guides on how to resolve the issue by myself or have been hands-on with calls and screen sharing to remotely fix the issue. Every time the problem was sorted and more importantly, nothing was lost (apart from a bit of time). And as I stated above whatever the problem was that was causing my upgrade issues appears to have been resolved in the last 2 updates.
A de minimis incentive was given to thank the reviewer for their time. The incentive was not used to bias or drive a particular response, nor was the incentive contingent on a positive endorsement. More Info
A de minimis incentive was given to thank the reviewer for their time. The incentive was not used to bias or drive a particular response, nor was the incentive contingent on a positive endorsement. More Info
A de minimis incentive was given to thank the reviewer for their time. The incentive was not used to bias or drive a particular response, nor was the incentive contingent on a positive endorsement. More Info
I did not truly dedicate myself to implementing LogicMonitor. However, I overheard the IT team members explain that "LogicMonitor is perfect for us as it has made most of the work automated, and implementation and training sessions were perfect for us." Thus, I can state that everything went smoothly with our implementation.
A de minimis incentive was given to thank the reviewer for their time. The incentive was not used to bias or drive a particular response, nor was the incentive contingent on a positive endorsement. TR verified that a representative sample of customers was invited. More Info
Follow the guidelines for the capacity of the servers. We found that the DPA databases were getting rather large and also that there are ways to reduce their size built into some of the options.
A de minimis incentive was given to thank the reviewer for their time. The incentive was not used to bias or drive a particular response, nor was the incentive contingent on a positive endorsement. More Info
Basically, we did not have any idea about it and how to choose, but we asked one of our former bosses, as they were very experienced with it, so they helped us by clarifying a few things between New Relic and LogicMonitor, as they told us that if you are looking for an automated option, then there is no better option than LogicMonitor.
A de minimis incentive was given to thank the reviewer for their time. The incentive was not used to bias or drive a particular response, nor was the incentive contingent on a positive endorsement. TR verified that a representative sample of customers was invited. More Info
At the time, we found SolarWinds Database Performance Analyzer to be easier to setup and to have a richer feature set than Redgate SQL Monitor, plus, from what I remember, the DPA pricing worked better for us over the course of a year. We're very happy with all the features DPA has to offer.
A de minimis incentive was given to thank the reviewer for their time. The incentive was not used to bias or drive a particular response, nor was the incentive contingent on a positive endorsement. More Info
Pricing seems to be getting more and more aggressive, I worry that it's going to turn into ServiceNow or SAP and everything minor feature will be an extreme cost that prices out us and our customers
A de minimis incentive was given to thank the reviewer for their time. The incentive was not used to bias or drive a particular response, nor was the incentive contingent on a positive endorsement. More Info
Haven't really used it but our initial onboarding PS was disappointing. Felt like we were being told what we needed to cover as opposed to what we wanted to cover. In addition, we were pushed into using the PS in tight time frames and we were not ready to do so.
A de minimis incentive was given to thank the reviewer for their time. The incentive was not used to bias or drive a particular response, nor was the incentive contingent on a positive endorsement. More Info
A de minimis incentive was given to thank the reviewer for their time. The incentive was not used to bias or drive a particular response, nor was the incentive contingent on a positive endorsement. TR verified that a representative sample of customers was invited. More Info
A de minimis incentive was given to thank the reviewer for their time. The incentive was not used to bias or drive a particular response, nor was the incentive contingent on a positive endorsement. More Info