BrightGauge is a BI tool from ConnectWise that puts essential information in one place, providing visibility for more informed decisions. The user can customize BrightGauge dashboards and sync other business tools in its BI dashboard software for ultimate visibility. Users can also display data with embeddable gauges on public sites.
$325
per month
Reveal
Score10 out of 10
N/A
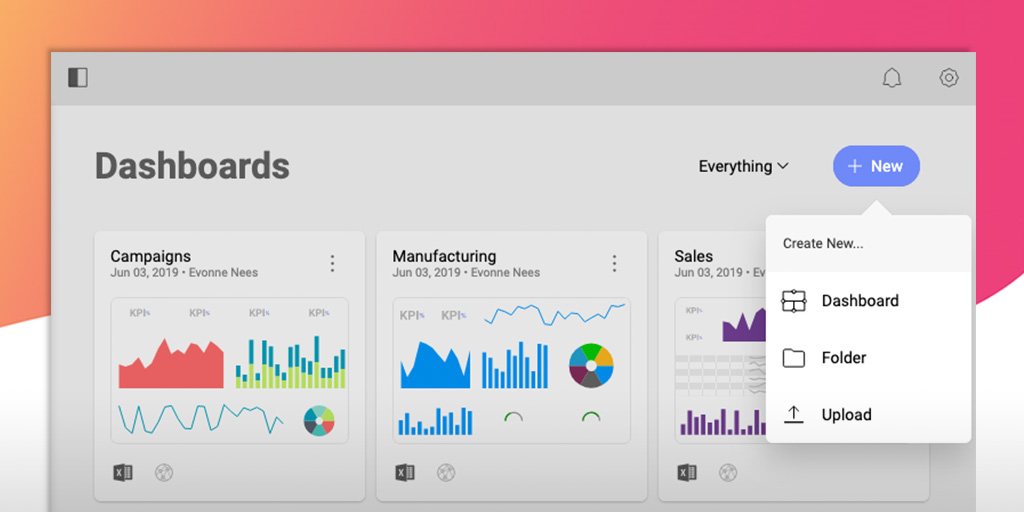
Reveal embedded analytics enables teams and customers to drive data insights with embedded intelligence, transforming the user experience of apps.
Built with embed in mind first, on modern architecture, Reveal’s API aims to remove the complexity of embedding analytics into applications. Reveal’s native SDKs can be integrated into applications on any
platform and tech stack including: .NET Core, Java, NodeJS (coming soon), and
front-end technologies such as React, Angular, WebComponent,…
$0
Pricing
BrightGauge
Reveal
Editions & Modules
Standard
$325
per month
Enterprise
$449
per month
Enterprise+
$635
per month
Embedded Analytics - Contact Us!
$0.00
Offerings
Pricing Offerings
BrightGauge
Reveal
Free Trial
No
Yes
Free/Freemium Version
No
No
Premium Consulting/Integration Services
No
Yes
Entry-level Setup Fee
$499 one-time fee
Optional
Additional Details
Set up fee is waived for Enterprise+ customers. A discount is offered for annual billing.
BrightGauge lets us know when we have critical issues that need solving. A massive influx of tickets all at the same time triggers an investigation. Usually, it is tied to a server going down, which we can address. It would not be helpful for a small MSP or IT department with just a few daily tickets. The stats are better used to track a large amount of clients.
A de minimis incentive was given to thank the reviewer for their time. The incentive was not used to bias or drive a particular response, nor was the incentive contingent on a positive endorsement. More Info
As a company responsible for people money we have to deal with following challenges every day: Clients who want to track the status of their transfers. Licensing agencies who need to ensure professional standards are met. Internal team managers who need to track client and staff progress to ensure company progression and success. Reveal does a good job as self-service tool enabling the accountable parties to have full access to important insights 24/7. The prebuilt dashboard themes save time and investment as we don’t need to hire a dedicated data analyst. The interactive dashboards give full transparency. The ability to easily create, analyze and report keeps clients, partners and stuff on the same page.
A de minimis incentive was given to thank the reviewer for their time. The incentive was not used to bias or drive a particular response, nor was the incentive contingent on a positive endorsement. More Info
Ease of Use - Reveal is super intuitive when it comes to creating dashboards. You don't need to be a data expert, which is key for me.
Sharing - The ability to share across our teams, locations, and with clients is great. We create teams for our different clients and share dashboards there that also are connected to our company dashboards.
Support and Roadmap - Reveal support has been great. They care about the needs of their customers. They have released 3 updates in the last few months, and they are adding a lot of value.
A de minimis incentive was given to thank the reviewer for their time. The incentive was not used to bias or drive a particular response, nor was the incentive contingent on a positive endorsement. More Info
Annual or more than annualized data is desperately needed for MSPs to show trends, current limitation is previous 240 days for ConnectWise tickets
Alerts when datasets do not sync properly, I have to rely on my team to notice vs get an automated alert from BrightGauge
Small thing, but it would be nice to have more options on the report scheduler to enable a start date. If you wish to do it quarterly, you have to start the schedule exactly 3 months from the next run.
A de minimis incentive was given to thank the reviewer for their time. The incentive was not used to bias or drive a particular response, nor was the incentive contingent on a positive endorsement. More Info
A de minimis incentive was given to thank the reviewer for their time. The incentive was not used to bias or drive a particular response, nor was the incentive contingent on a positive endorsement. TR verified that a representative sample of customers was invited. More Info
As a developer of the project, I feel comfortable with this tool for its peculiarities: acceptable costs, simple configuration, creation and maintenance of simple reports, fairly complete account management, also, not least, I appreciate the work done by their technical support always timely intervention and, above all, resolutive. Furthermore, as far as end users are concerned, I found a good appreciation of the proposed reports
A de minimis incentive was given to thank the reviewer for their time. The incentive was not used to bias or drive a particular response, nor was the incentive contingent on a positive endorsement. More Info
Usability is BrightGauge's strength. Granting the ability of virtually any user to be able to create a dashboard is incredibly valuable. If an organization very simple and straight forward reporting needs then BrightGauge is a perfect fit for them. Connecting to the dataset we used was very quick and easy and I imagine it would be the same for any major data source you would like to pull from.
A de minimis incentive was given to thank the reviewer for their time. The incentive was not used to bias or drive a particular response, nor was the incentive contingent on a positive endorsement. More Info
Reveal has a great usability for any level of computer user. The only major thing I see that is not exactly user friendly, is the color scheme issue I stated earlier in my review. Although, I am coming from a graphic design background, I need a platform that every team member in our office can use.
A de minimis incentive was given to thank the reviewer for their time. The incentive was not used to bias or drive a particular response, nor was the incentive contingent on a positive endorsement. More Info
This assessment is due to the fact that I have not yet found Reveal not available for use. Apart from some problems of development crash, then fixed by the product assistance service, I have not found any particular problems or loss of time caused by the instrument.
A de minimis incentive was given to thank the reviewer for their time. The incentive was not used to bias or drive a particular response, nor was the incentive contingent on a positive endorsement. More Info
The pages load rather quickly even in the presence of several elevations in the same dashboard that insist on different data sources and with visualizations that insist on different types of graph. I can only be satisfied with these performances.
A de minimis incentive was given to thank the reviewer for their time. The incentive was not used to bias or drive a particular response, nor was the incentive contingent on a positive endorsement. More Info
Anytime I have reached out to the BrightGauge support team they have been quick, responsive, and solved my issue. They go out of their way to be helpful!
A de minimis incentive was given to thank the reviewer for their time. The incentive was not used to bias or drive a particular response, nor was the incentive contingent on a positive endorsement. More Info
None in particular, however, would be welcome if improvements were made in the personalization of the prospects and in the connection between them (perhaps being able to transfer the selections present in one prospect to another recalled by the first).
A de minimis incentive was given to thank the reviewer for their time. The incentive was not used to bias or drive a particular response, nor was the incentive contingent on a positive endorsement. More Info
I'm not aware of any other competitors to Bright Gauge that we selected. They seem to be very close to managed IT service providers and have been great at tailoring their support to the PSAs like ConnectWise, AutoTask, etc. I can see Bright Gauge getting more and more popular as time goes by
A de minimis incentive was given to thank the reviewer for their time. The incentive was not used to bias or drive a particular response, nor was the incentive contingent on a positive endorsement. More Info
Lacks ability to generate analytics as complex as Tableau and not as easy to embed and interface with other software and databases as Looker. But a very good option for those not needing the complexities found in other products.
A de minimis incentive was given to thank the reviewer for their time. The incentive was not used to bias or drive a particular response, nor was the incentive contingent on a positive endorsement. More Info
This evaluation is the result of the fact that I have not had the opportunity to deepen the Reveal interface with other tools and / or other software, so the evaluation that I am giving follows what I have been able to read regarding the characteristics of the product online.
A de minimis incentive was given to thank the reviewer for their time. The incentive was not used to bias or drive a particular response, nor was the incentive contingent on a positive endorsement. More Info
A de minimis incentive was given to thank the reviewer for their time. The incentive was not used to bias or drive a particular response, nor was the incentive contingent on a positive endorsement. More Info
A de minimis incentive was given to thank the reviewer for their time. The incentive was not used to bias or drive a particular response, nor was the incentive contingent on a positive endorsement. More Info