TrustRadius: an HG Insights company

BrightGauge vs. Flexmonster Pivot Table & Charts Component

Save this comparison

Save this comparison

Add Product

Recommended Comparisons

    Overview
    ProductRatingMost Used ByProduct SummaryStarting Price

    BrightGauge

    Score9.1 out of 10
    N/ABrightGauge is a BI tool from ConnectWise that puts essential information in one place, providing visibility for more informed decisions. The user can customize BrightGauge dashboards and sync other business tools in its BI dashboard software for ultimate visibility. Users can also display data with embeddable gauges on public sites.

    $325

    per month

    Flexmonster Pivot Table & Charts Component

    Score10 out of 10
    Mid-Size Companies (51-1,000 employees)
    Flexmonster Pivot Table & Charts is a component for interactive pivot reports that can be inserted into a web page or a web application. It’s a JavaScript tool that enables a user to visualize their business data. This solution supports Microsoft Analysis Services OLAP cubes, Mondrian, icCube, JSON, SQL (MS SQL, MySQL and others) databases or static JSON or CSV files. According to the vendor, this solution allows users to work extremely quickly with really large data…

    $0

    Annual SaaS Subscription

    Pricing
    BrightGaugeFlexmonster Pivot Table & Charts Component
    Editions & Modules
    Standard
    $325
    per month
    Enterprise
    $449
    per month
    Enterprise+
    $635
    per month
    Pivot Table for SQL/CSV/JSON Unlimited
    $0
    Annual SaaS Subscription
    Pivot Table for Pentaho Mondrian
    $0
    Annual SaaS Subscription
    Pivot Table for MS Analysis Services
    $0
    Annual SaaS Subscription
    Pivot Table for SQL/CSV/JSON Basic
    $299
    Annual subscription
    Pivot Table for Pentaho Mondrian
    $799
    Annual subscription
    Pivot Table for SQL/CSV/JSON Unlimited
    $799
    Annual subscription
    Pivot Table for MS Analysis Services
    $799
    Annual subscription
    Offerings
    Pricing Offerings
    BrightGaugeFlexmonster Pivot Table & Charts Component
    Free Trial
    NoYes
    Free/Freemium Version
    NoNo
    Premium Consulting/Integration Services
    NoYes
    Entry-level Setup Fee$499 one-time feeNo setup fee
    Additional DetailsSet up fee is waived for Enterprise+ customers. A discount is offered for annual billing.—
    More Pricing Information
    Community Pulse
    BrightGaugeFlexmonster Pivot Table & Charts Component
    Considered Both Products
    ConnectWise
    No answer on this topic
    Flexmonster
    No answer on this topic
    Key User Insights
    Would buy again
    100%
    Would buy again
    8 Answers
    No answers on this topic
    Delivers good value for the price
    100%
    Delivers good value for the price
    8 Answers
    No answers on this topic
    Happy with the feature set
    100%
    Happy with the feature set
    8 Answers
    No answers on this topic
    Lived up to sales and marketing promises
    100%
    Lived up to sales and marketing promises
    7 Answers
    No answers on this topic
    Implementation went as expected
    100%
    Implementation went as expected
    7 Answers
    No answers on this topic
    Features
    BrightGaugeFlexmonster Pivot Table & Charts Component
    BI Standard Reporting
    Comparison of BI Standard Reporting features of BrightGauge and Flexmonster Pivot Table & Charts Component
    Feature
    BrightGauge
    8.1
    14 Ratings
    1% below category average
    Flexmonster Pivot Table & Charts Component
    10.0
    1 Ratings
    20% above category average
    Pixel Perfect reports8.210 Ratings00 Ratings
    Customizable dashboards8.814 Ratings00 Ratings
    Report Formatting Templates7.113 Ratings10.01 Ratings
    Ad-hoc Reporting
    Comparison of Ad-hoc Reporting features of BrightGauge and Flexmonster Pivot Table & Charts Component
    Feature
    BrightGauge
    7.7
    14 Ratings
    5% below category average
    Flexmonster Pivot Table & Charts Component
    9.5
    1 Ratings
    16% above category average
    Drill-down analysis8.414 Ratings00 Ratings
    Formatting capabilities8.513 Ratings9.01 Ratings
    Integration with R or other statistical packages4.67 Ratings00 Ratings
    Report sharing and collaboration9.213 Ratings10.01 Ratings
    Report Output and Scheduling
    Comparison of Report Output and Scheduling features of BrightGauge and Flexmonster Pivot Table & Charts Component
    Feature
    BrightGauge
    7.9
    14 Ratings
    5% below category average
    Flexmonster Pivot Table & Charts Component
    10.0
    1 Ratings
    18% above category average
    Publish to Web9.410 Ratings00 Ratings
    Publish to PDF7.414 Ratings10.01 Ratings
    Report Versioning5.07 Ratings00 Ratings
    Report Delivery Scheduling9.214 Ratings00 Ratings
    Delivery to Remote Servers8.44 Ratings00 Ratings
    Data Discovery and Visualization
    Comparison of Data Discovery and Visualization features of BrightGauge and Flexmonster Pivot Table & Charts Component
    Feature
    BrightGauge
    5.9
    12 Ratings
    30% below category average
    Flexmonster Pivot Table & Charts Component
    -
    Ratings
    Pre-built visualization formats (heatmaps, scatter plots etc.)8.012 Ratings00 Ratings
    Location Analytics / Geographic Visualization7.26 Ratings00 Ratings
    Predictive Analytics6.16 Ratings00 Ratings
    Pattern Recognition and Data Mining2.52 Ratings00 Ratings
    Access Control and Security
    Comparison of Access Control and Security features of BrightGauge and Flexmonster Pivot Table & Charts Component
    Feature
    BrightGauge
    8.7
    14 Ratings
    3% above category average
    Flexmonster Pivot Table & Charts Component
    -
    Ratings
    Multi-User Support (named login)9.614 Ratings00 Ratings
    Role-Based Security Model9.313 Ratings00 Ratings
    Multiple Access Permission Levels (Create, Read, Delete)8.313 Ratings00 Ratings
    Report-Level Access Control8.34 Ratings00 Ratings
    Single Sign-On (SSO)8.35 Ratings00 Ratings
    Mobile Capabilities
    Comparison of Mobile Capabilities features of BrightGauge and Flexmonster Pivot Table & Charts Component
    Feature
    BrightGauge
    6.8
    7 Ratings
    14% below category average
    Flexmonster Pivot Table & Charts Component
    10.0
    1 Ratings
    24% above category average
    Responsive Design for Web Access8.56 Ratings10.01 Ratings
    Mobile Application6.01 Ratings00 Ratings
    Dashboard / Report / Visualization Interactivity on Mobile5.86 Ratings00 Ratings
    Application Program Interfaces (APIs) / Embedding
    Comparison of Application Program Interfaces (APIs) / Embedding features of BrightGauge and Flexmonster Pivot Table & Charts Component
    Feature
    BrightGauge
    7.4
    8 Ratings
    5% below category average
    Flexmonster Pivot Table & Charts Component
    -
    Ratings
    REST API8.26 Ratings00 Ratings
    Javascript API9.62 Ratings00 Ratings
    iFrames10.02 Ratings00 Ratings
    Java API6.01 Ratings00 Ratings
    Themeable User Interface (UI)3.53 Ratings00 Ratings
    Customizable Platform (Open Source)7.03 Ratings00 Ratings
    Best Alternatives
    BrightGaugeFlexmonster Pivot Table & Charts Component
    Small Businesses
    Cyfe
    Score8.8 out of 10
    Cyfe
    Score8.8 out of 10
    Medium-sized Companies
    Zendesk Explore
    Score8.7 out of 10
    Zendesk Explore
    Score8.7 out of 10
    Enterprises
    Jaspersoft Community Edition
    Score9.7 out of 10
    Jaspersoft Community Edition
    Score9.7 out of 10
    All AlternativesView all alternativesView all alternatives
    User Ratings
    BrightGaugeFlexmonster Pivot Table & Charts Component
    Likelihood to Recommend
    9.2
    (14 ratings)
    10.0
    (1 ratings)
    Usability
    8.4
    (7 ratings)
    9.0
    (1 ratings)
    Support Rating
    10.0
    (2 ratings)
    10.0
    (1 ratings)
    Data Sharing and Collaboration
    9.4
    (6 ratings)
    -
    (0 ratings)
    Data Sources
    9.0
    (6 ratings)
    -
    (0 ratings)
    User Testimonials
    BrightGaugeFlexmonster Pivot Table & Charts Component
    Likelihood to Recommend
    ConnectWise
    BrightGauge lets us know when we have critical issues that need solving. A massive influx of tickets all at the same time triggers an investigation. Usually, it is tied to a server going down, which we can address. It would not be helpful for a small MSP or IT department with just a few daily tickets. The stats are better used to track a large amount of clients.
    Incentivized
    Read full review
    Flexmonster
    Fantastic product to embed in any SaaS solution for reporting and data exports. Excellent performance, ability to customize fields and tons of other features out of the box that makes it a well-rounded tool that is easy to use. To top it off their support is amazing for answering technical questions quickly and they provide great examples to learn how to interact with the code. We are very happy with our choice to use Flexmonster!
    Incentivized
    Read full review
    Pros
    ConnectWise
    • SQL queries can be presented in many different ways to illustrate the data. They can be used in lists, graphs, meter, etc.
    • The datasets frequency of updates can be customized to from 5 minutes to annually. It's very granular in this respect.
    • It allows dashboards to be shared outside your organization with clients, partners, and vendors to maximize collaboration and reporting.
    Incentivized
    Read full review
    Flexmonster
    No answers on this topic
    Cons
    ConnectWise
    • Annual or more than annualized data is desperately needed for MSPs to show trends, current limitation is previous 240 days for ConnectWise tickets
    • Alerts when datasets do not sync properly, I have to rely on my team to notice vs get an automated alert from BrightGauge
    • Small thing, but it would be nice to have more options on the report scheduler to enable a start date. If you wish to do it quarterly, you have to start the schedule exactly 3 months from the next run.
    Incentivized
    Read full review
    Flexmonster
    No answers on this topic
    Usability
    ConnectWise
    Usability is BrightGauge's strength. Granting the ability of virtually any user to be able to create a dashboard is incredibly valuable. If an organization very simple and straight forward reporting needs then BrightGauge is a perfect fit for them. Connecting to the dataset we used was very quick and easy and I imagine it would be the same for any major data source you would like to pull from.
    Incentivized
    Read full review
    Flexmonster
    Checks all the boxes! Easy to use, great out of the box feature set and fantastic support team
    Incentivized
    Read full review
    Support Rating
    ConnectWise
    Anytime I have reached out to the BrightGauge support team they have been quick, responsive, and solved my issue. They go out of their way to be helpful!
    Incentivized
    Read full review
    Flexmonster
    Quick response to questions and feedback, excellent documentation for learning about the product and tons of examples to leverage.
    Incentivized
    Read full review
    Alternatives Considered
    ConnectWise
    I'm not aware of any other competitors to Bright Gauge that we selected. They seem to be very close to managed IT service providers and have been great at tailoring their support to the PSAs like ConnectWise, AutoTask, etc. I can see Bright Gauge getting more and more popular as time goes by
    Incentivized
    Read full review
    Flexmonster
    No answers on this topic
    Return on Investment
    ConnectWise
    • We were purchased by a large PE firm because we could easily show CSAT ratings.
    • The easily trackable stats are suitable for the C-Suite to see which division is the most profitable.
    • We won 60,000 MRR by displaying to potential customers how we track important issues with the gauges.
    Incentivized
    Read full review
    Flexmonster
    No answers on this topic
    ScreenShots

    Flexmonster Pivot Table & Charts Component Screenshots

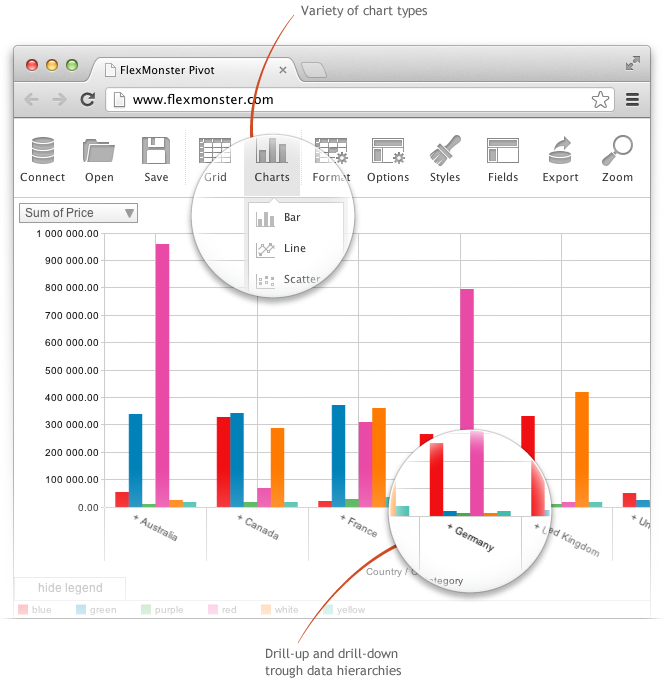
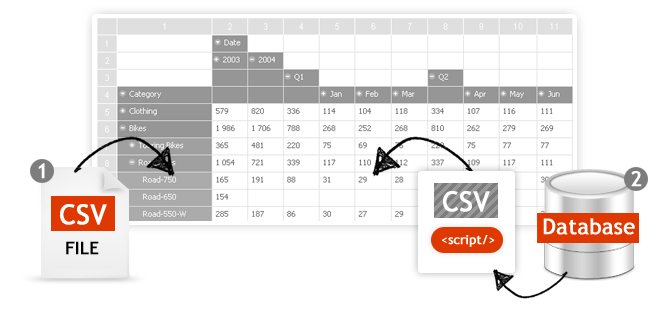
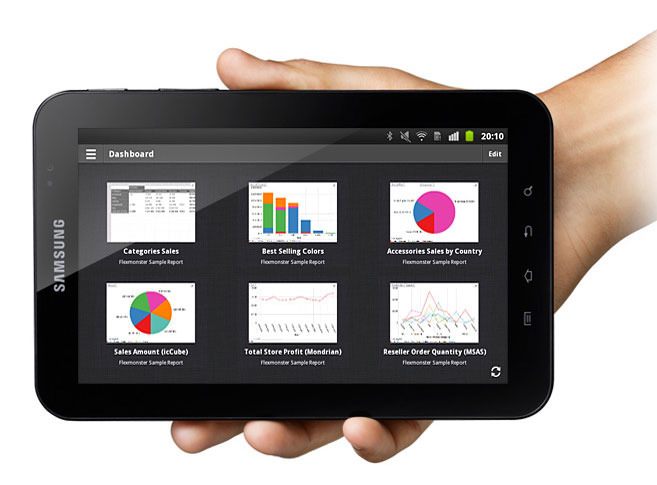
    Screenshot of Pivot Component supports the printing of the Pivot view. Additionally users can export the reports into a variety of formats.Screenshot of Pivot Table Component helps you to create interactive pivot tables and charts reports for web and Flex applications. Pivot Component will provide your customers with an extremely intuitive end-user experience while creating and analyzing reports.Screenshot of Pivot Charts provide an alternative, interactive way to visualize data.Screenshot of The component will connect to any database: MS SQL, MySQL, Oracle, PostgreSQL - using simple script generating CSV output to enable real-time business analysis. Pivot Component is full browser-side component, thus you can use any desired server-side to generate CSV data.Screenshot of Pivot Table Component can connect to OLAP cubes via XMLA protocol. XMLA is XML for Analysis - an industry standard for data access in analytical systems, such as OLAP and Data Mining.Screenshot of Start mobile business reporting with the Flexmonster mobile application. It can be downloaded to your tablets from Google Play or Apple App Store.