TrustRadius: an HG Insights company

SolarWinds Database Performance Monitor

Score9.2 out of 10

15 Reviews and Ratings

What is SolarWinds Database Performance Monitor?

Read more details.

Media

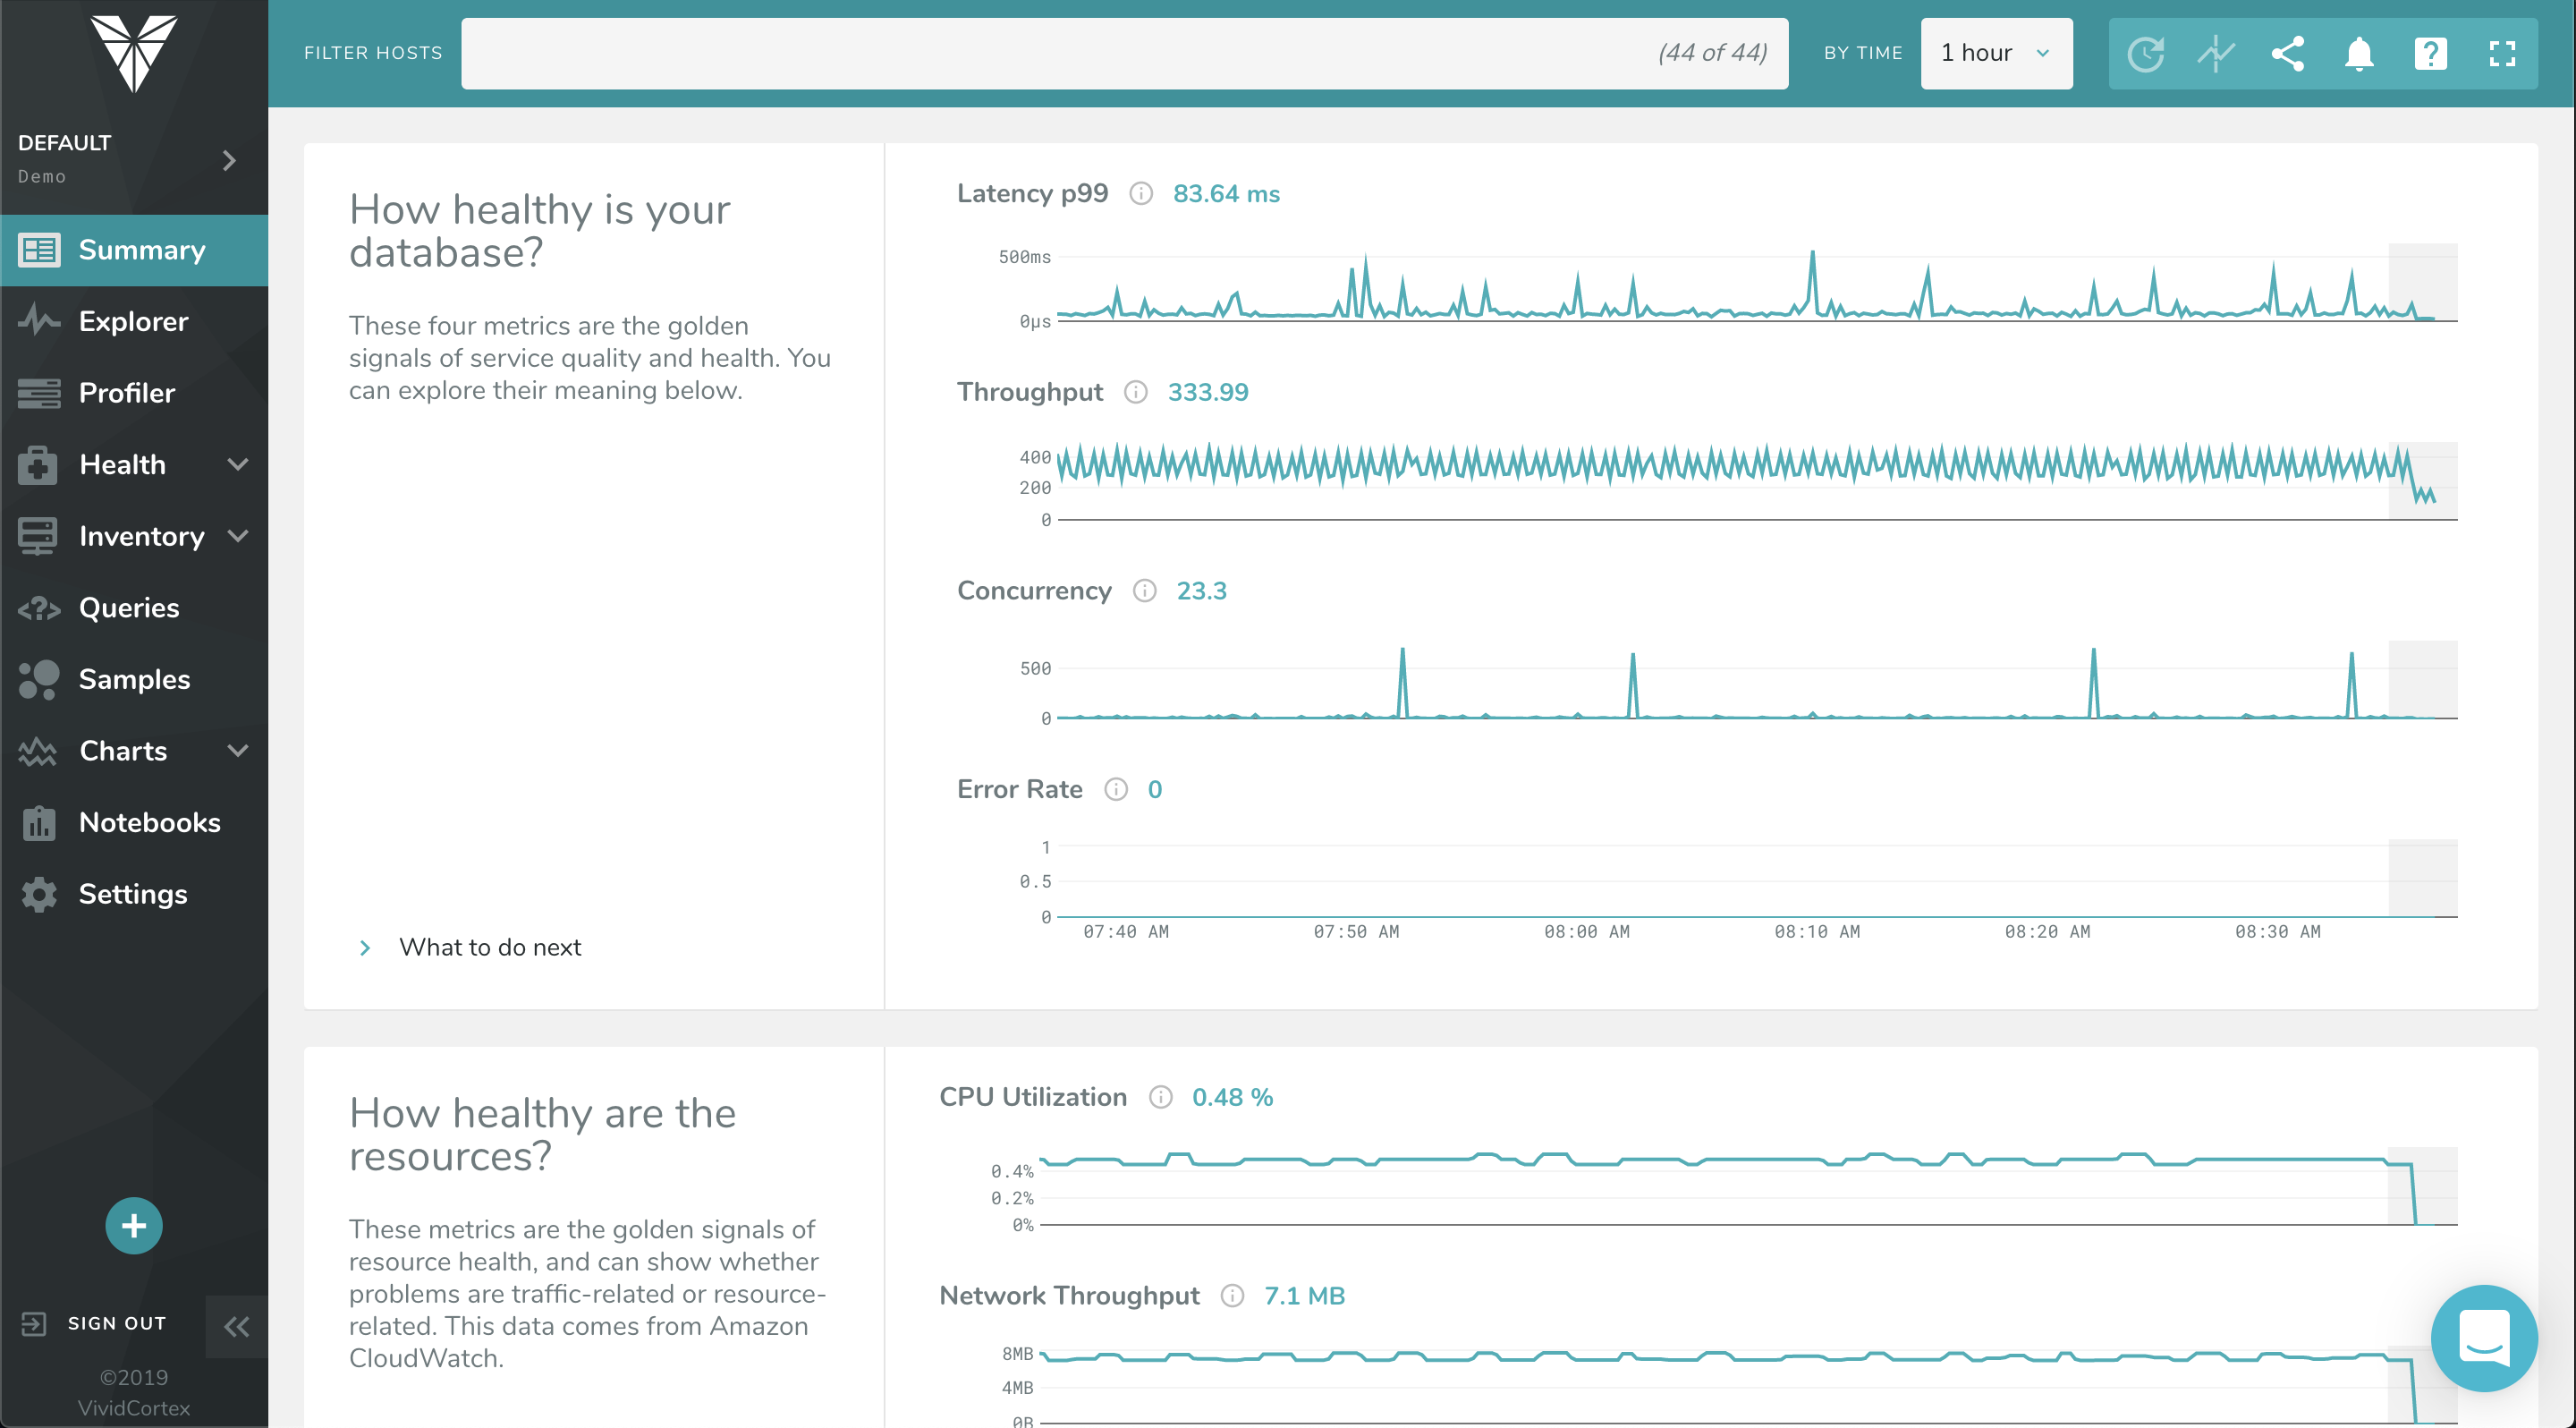
Screenshot of The Profiler Dashboard is a powerful, dynamic dashboard for ranking and filtering activity on your servers: It can instantly show you what needs attention and it provides a unified view of all your database types that VividCortex monitors. It enables you to view and understand your system by profiling it according to its most significant attributes—customized and selected by you.
Screenshot of This dashboard displays a list of queries and allows you to filter them with powerful specificity. Filters can be set according to query text, host, and timeframe when the query was first seen / last active.
Screenshot of VividCortex captures an enormous amount of data, and the Summary Dashboard helps users make sense of it, reducing their time-to-insight. It features widgets with automatic displays for Top 5 Queries by Total Time, Top 5 Queries by User CPU, Application Overview, Critical Events, and more.
Screenshot of VividCortex monitors thousands of metrics in your system, and the Charts and Dashboard’s navigation pane allows you to toggle, customize, and enable various categories of generated charts. You can then easily navigate and examine the charts’ metrics with mouseover and zoom capabilities.

1 / 4

Screenshot of The Profiler Dashboard is a powerful, dynamic dashboard for ranking and filtering activity on your servers: It can instantly show you what needs attention and it provides a unified view of all your database types that VividCortex monitors. It enables you to view and understand your system by profiling it according to its most significant attributes—customized and selected by you.

Stupid-proof your DB instances.

Use Cases and Deployment Scope

As with most companies, DB instances power our business app & DB admins need optimal performance. Having an internal view of DB issues & performance helps us optimize the DB instances that are integral to operations.

Pros

  • Simple to use and very easy to learn.
  • The execution engines run in parallel, can execute any syntax or query.
  • DPN can run all queries for both Oracle and SQL with no additional support.

Cons

  • The Reporting feature currently doesn't allow customization.

Most Important Features

  • Virtual infrastructure resource monitoring.
  • DB performance analysis.
  • Internal view of DB issues & performance.

Return on Investment

  • What is the cost of a downed DB instance? That's your ROI. DPM lets you see issues before they become critical.

Alternatives Considered

Oracle Enterprise Manager

Other Software Used

IFS Applications, Carbonite Backup for Microsoft 365, Carbonite Endpoint, SonicWall Capture Advanced Threat Protection (ATP)