#1 most frequent
United States of America
73.7%558 installations of 757


1 / 11
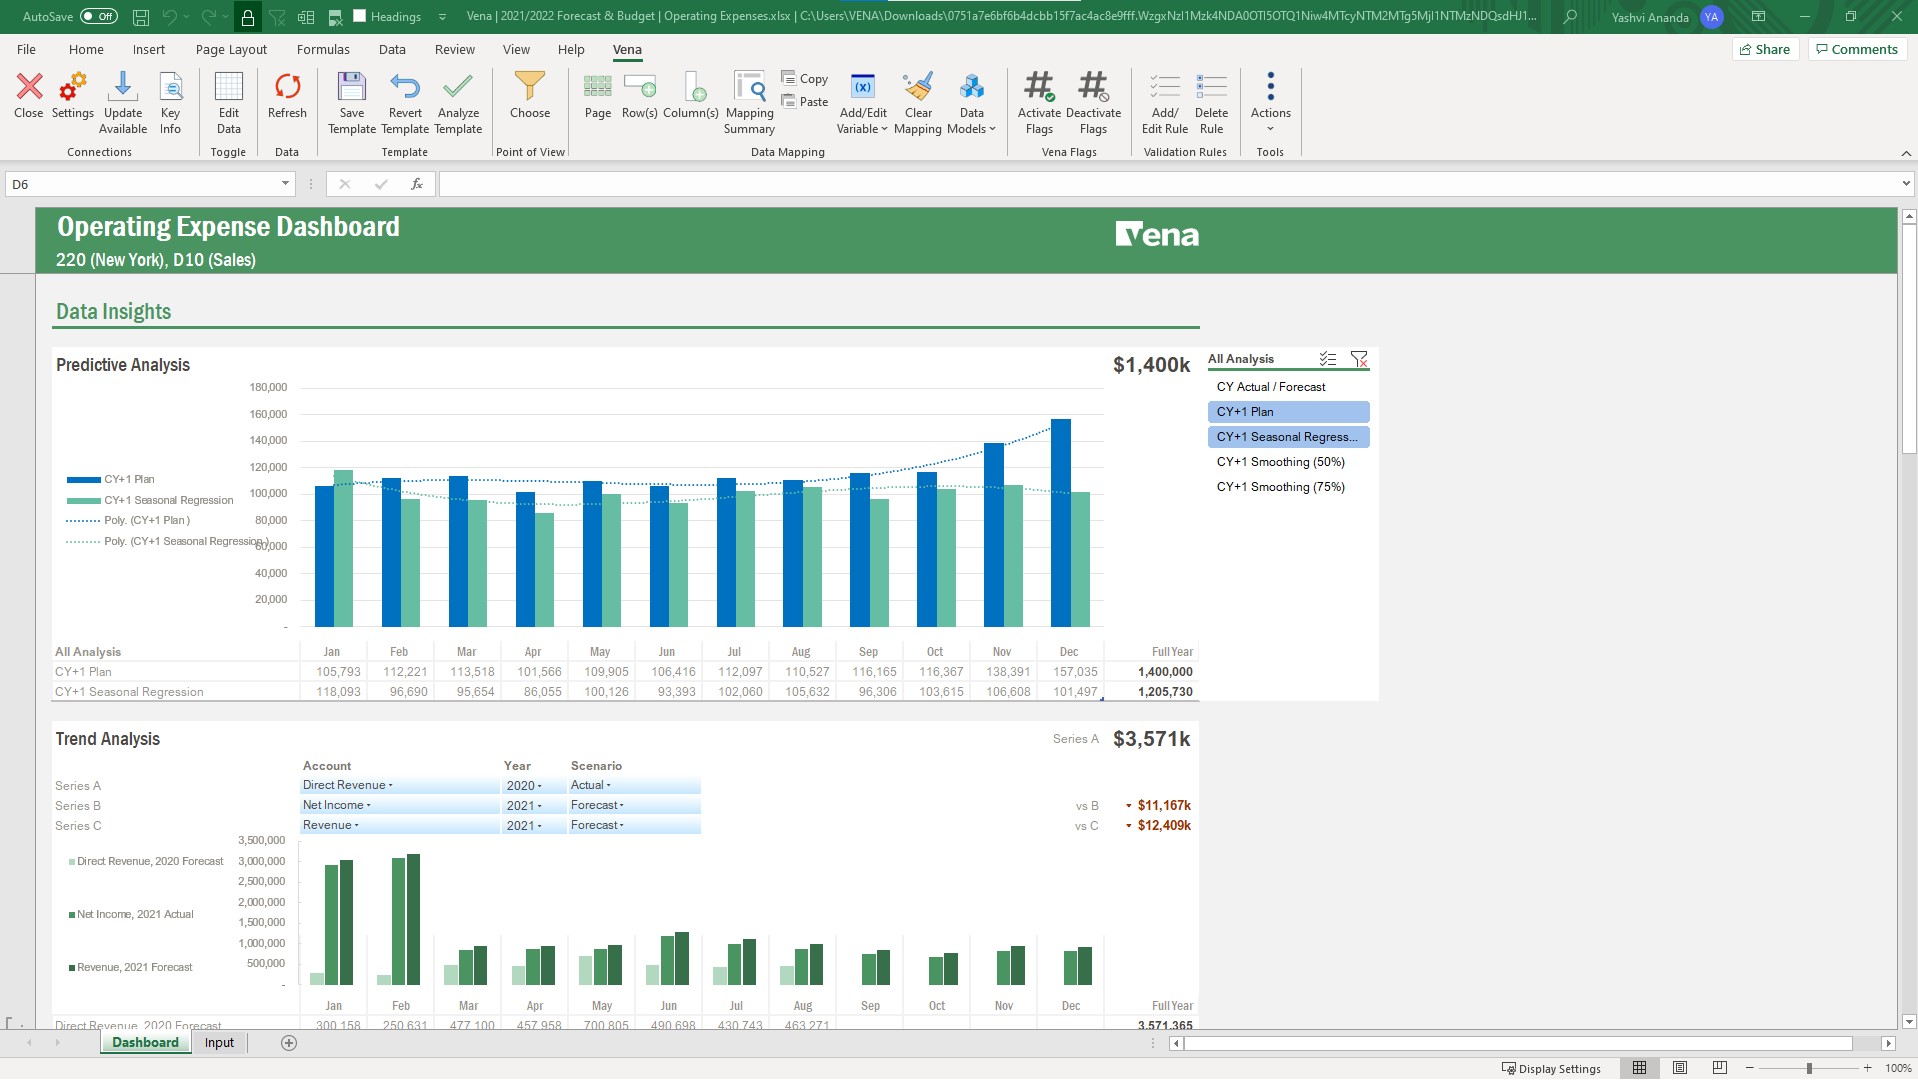
Screenshot of Operation Expenses - Predictive Analysis
Budget vs. actual or forecast, P&L’s, performance over time, between products etc.
Category average: 8.5
Ad hoc or formatted reports using MS Excel.
Category average: 8.4
Ability to integrate directly with Excel data.
Category average: 8.5
Ability to handle foreign currency conversions during consolidation.
Category average: 7.4
Select from a library of more than 6,000 key performance indicators, and incorporate KPIs into your planning process.
Category average: 7.6
Integration with the open-source R predictive modeling environment.
Category average: 7.4
558 installations of 757
104 installations of 757
41 installations of 757