


Great for Live Connections

Use Cases and Deployment Scope
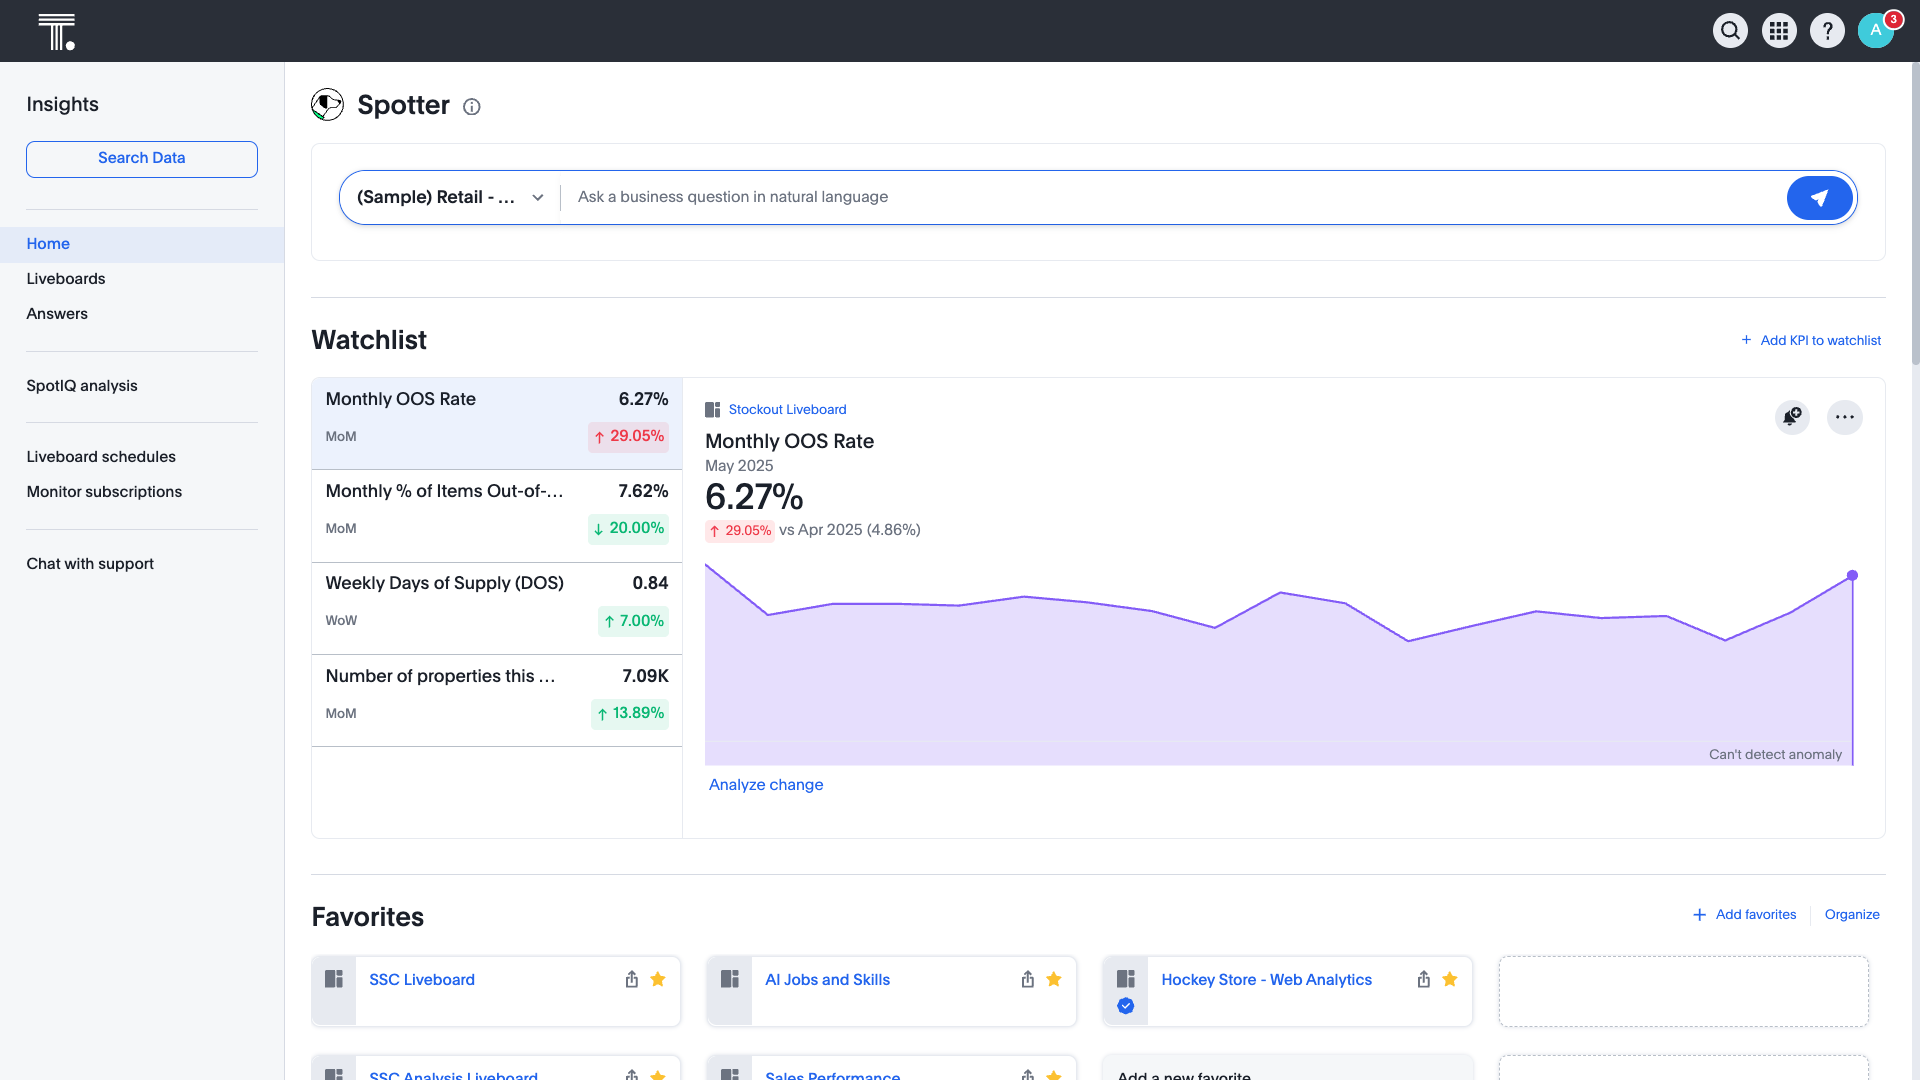
We use ThoughtSpot for reporting, to generate insights, ask questions, and to deliver dashboards/reporting to our business teams
Pros
- Live Connection
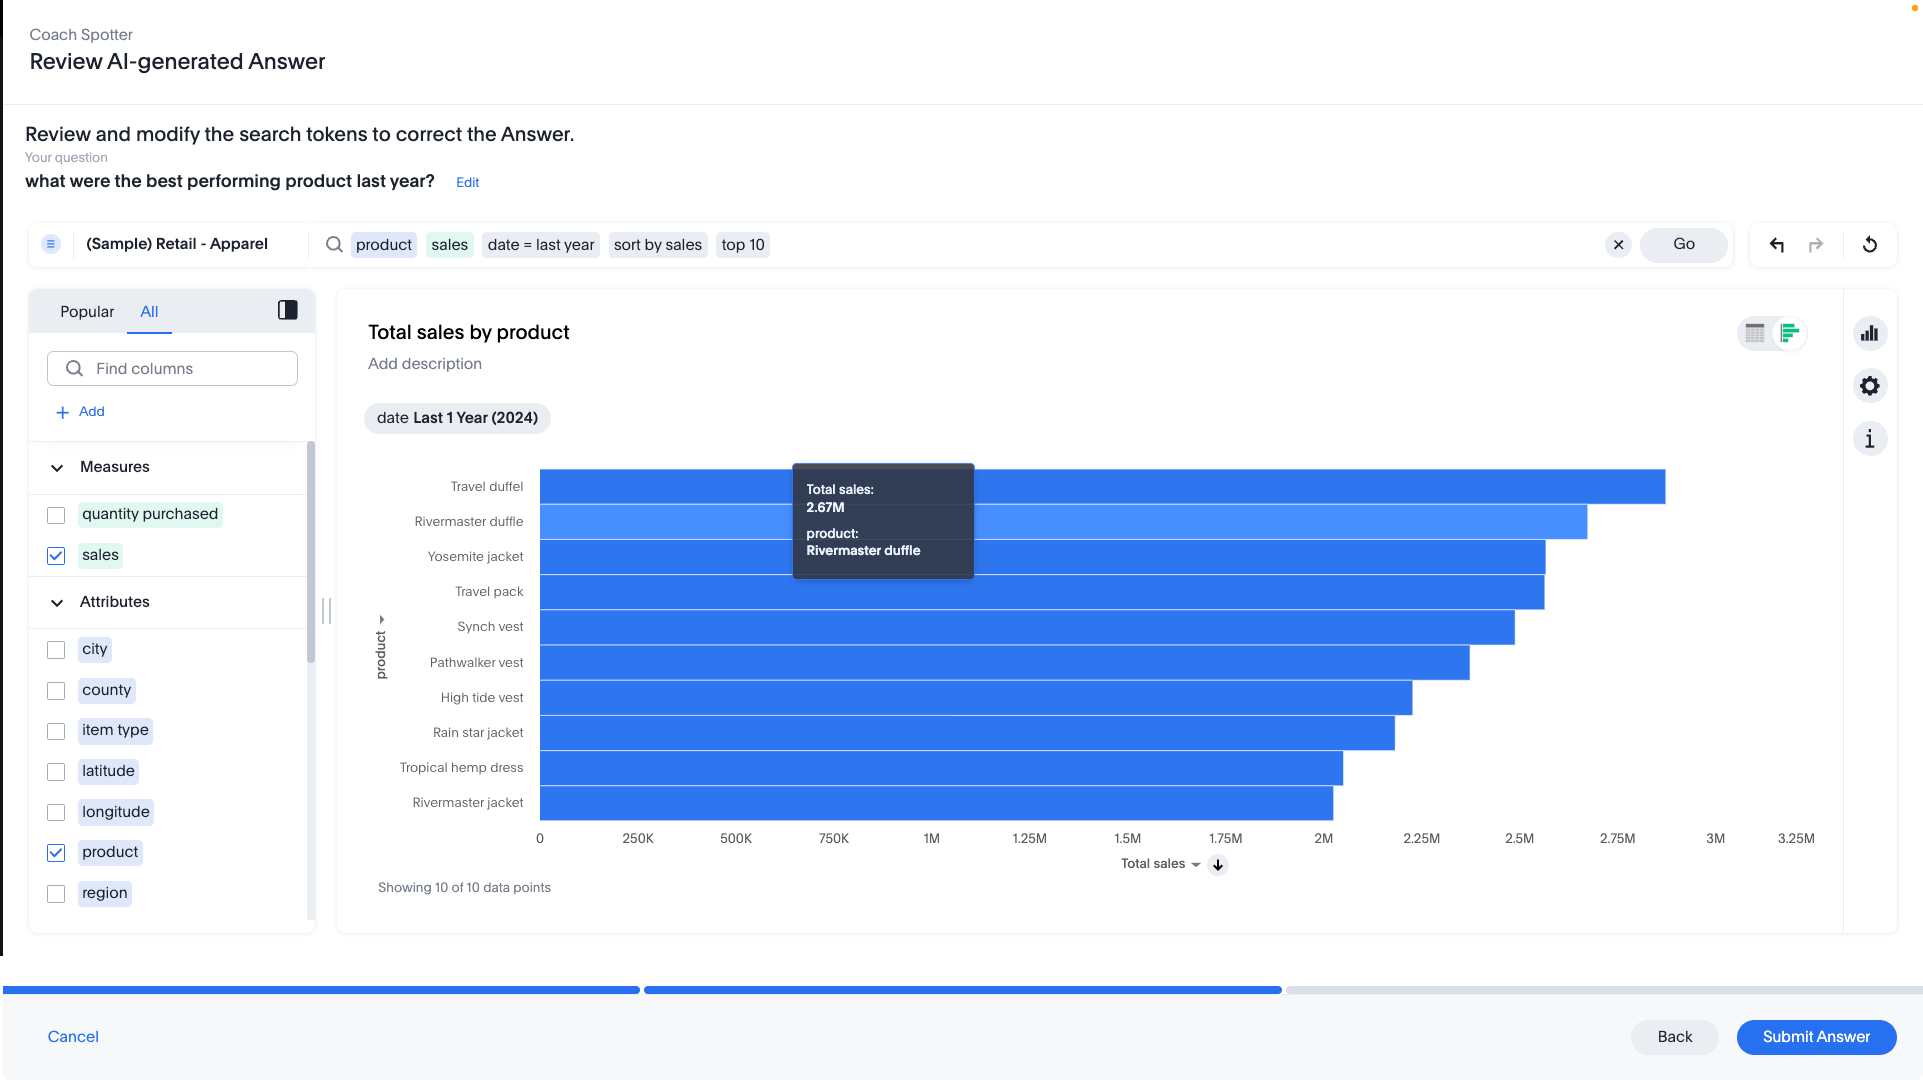
- Natural Language
- Performance
Cons
- Setting up data connections
- More intuitive interface
- Stronger community
Return on Investment
- Sped up time to insight
- Faster to decision making
- better performance
- Cost savings
- Time savings
Usability
Alternatives Considered
Tableau Desktop and Microsoft Power BI
Other Software Used
Tableau Desktop, Tableau Server, Microsoft Power BI


