
#1 most frequent
United States of America
87.5%154 installations of 176
1 / 5
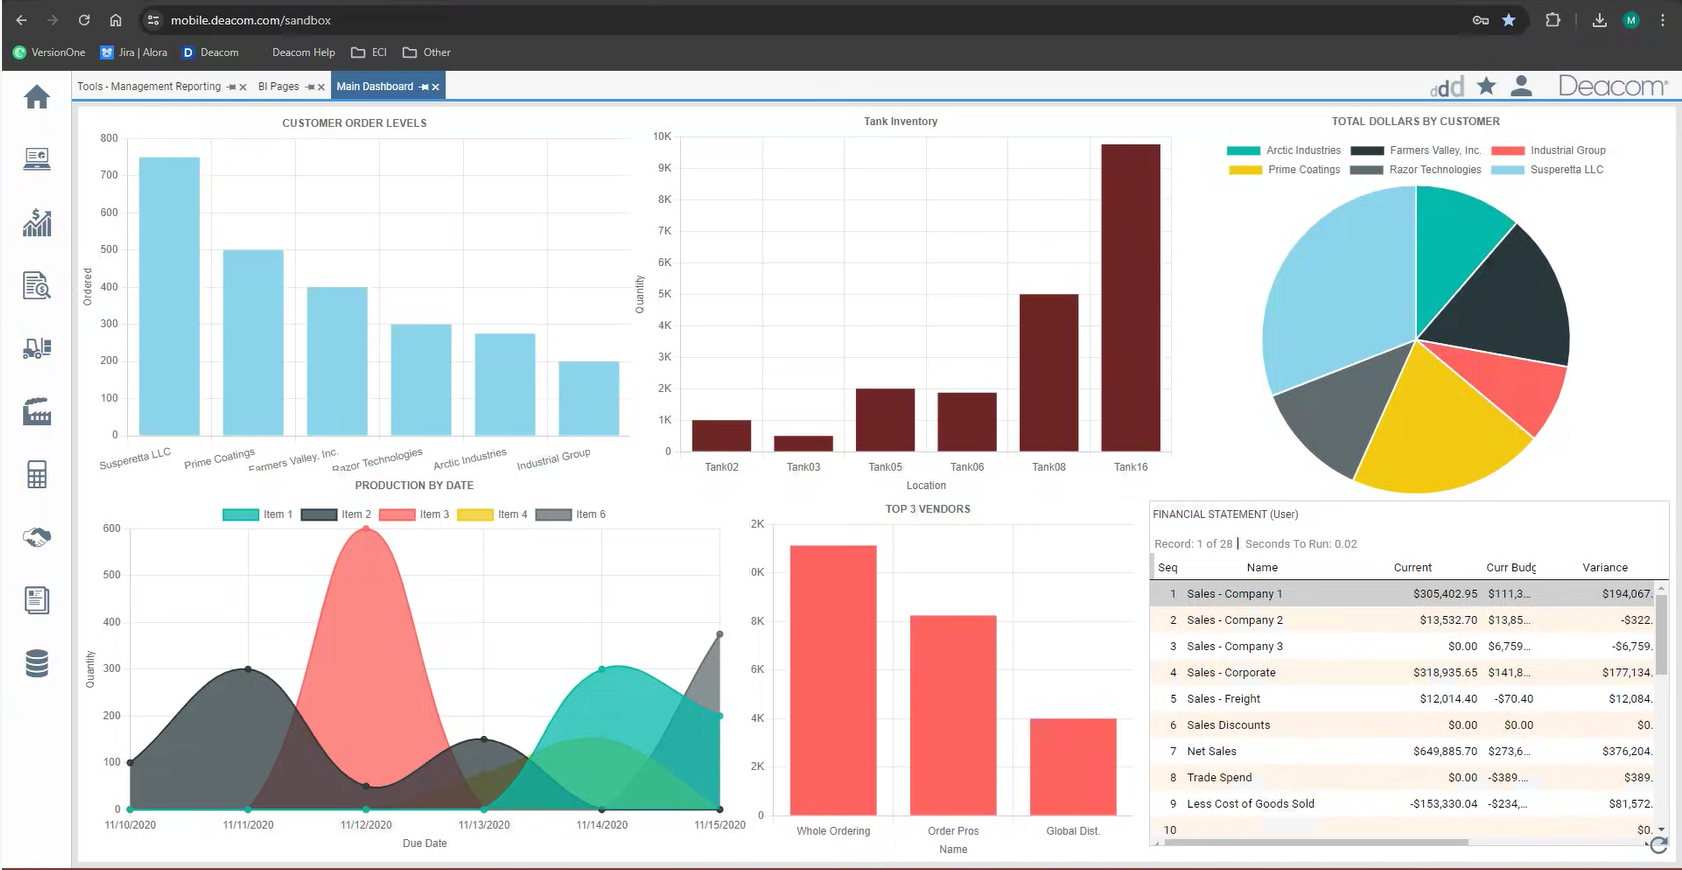
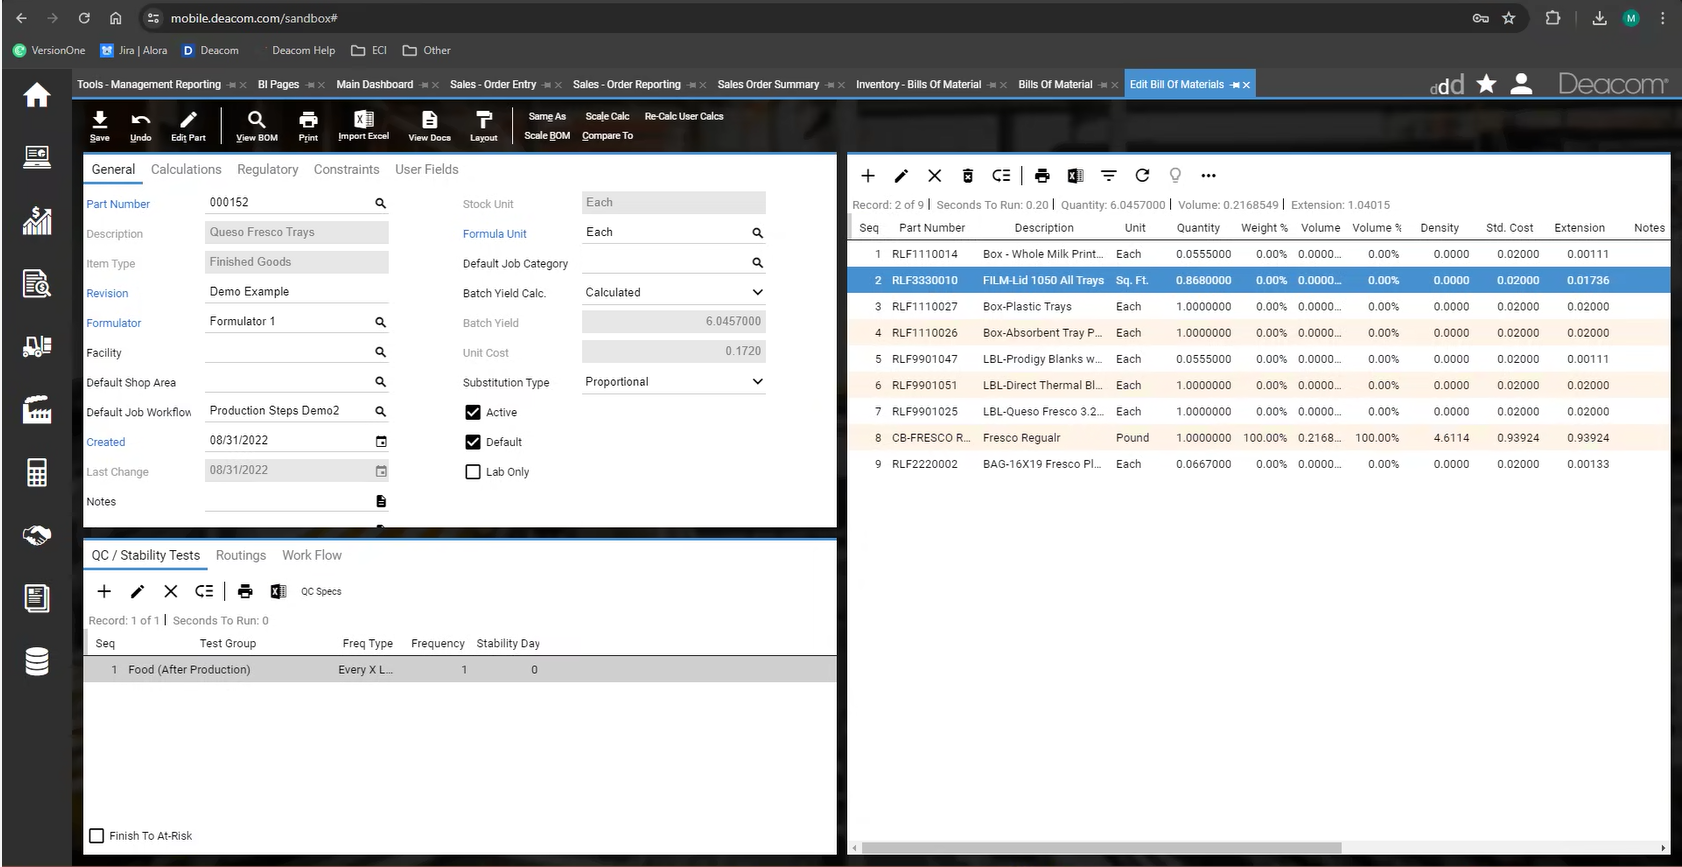
Screenshot of Deacom's customizable dashboards. These interactive dashboards visually represent key metrics and performance indicators. Users can monitor production efficiency, inventory levels, sales trends, and other aspects of process manufacturing operations. The ability to customize these dashboards ensures important information is readily available.
The software system supports a centralized authentication mechanism allowing the user to access multiple systems with a single, centrally managed password.
Category average: 8.3
Account using multiple ledgers, multiple currencies, and multiple entities
Category average: 7.8
The software can track multiple goods across multiple locations.
Category average: 7.7
Establish projected inventory levels, monitor actual levels and compare with projected levels
Category average: 7.3
Statistically forecast based on historical patterns and sales input, monitor accuracy and estimate new demand
Category average: 6.9
Users can create, customize and share dashboards, which provide an overview of the most important metrics.
Category average: 7.7
154 installations of 176
9 installations of 176
4 installations of 176


