SolarWinds SQL Sentry vs. SolarWinds Database Performance Monitor

Overview
ProductRatingMost Used ByProduct SummaryStarting Price
SolarWinds SQL Sentry
Score 9.0 out of 10
N/A
SolarWinds SQL Sentry is designed to help data professionals optimize SQL Server database performance in physical, virtual, and cloud environments. SQL Sentry delivers metrics to help users find and fix database performance problems and provides scalability, boasting demonstrated success monitoring 800+ SQL Server instances with one monitoring database. With SQL Sentry, the user can monitor: SQL Server Azure SQL Database SQL Server Analysis…
$0
Free
SolarWinds Database Performance Monitor
Score 9.2 out of 10
N/A
VividCortex, acquired by SolarWinds in December 2019, provides database performance monitoring designed to increase system performance, team efficiency, and infrastructure cost savings. The GDPR- and SOC 2-compliant platform offers visibility into major open-source databases—MySQL, PostgreSQL, Amazon Aurora, MongoDB, and Redis—for the engineering team at scale. Industry leaders like Etsy, GitHub, SendGrid, and Yelp rely on Database Performance Monitor for all-query monitoring and drill…N/A
Pricing
SolarWinds SQL SentrySolarWinds Database Performance Monitor
Editions & Modules
Plan Explorer (SQL Server Query Tuning)
$0
Free
SQL Sentry for Azure SQL Database
$161
Per year per database (annual subscription)
SQL Sentry
1,450
Per year per instance (annual subscription)
No answers on this topic
Offerings
Pricing Offerings
SolarWinds SQL SentrySolarWinds Database Performance Monitor
Free Trial
YesYes
Free/Freemium Version
NoNo
Premium Consulting/Integration Services
NoNo
Entry-level Setup FeeNo setup feeNo setup fee
Additional Details
More Pricing Information
Community Pulse
SolarWinds SQL SentrySolarWinds Database Performance Monitor
Features
SolarWinds SQL SentrySolarWinds Database Performance Monitor
SQL Performance Monitoring
Comparison of SQL Performance Monitoring features of Product A and Product B
SolarWinds SQL Sentry
8.4
Ratings
1% above category average
SolarWinds Database Performance Monitor
-
Ratings
Performance dashboard9.10 Ratings00 Ratings
Intelligent alerting7.90 Ratings00 Ratings
Top SQL8.60 Ratings00 Ratings
Historical trend data8.60 Ratings00 Ratings
Virtualization support8.70 Ratings00 Ratings
Best Alternatives
SolarWinds SQL SentrySolarWinds Database Performance Monitor
Small Businesses

No answers on this topic

No answers on this topic

Medium-sized Companies
LogicMonitor
LogicMonitor
Score 8.4 out of 10
LogicMonitor
LogicMonitor
Score 8.4 out of 10
Enterprises
LogicMonitor
LogicMonitor
Score 8.4 out of 10
LogicMonitor
LogicMonitor
Score 8.4 out of 10
All AlternativesView all alternativesView all alternatives
User Ratings
SolarWinds SQL SentrySolarWinds Database Performance Monitor
Likelihood to Recommend
8.6
(0 ratings)
8.0
(0 ratings)
Likelihood to Renew
8.8
(0 ratings)
-
(0 ratings)
Usability
9.0
(0 ratings)
-
(0 ratings)
Availability
7.1
(0 ratings)
-
(0 ratings)
Performance
7.1
(0 ratings)
-
(0 ratings)
Support Rating
7.5
(0 ratings)
-
(0 ratings)
In-Person Training
8.0
(0 ratings)
-
(0 ratings)
Implementation Rating
8.8
(0 ratings)
-
(0 ratings)
Configurability
7.9
(0 ratings)
-
(0 ratings)
Ease of integration
5.0
(0 ratings)
-
(0 ratings)
Product Scalability
7.0
(0 ratings)
-
(0 ratings)
Vendor post-sale
8.5
(0 ratings)
-
(0 ratings)
Vendor pre-sale
8.5
(0 ratings)
-
(0 ratings)
User Testimonials
SolarWinds SQL SentrySolarWinds Database Performance Monitor
Likelihood to Recommend
Of all the tools I've used, SolarWinds SQL Sentry's Top Query has been the single most helpful tool in helping me identify which queries are putting a load on our servers and at what times. This greatly simplifies my job in prioritizing tuning. Having Plan Explorer directly linked to the tool is icing on the cake.
Read full review
Computing resources consumed by the DB instance, DPA queries & wait time, deadlock conditions, virtual infrastructure resources. The addition of NPM & DPA integration as well as cross-correlation in the identification of issues with the network or server or DB is all stupid-proof. Monitoring is more than just health and resource consumption, it's also performance. DB performance analysis is key to maintaining healthy DB instances.
Read full review
Pros
  • Alerting is very flexible and configurable to our needs
  • Linking alerting into third party alerting tools via PowerShell was easy
  • Collecting and rolling up SQL statements make it much easier to troubleshoot performance problems
  • Drilling into PLE and what’s happening when it drops out
  • Ease of drilling into time-frame to figure out what was the issue at that time
  • Being able to query the SentryOne database for management reports is awesome (Deadlocks and Blocking)
Read full review
  • Simple to use and very easy to learn.
  • The execution engines run in parallel, can execute any syntax or query.
  • DPN can run all queries for both Oracle and SQL with no additional support.
Read full review
Cons
  • It would be nice if the reports can be interactive like drill down, clickable content, etc.
  • Navigation could improve and become more intuitive.
  • Calendar of events could also improve - wish the date and time range could be specified instead of just by day or interval.
Read full review
  • The Reporting feature currently doesn't allow customization.
Read full review
Likelihood to Renew
Absolutely. SQL Sentry is an absolute must have for any company with a SQL Server estate. It provides a force multiplier to effectively manage SQL Server, and the feature sets are second to none. The support and expertise at SentryOne is incredible. They are very supportive of both the platform users and helping your business with the product
Read full review
No answers on this topic
Usability
I don't know how we survived before without this tool, the added value that you get from it to do deep dive performance analysis, reactive problem solving and proactive monitoring and alerting is limitless. We have only scratched the surface of what we can do with this tool at my company. The support and ROI that SentryOne provide is exceptional and one of my favourite vendors to deal with.
Read full review
No answers on this topic
Reliability and Availability
The system is working perfectly in capturing data, but we do experience issues with SQL Timeout when viewing results in the remote clients. This may be due to the fact that our monitoring service is consuming most of the CPU, and it is the same server that is hosting the SQL Repository. We could probably fix the issue by separating the SQL instance from the monitoring service.
Read full review
No answers on this topic
Performance
In most cases the pages load very quickly. In our particular case, we need to do some movement of services to separate our monitoring service to separate infrastructure from the repository. When we first started with SQL Sentry on 5 licenses, we did not have any issues. Since we have now grown that to 25, we are experiencing some challenges. We do not believe this to be a tool problem
Read full review
No answers on this topic
Support Rating
The main platform is very well supported. Requests for help with customizing alerts and monitors have been rapidly and thoroughly responded to. Our use of the chain feature seems to be out of the ordinary and our defect reports there while understood and taken seriously, tend to be lower priority than defects in the main platform. They will work diligently to give us a workaround but correction in the standard release is a little slower in the chain feature.
Read full review
No answers on this topic
In-Person Training
sql sentry expert came onsight to review the performance of installation and gave us a good insight to using the tool
Read full review
No answers on this topic
Implementation Rating
Was suggested that we install the process monitors on a dev or qa database server, but we found it more useful to create an IT db server and put it there (along with a few other apps that we use for monitoring).
Read full review
No answers on this topic
Alternatives Considered
SQL Sentry has a LOT more information in it than the SolarWinds DPA product. Its reporting tool isn't as good either. The IDERA product isn't as reliable as SQL Sentry and its reporting isn't nearly as good. The IDERA UI is a resource hog and isn't as intuitive.
Read full review
DPM is less expensive and more feature-rich. Also, Oracle tech support is garbage, unless you can afford to spend a day getting assistance.
Read full review
Scalability
We are running 25 instances through a single monitoring service and it is able to keep up. We are finding that this many instances in our environment is about as many as can be handled. We will need to deploy additional monitoring services. Luckily, there is no additional licensing costs to deploy additional monitoring services. For us, it's just an additional Azure VM.
Read full review
No answers on this topic
Return on Investment
  • Better customer service as it alerts me automatically to loss of service issues so I can react and either get things fixed before it impacts the customers or to let my management know as soon as possible
  • It helps me find expensive SQL so our customers get better performance and we make better use of our resources
Read full review
  • What is the cost of a downed DB instance? That's your ROI. DPM lets you see issues before they become critical.
Read full review
ScreenShots

SolarWinds SQL Sentry Screenshots

Screenshot of SQL Sentry DeadlocksScreenshot of SQL Sentry Top SQL

SolarWinds Database Performance Monitor Screenshots

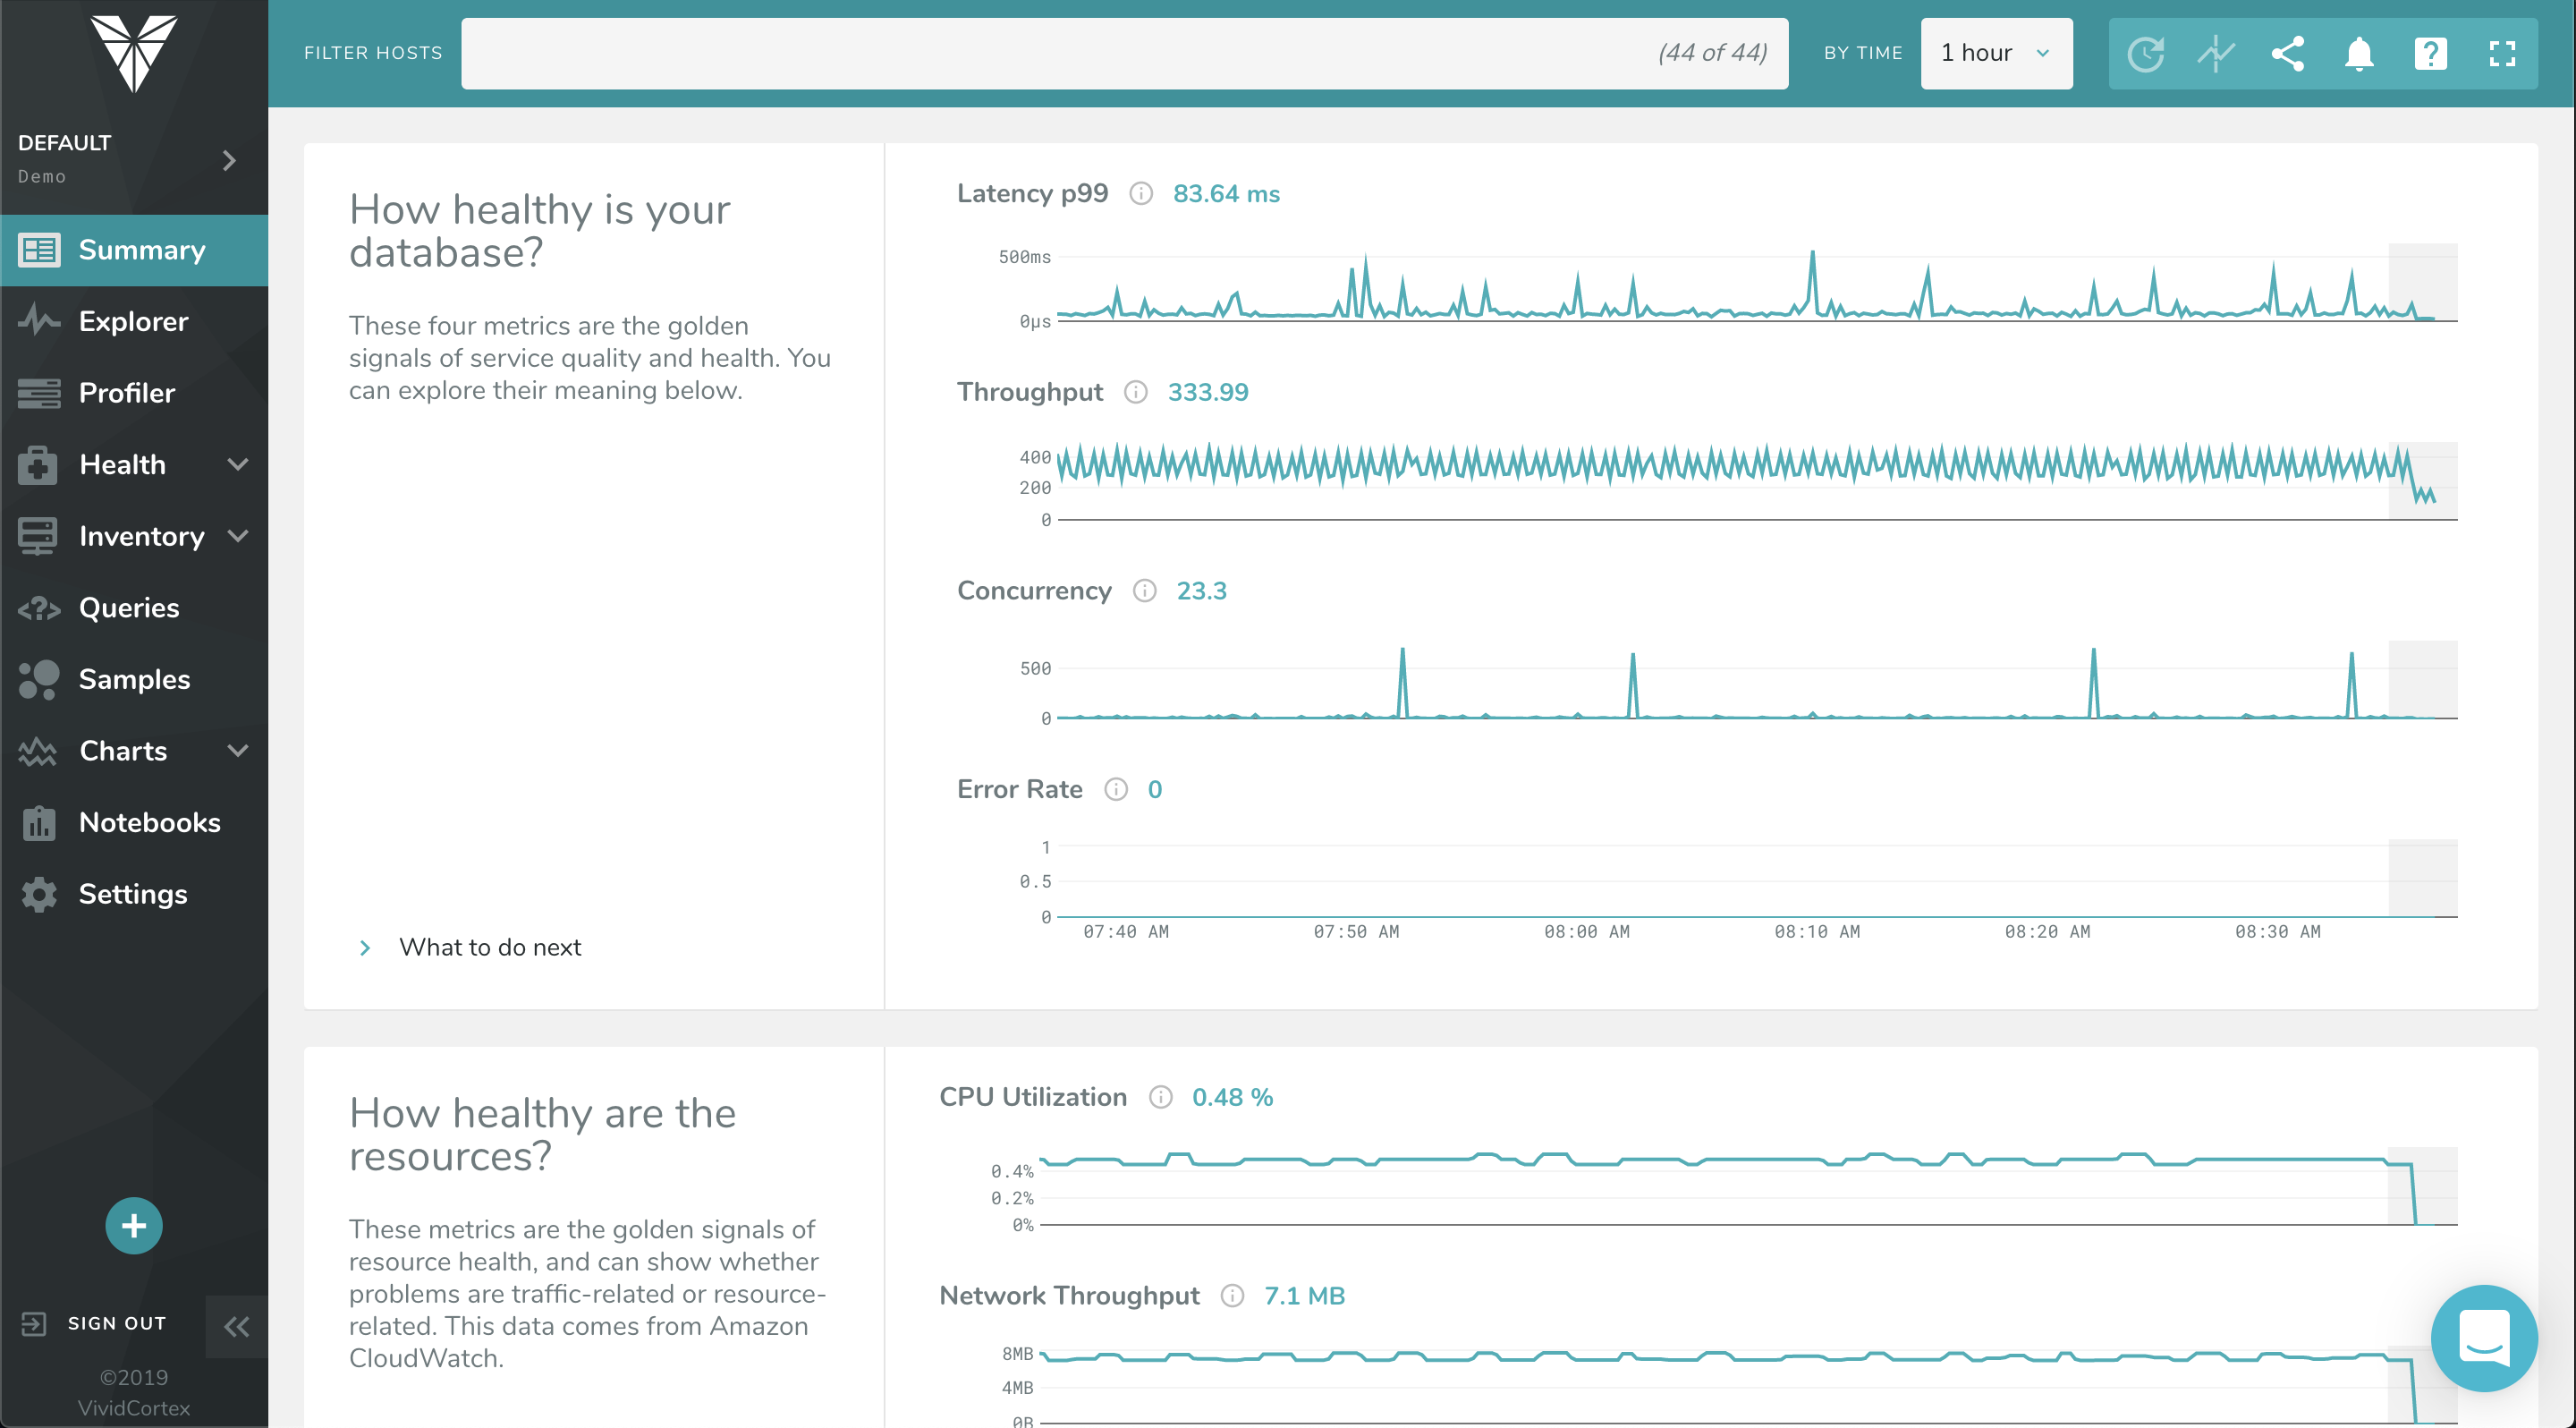
Screenshot of The Profiler Dashboard is a powerful, dynamic dashboard for ranking and filtering activity on your servers: It can instantly show you what needs attention and it provides a unified view of all your database types that VividCortex monitors. It enables you to view and understand your system by profiling it according to its most significant attributes—customized and selected by you.Screenshot of This dashboard displays a list of queries and allows you to filter them with powerful specificity. Filters can be set according to query text, host, and timeframe when the query was first seen / last active.Screenshot of VividCortex captures an enormous amount of data, and the Summary Dashboard helps users make sense of it, reducing their time-to-insight. It features widgets with automatic displays for Top 5 Queries by Total Time, Top 5 Queries by User CPU, Application Overview, Critical Events, and more.Screenshot of VividCortex monitors thousands of metrics in your system, and the Charts and Dashboard’s navigation pane allows you to toggle, customize, and enable various categories of generated charts. You can then easily navigate and examine the charts’ metrics with mouseover and zoom capabilities.