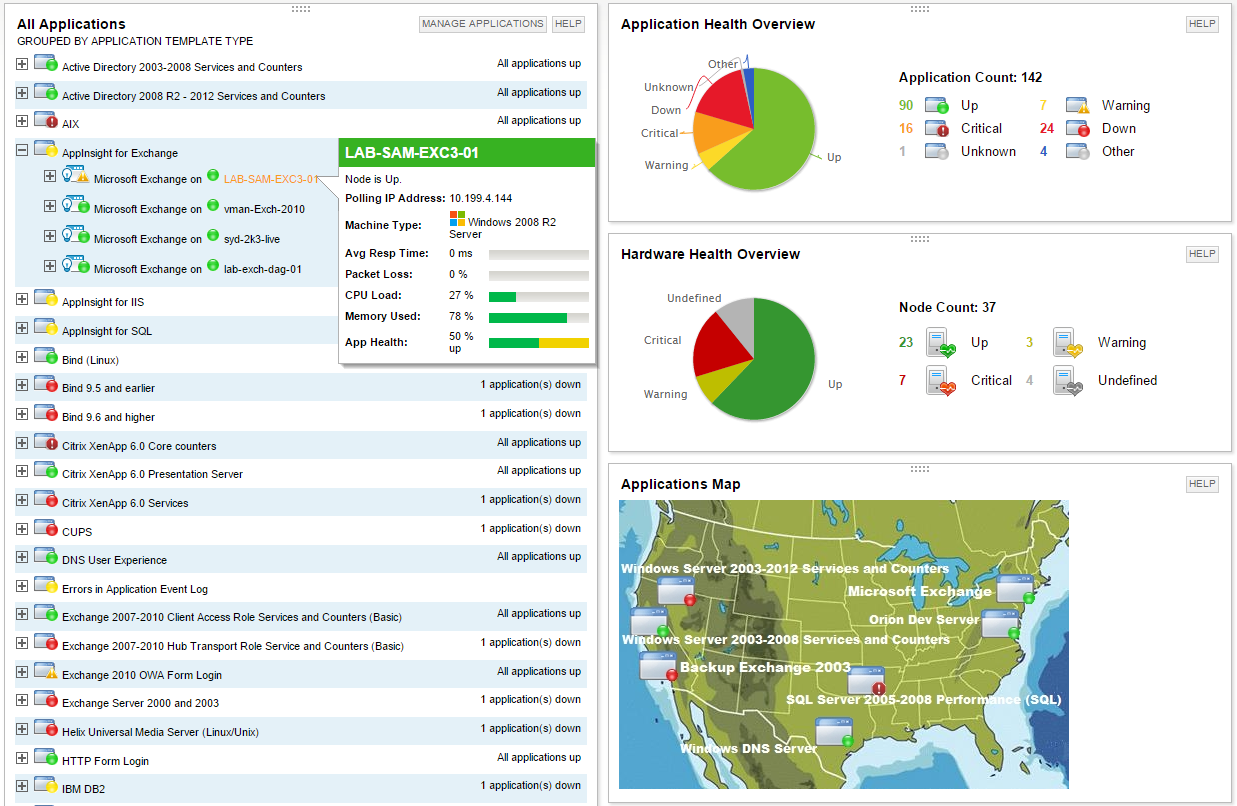
SolarWinds Server & Application Monitor (SAM) delivers application and server monitoring capabilities. SAM allows for self-service for easy setup, 1200+ monitoring templates, and customization options, as well as integrate with other SolarWinds products.
N/A
Splunk Observability Cloud
Score 9.0 out of 10
N/A
Splunk Observability Cloud aims to enable operational agility and better customer experience through real-time AI-driven streaming analytics allowing accurate alerts in seconds. It is designed to shorten MTTD and MTTR by providing real-time visibility into cloud infrastructure and services.
For monitoring applications that run on Windows hosts on VMware or HyperV virtualization, SolarWindows offers a nice, vertical view of both the loads and the resources. In such an environment, this makes life really good! But if you have something else -- for example, Linux hosts -- you're on your own to some extent. That is, the things it does well, it does very well -- but everything else is much less polished.
Its great if you need real-time visibility across complex or regulated environments. Also strong for hybrid or multi-cloud setups where uptime, observability and fast IR are required. It’s probably overkill for smaller teams or environments that don’t have constant changes or compliance reporting needs. It's expensive and has a steep learning curve. Also, in my opinion, do not get yourself into a consumption based model. Costs can certainly get out of control quickly.
The first one is its Kubernetes container monitoring.
I really like this features because as we know how much K8s is vast and to manually monitor each part of the Kubernetes it takes so much time but Splunk Observability Cloud makes it easier. And even once we integrate K8s with Splunk Observability Cloud it gives us some prebuilt dashboards which gives holistic view of our Cluster and its nodes, pods, etc.
The dashbaord feature of Splunk Observability Cloud, it gives us full flexibility to customize our dashboard with a wide range of predefined chart types.
Now it also supports OTEL, which is a plus point for observability. As now everyone is moving towards Otel and in current market there are only few tools who supports OTEL based integrations, Splunk Observability Cloud is one out of them.
Provides basic monitoring/visibility. Visibility into detailed/fine-grained issues best suited for more specialized/expensive solutions.
Licensing per monitored application rapidly uses up purchased license count.
More out-of-the-box templates or easier setup of monitoring less-common applications would make the solution more appealing given the target audience of the product.
You can use table-like functionality to generate dashboards, but these queries are heavy on the system.
It could be easier to give insight into what type of line parsing is used for specific documents in a company-managed environment and/or show ways to gain the insights needed.
I would like to see ways to anonymize specific data for shared reports without pre-formatting this in a dashboard on which reports could be based.
We are heavily invested in Solarwinds products for a reason. They are generally easy to setup and run with, requiring only some interfacing with support or help articles on rare occasions. They do what we bought them to do and we can't ask for more.
Good: Stable system with low error rate Easy to use for simple use cases Bad: UI is not very clear for complex usage Mobile view (when logged in from phone) is bad No library for .net
SolarWinds Server & Application Monitor is quite easy to use and super versatile. It allows you to do just about anything you can through premade templates or through scripting. You can use an agent on the servers if you want to, or you can monitor through WMI or SNMP credentials. You can customize thresholds for alerting quickly, and you can configure alerts to be as complex or as simple as you want.
When there is an issue, it’s a win if one can easily identify the root cause. To do the same, it should allow the user to dig deep with multiple data points and compare the data and identify the anomaly. In this use case, it’s good to drive from Splunk 011y.
The graphical interface and the performance of the database leave a little to be desired, they could be better explored.Some functionality and screens do not work well depending on the browser used. The integrations never had any problems or caused crashes in other systems.
I think there was only a couple times I had to open a support case for SAM and one time they got multiple engineers on the phone to get a better idea what I was trying to monitor and was able to point me in the best direction to monitor that system.
It has been a while since we first purchased SolarWinds, but I looked over several other products that I can't remember now. Many other products tried to scan the network to find computers but given that our computers are located in various places across campus with other computers in our buildings that are not ours that type of network scanning was not what we needed. Other services have extra services that we had no need of and I liked the ability to add custom fields in SolarWinds so we can track the information on each computer that we need to know.
Splunk Infrastructure Monitoring provides far superior options for anybody using a complex hybrid multi-cloud environment and allows both your SOC and NOC to work together on the same data while driving their own insights. We found other products are still in the old world view of servers and agents residing together within a single data centre, but modern apps are no longer like this.
Less time spent investigating causes of issues. We are alerted straight away and can find the root cause of the issue in less time.
We have been able to ditch all our previous individual monitoring solutions, none of which integrated with each other for a single solution which fully integrates with each of the different modules to provide a single portal for monitoring and alerting.