SolarWinds Database Performance Analyzer vs. SolarWinds Database Performance Monitor

Overview
ProductRatingMost Used ByProduct SummaryStarting Price
SolarWinds Database Performance Analyzer
Score 5.6 out of 10
N/A
SolarWinds Database Performance Analyzer (DPA) enables deep visibility into database performance and expert advice for performance optimization and tuning. What can you monitor with DPA? Oracle Oracle Exadata Oracle EBS Microsoft SQL Server Azure SQL Database Azure SQL Database Managed Instance MySQL DB2 SAP ASE Aurora MariaDB DPA monitors physical, virtual,…N/A
SolarWinds Database Performance Monitor
Score 9.2 out of 10
N/A
VividCortex, acquired by SolarWinds in December 2019, provides database performance monitoring designed to increase system performance, team efficiency, and infrastructure cost savings. The GDPR- and SOC 2-compliant platform offers visibility into major open-source databases—MySQL, PostgreSQL, Amazon Aurora, MongoDB, and Redis—for the engineering team at scale. Industry leaders like Etsy, GitHub, SendGrid, and Yelp rely on Database Performance Monitor for all-query monitoring and drill…N/A
Pricing
SolarWinds Database Performance AnalyzerSolarWinds Database Performance Monitor
Editions & Modules
No answers on this topic
Offerings
Pricing Offerings
SolarWinds Database Performance AnalyzerSolarWinds Database Performance Monitor
Free Trial
YesYes
Free/Freemium Version
NoNo
Premium Consulting/Integration Services
NoNo
Entry-level Setup FeeOptionalNo setup fee
Additional Details
More Pricing Information
Community Pulse
SolarWinds Database Performance AnalyzerSolarWinds Database Performance Monitor
User Ratings
SolarWinds Database Performance AnalyzerSolarWinds Database Performance Monitor
Likelihood to Recommend
8.9
(0 ratings)
8.0
(0 ratings)
Likelihood to Renew
8.6
(0 ratings)
-
(0 ratings)
Usability
9.0
(0 ratings)
-
(0 ratings)
Availability
9.1
(0 ratings)
-
(0 ratings)
Performance
9.1
(0 ratings)
-
(0 ratings)
Support Rating
9.3
(0 ratings)
-
(0 ratings)
Implementation Rating
7.3
(0 ratings)
-
(0 ratings)
Configurability
7.3
(0 ratings)
-
(0 ratings)
Ease of integration
8.2
(0 ratings)
-
(0 ratings)
Product Scalability
8.2
(0 ratings)
-
(0 ratings)
Vendor post-sale
9.1
(0 ratings)
-
(0 ratings)
Vendor pre-sale
9.1
(0 ratings)
-
(0 ratings)
User Testimonials
SolarWinds Database Performance AnalyzerSolarWinds Database Performance Monitor
Likelihood to Recommend
I believe that SolarWinds Database Performance Analyzer is a great choice for an organization that does not have a specific DBA or one that is still growing into the role. SolarWinds Database Performance Analyzer is filled with hints, tips, and explanations of the various readings and metrics. This is very useful to help understand what is happening and why, what it means, and what some potential solutions are towards remediating any issues. This is extremely valuable for our development team, allowing them to be more proactive with the queries they write in viewing how they perform and where bottlenecks might be.
Read full review
Computing resources consumed by the DB instance, DPA queries & wait time, deadlock conditions, virtual infrastructure resources. The addition of NPM & DPA integration as well as cross-correlation in the identification of issues with the network or server or DB is all stupid-proof. Monitoring is more than just health and resource consumption, it's also performance. DB performance analysis is key to maintaining healthy DB instances.
Read full review
Pros
  • Ability to drill down to wait for the issue and have a clear path as to what may be causing the issue.
  • Ability to quickly add a new target and the ease of installation and upgrades.
  • Reporting features to group my most troublesome customers into a daily report in one email.
  • Excellent customer support on any issues I can't immediately solve.
Read full review
  • Simple to use and very easy to learn.
  • The execution engines run in parallel, can execute any syntax or query.
  • DPN can run all queries for both Oracle and SQL with no additional support.
Read full review
Cons
  • Resiliency of the Monitoring checks after the server underwent maintenance reboot. My experience is the monitor (Action) needs to be started manually. If possible it can automatically detect service/server then start to monitor again when system is back up.
  • Much lighter UI.
  • Granularity up to minutes.
Read full review
  • The Reporting feature currently doesn't allow customization.
Read full review
Likelihood to Renew
We have relied on this product for a very long time and it continues to exceed expectations. The product is a vital part of our organization at this point, it would not be very ideal for us to abandon it. We use it almost every day and depend on its alerts for critical parts of our business
Read full review
No answers on this topic
Usability
I don't want to think about managing clusters of SQL servers in the future without this tool. We have demoed other tools and SolarWinds Database Performance Analyzer is the gold standard for usability and insight into what your servers are doing. The UI is a bit dated, but everything is laid out in a logical manner and drilling down into queries or timeslices is extremely intuitive.
Read full review
No answers on this topic
Support Rating
I have had to use their support on a few occasions, for reasons that I am not clear about until recently I have always had problems upgrading the software (although the last 2 updates have gone without issue which I am very pleased to say). On those unfortunate occasions, the support has been brilliant with either excellently documented guides on how to resolve the issue by myself or have been hands-on with calls and screen sharing to remotely fix the issue. Every time the problem was sorted and more importantly, nothing was lost (apart from a bit of time). And as I stated above whatever the problem was that was causing my upgrade issues appears to have been resolved in the last 2 updates.
Read full review
No answers on this topic
Implementation Rating
Follow the guidelines for the capacity of the servers. We found that the DPA databases were getting rather large and also that there are ways to reduce their size built into some of the options.
Read full review
No answers on this topic
Alternatives Considered
I have used Spotlight (for Oracle on RAC) but it has been several years. The dashboard was crisp, clean, and intuitive, but the tool had a significant overhead. However, no competitor made a tool that met our needs at the time. I have also used Idera's SQL Diagnostic Manager in more than one company. That tool is helpful for a larger environment than we currently have. But I think it is better at alerting than DPA but worse at just about everything else. The good thing is you can flag an alert as acknowledged, so you stop getting emails. The bad thing is I don't think I could use it to troubleshoot issues like I do with DPA. I do not have enough experience to provide helpful feedback on the others selected.
Read full review
DPM is less expensive and more feature-rich. Also, Oracle tech support is garbage, unless you can afford to spend a day getting assistance.
Read full review
Return on Investment
  • Paid for itself in days. We had a stored procedure that could not meet its SLA, DPA highlighted the issue and contributed to the resolution.
  • We had a stored procedure that we were able to calculate as running in 9 milliseconds, unfortunately, we had transactions coming in 7 milliseconds, resulting in duplicate transactions, indicating that a mutex function was needed.
Read full review
  • What is the cost of a downed DB instance? That's your ROI. DPM lets you see issues before they become critical.
Read full review
ScreenShots

SolarWinds Database Performance Analyzer Screenshots

Screenshot of DashboardScreenshot of Alerts and reportsScreenshot of Application-centric view of DPAScreenshot of Blocking deadlock analysisScreenshot of Collaboration across teamsScreenshot of Intuitive performance monitoring

SolarWinds Database Performance Monitor Screenshots
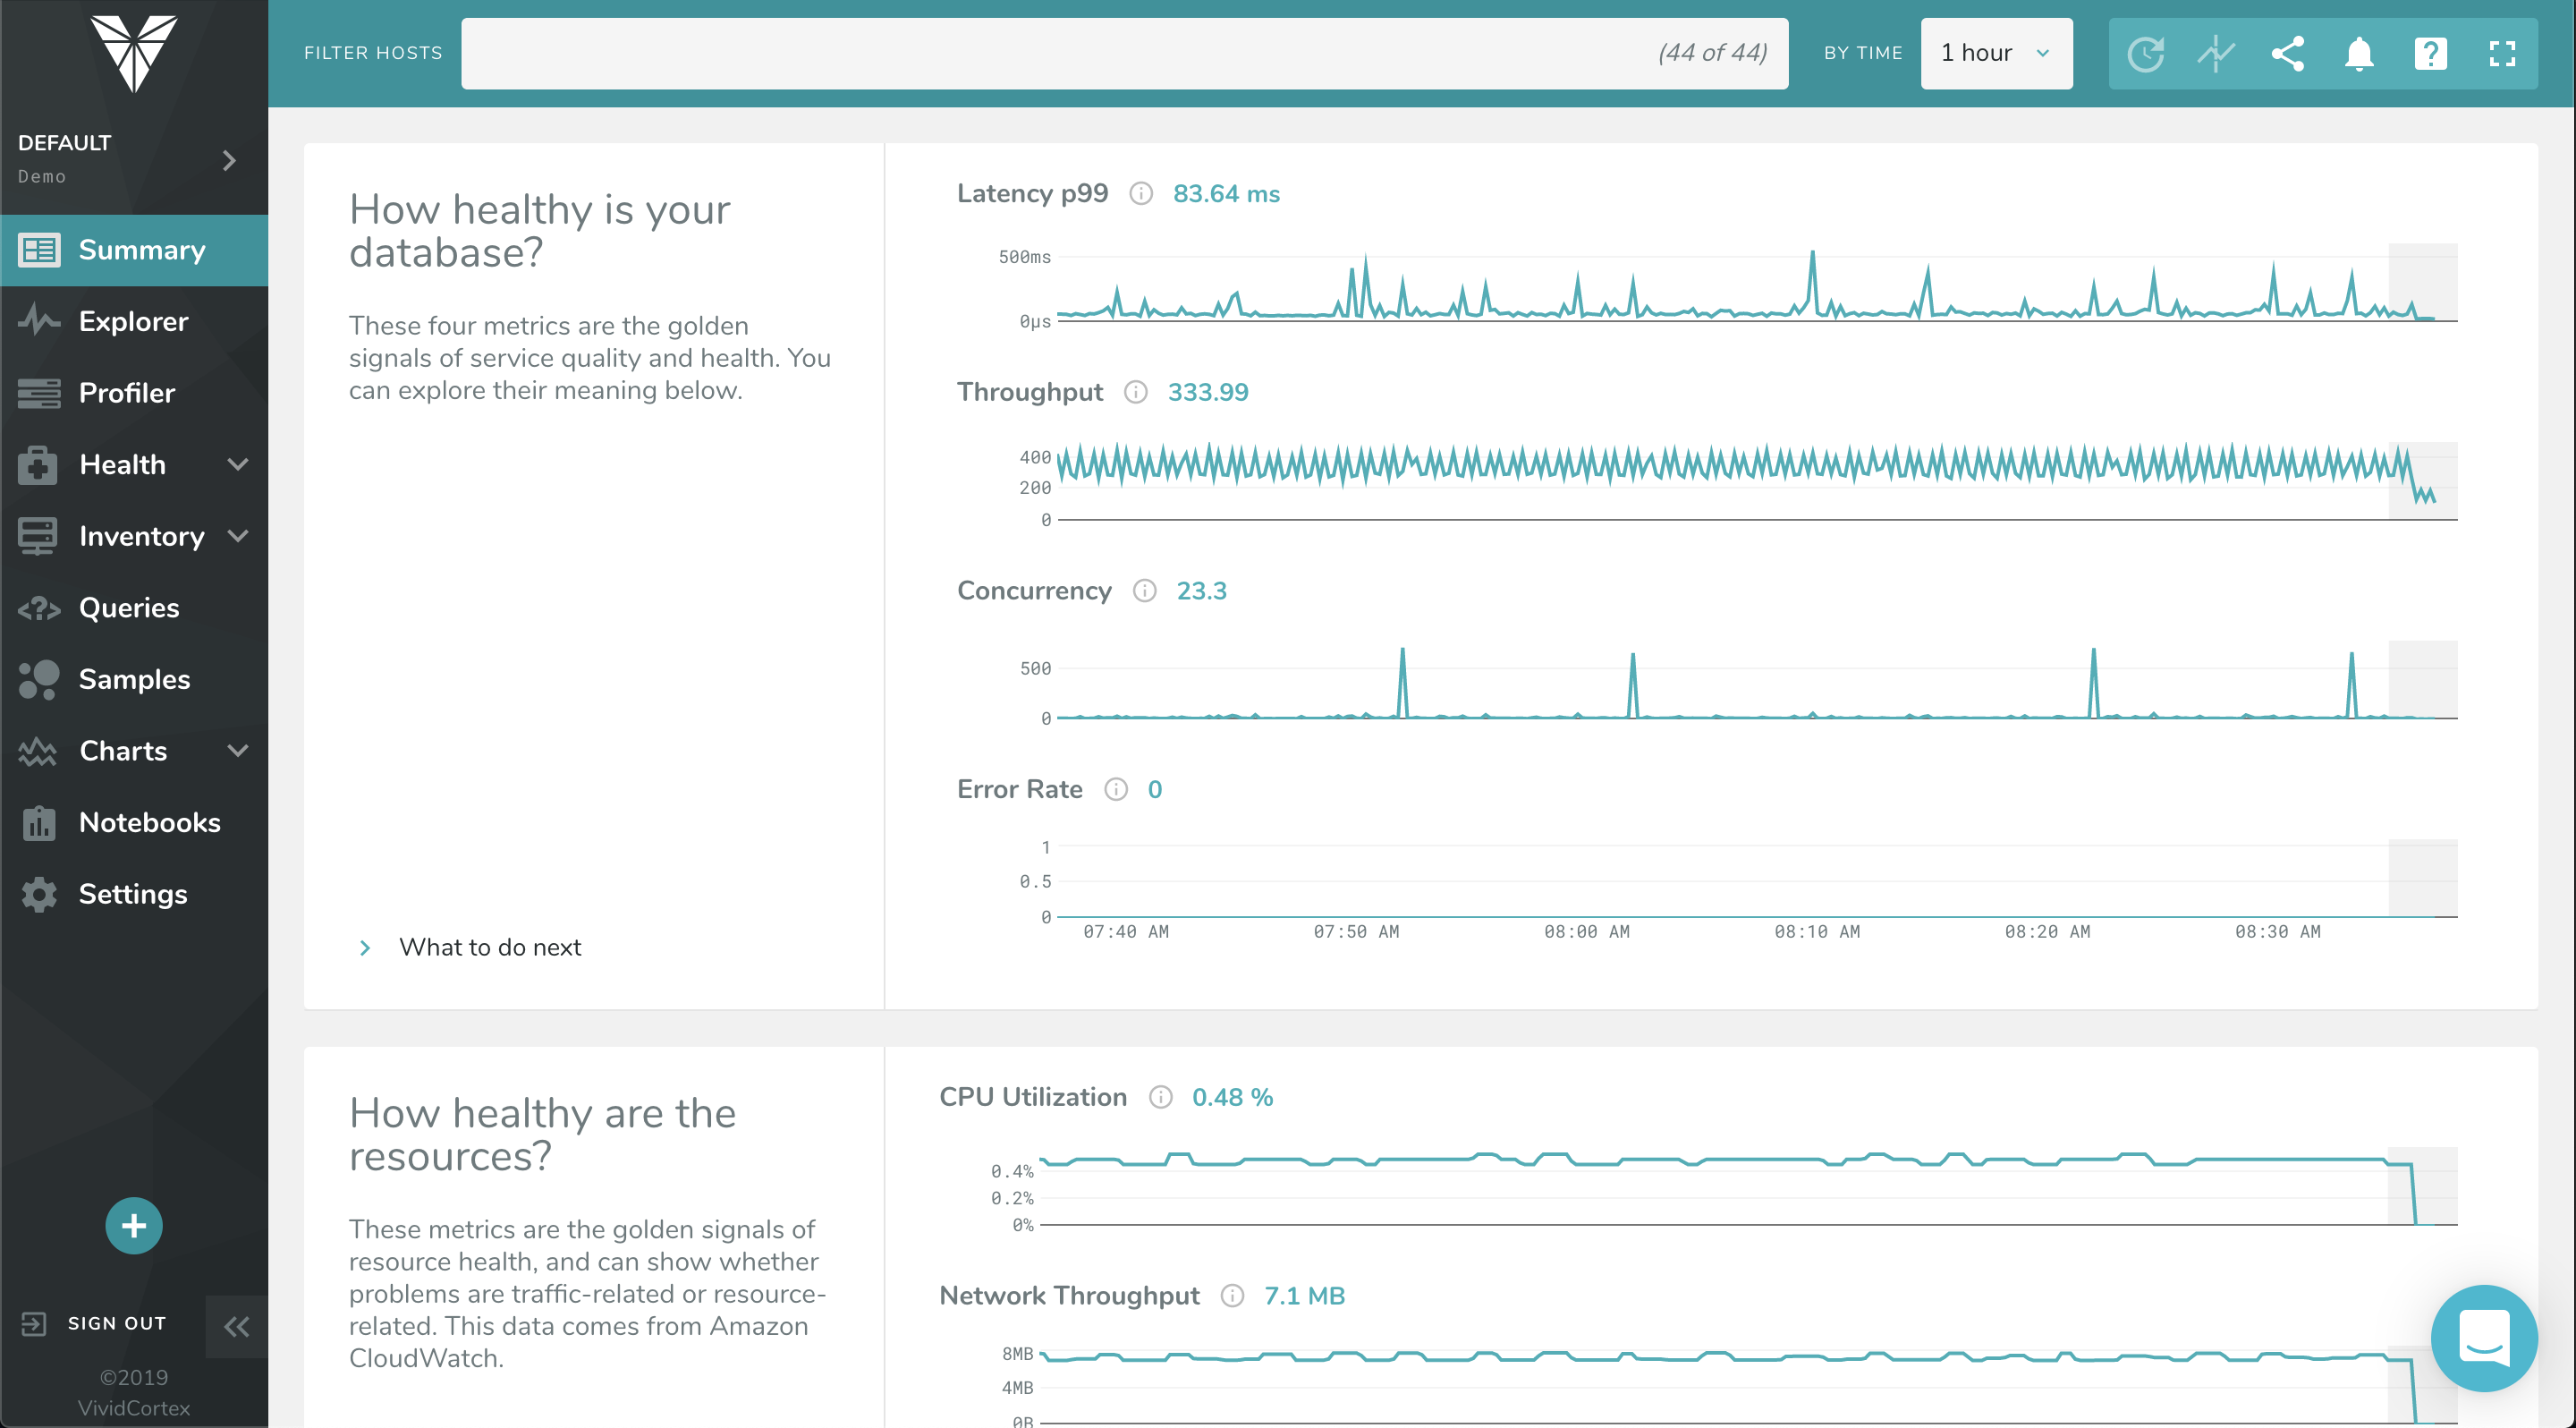
Screenshot of The Profiler Dashboard is a powerful, dynamic dashboard for ranking and filtering activity on your servers: It can instantly show you what needs attention and it provides a unified view of all your database types that VividCortex monitors. It enables you to view and understand your system by profiling it according to its most significant attributes—customized and selected by you.Screenshot of This dashboard displays a list of queries and allows you to filter them with powerful specificity. Filters can be set according to query text, host, and timeframe when the query was first seen / last active.Screenshot of VividCortex captures an enormous amount of data, and the Summary Dashboard helps users make sense of it, reducing their time-to-insight. It features widgets with automatic displays for Top 5 Queries by Total Time, Top 5 Queries by User CPU, Application Overview, Critical Events, and more.Screenshot of VividCortex monitors thousands of metrics in your system, and the Charts and Dashboard’s navigation pane allows you to toggle, customize, and enable various categories of generated charts. You can then easily navigate and examine the charts’ metrics with mouseover and zoom capabilities.