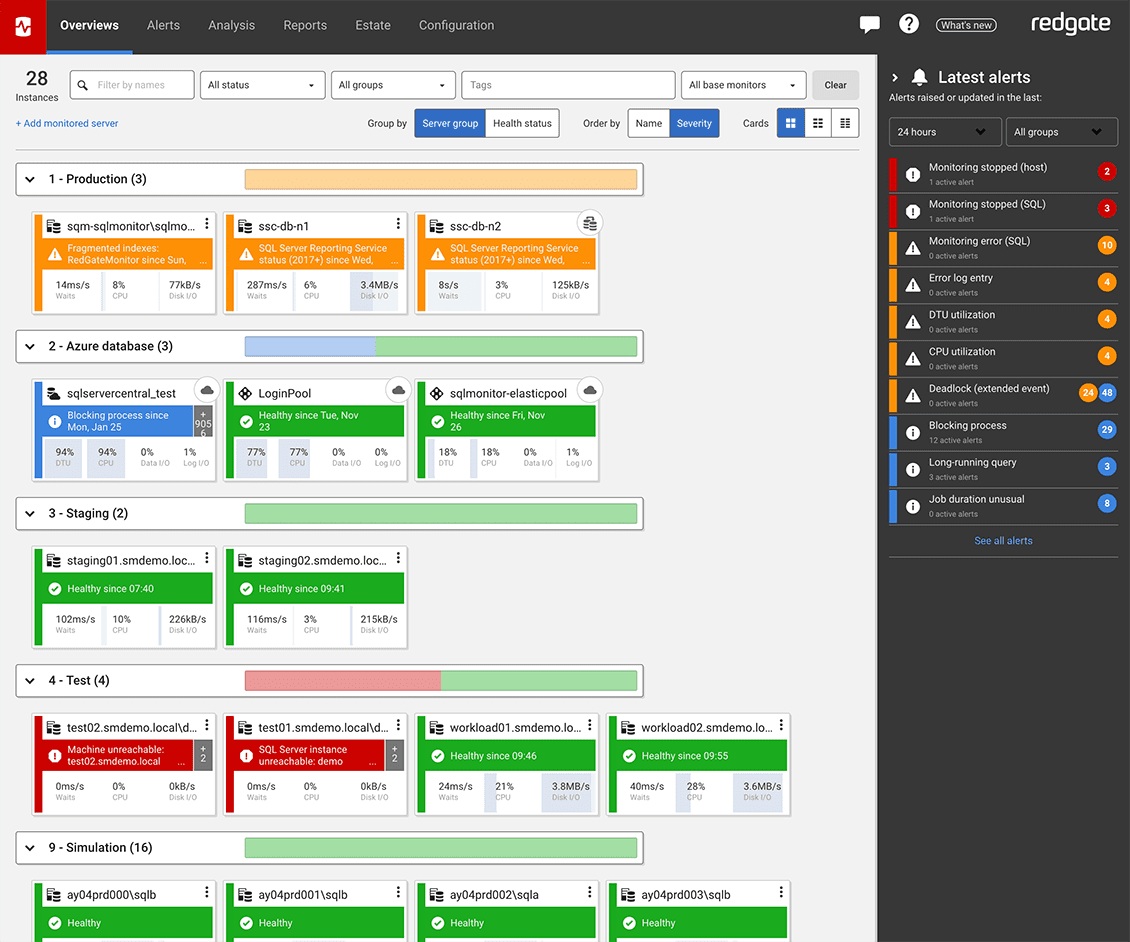
Redgate’s SQL Monitor helps teams looking after SQL servers be more proactive. SQL Monitor enables monitoring environments custom to the user’s SQL server to recognize issues before they impact users. It supports monitoring on-premises and cloud-based servers from a single interface.
$1,164
per year per server
Splunk Observability Cloud
Score 9.0 out of 10
N/A
Splunk Observability Cloud aims to enable operational agility and better customer experience through real-time AI-driven streaming analytics allowing accurate alerts in seconds. It is designed to shorten MTTD and MTTR by providing real-time visibility into cloud infrastructure and services.
$180
per year per host
Pricing
Redgate Monitor
Splunk Observability Cloud
Editions & Modules
No answers on this topic
Infrastructure
$15
per month (billed annually) per host
App & Infra
$60
per month (billed annually) per host
End-to-End
$75
per month (billed annually) per host
Offerings
Pricing Offerings
Redgate Monitor
Splunk Observability Cloud
Free Trial
Yes
Yes
Free/Freemium Version
No
No
Premium Consulting/Integration Services
Yes
No
Entry-level Setup Fee
Optional
No setup fee
Additional Details
All prices are per server and include one year’s support and upgrades.
Redgate SQL Monitor is well suited for database administrators or companies who implement software that relies on SQL servers. It will help them test new changes and ensure this will not impact the performance of their software. It is a last resort for MSPs to use to get to the bottom of an ongoing performance issue with their SQL server.
Its great if you need real-time visibility across complex or regulated environments. Also strong for hybrid or multi-cloud setups where uptime, observability and fast IR are required. It’s probably overkill for smaller teams or environments that don’t have constant changes or compliance reporting needs. It's expensive and has a steep learning curve. Also, in my opinion, do not get yourself into a consumption based model. Costs can certainly get out of control quickly.
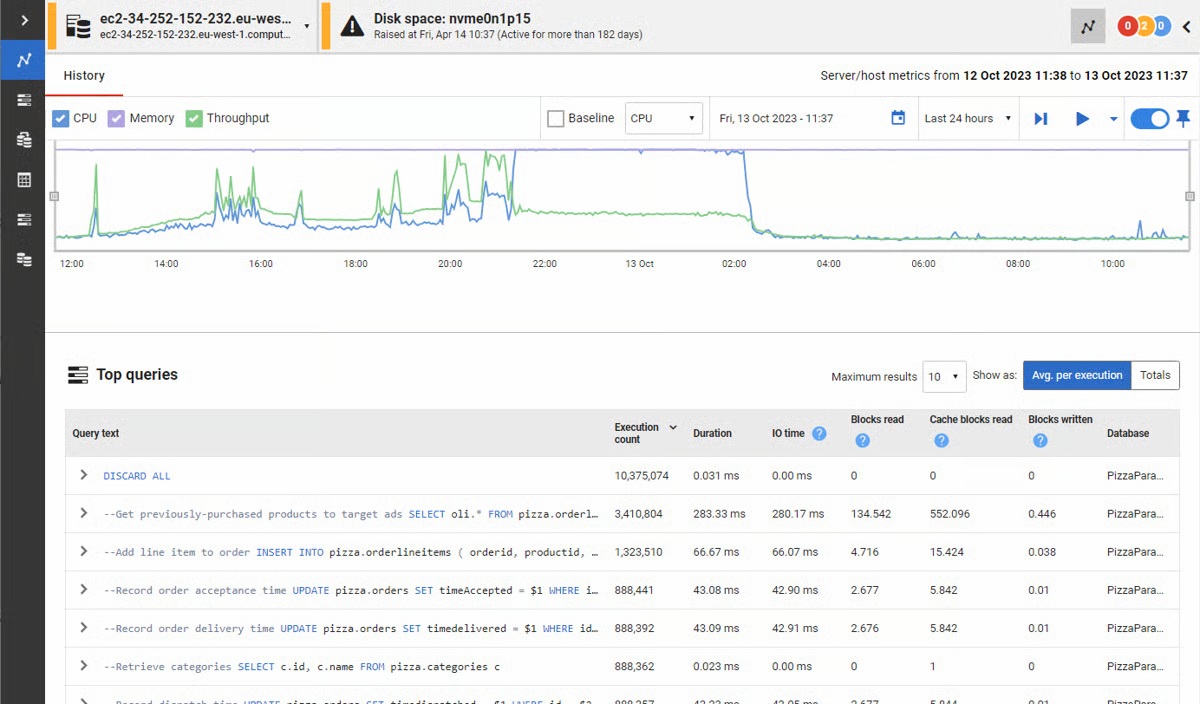
You can quickly see how your server is performing and which queries are taking the longest
I gives you the feeling that you are in control of your database, that you know what is going on for when they users ring up and tell you that the server is slow
The first one is its Kubernetes container monitoring.
I really like this features because as we know how much K8s is vast and to manually monitor each part of the Kubernetes it takes so much time but Splunk Observability Cloud makes it easier. And even once we integrate K8s with Splunk Observability Cloud it gives us some prebuilt dashboards which gives holistic view of our Cluster and its nodes, pods, etc.
The dashbaord feature of Splunk Observability Cloud, it gives us full flexibility to customize our dashboard with a wide range of predefined chart types.
Now it also supports OTEL, which is a plus point for observability. As now everyone is moving towards Otel and in current market there are only few tools who supports OTEL based integrations, Splunk Observability Cloud is one out of them.
You can use table-like functionality to generate dashboards, but these queries are heavy on the system.
It could be easier to give insight into what type of line parsing is used for specific documents in a company-managed environment and/or show ways to gain the insights needed.
I would like to see ways to anonymize specific data for shared reports without pre-formatting this in a dashboard on which reports could be based.
Good: Stable system with low error rate Easy to use for simple use cases Bad: UI is not very clear for complex usage Mobile view (when logged in from phone) is bad No library for .net
When there is an issue, it’s a win if one can easily identify the root cause. To do the same, it should allow the user to dig deep with multiple data points and compare the data and identify the anomaly. In this use case, it’s good to drive from Splunk 011y.
Redgate SQL Monitor is a lot cheaper than SolarWinds Database Performance Analyzer. I prefer the SolarWinds' design and that it offers integration with other SolarWinds products we already use. SolarWinds supports more than SQL servers (Oracle, MySQL, Maria DB, IBM DB2) and the analysis seems to be much better. The Spiceworks SQL Server monitoring is a free tool and is ideal for monitoring small business SQL instances.
Splunk Infrastructure Monitoring provides far superior options for anybody using a complex hybrid multi-cloud environment and allows both your SOC and NOC to work together on the same data while driving their own insights. We found other products are still in the old world view of servers and agents residing together within a single data centre, but modern apps are no longer like this.