TrustRadius: an HG Insights company

pganalyze vs. SolarWinds Database Performance Monitor

Save this comparison

Save this comparison

Add Product

Recommended Comparisons

    Overview
    ProductRatingMost Used ByProduct SummaryStarting Price

    pganalyze

    Score9 out of 10
    Small Businesses (1-50 employees)
    Founded in 2012, pganalyze provides actionable insights into Postgres. Specializing in PostgreSQL database monitoring and optimization, pganalyze gives automatic insights into Postgres query plans, helps improve Postgres query performance with its Index Advisor and VACUUM Advisor, and lets the user perform query drill-down analysis, observe per-query statistics and conduct trend analysis in a platform that integrates with both self-managed Postgres servers as…

    $149

    per month per database server

    SolarWinds Database Performance Monitor

    Score9.2 out of 10
    N/AVividCortex, acquired by SolarWinds in December 2019, provides database performance monitoring designed to increase system performance, team efficiency, and infrastructure cost savings. The GDPR- and SOC 2-compliant platform offers visibility into major open-source databases—MySQL, PostgreSQL, Amazon Aurora, MongoDB, and Redis—for the engineering team at scale. Industry leaders like Etsy, GitHub, SendGrid, and Yelp rely on Database Performance Monitor for all-query monitoring and drill…N/A
    Pricing
    pganalyzeSolarWinds Database Performance Monitor
    Editions & Modules
    Production
    $149
    per month for 1 database server
    Scale
    $399
    per month for up to 4 database servers ($100/mo for each additional billable server)
    Enterprise Cloud
    Contact us
    per year per database server
    Enterprise Server
    Contact us
    per year per database server
    No answers on this topic
    Offerings
    Pricing Offerings
    pganalyzeSolarWinds Database Performance Monitor
    Free Trial
    YesYes
    Free/Freemium Version
    NoNo
    Premium Consulting/Integration Services
    NoYes
    Entry-level Setup FeeNo setup feeNo setup fee
    Additional DetailsScale plan offers additional database servers at a cost of $100/month for each additional billable server. In general, each 1 Postgres server that is running (i.e. one parent postgres process) is considered 1 billable server. In the case of cloud providers these are often called "instances". Depending on the subscription plan you are on, you may have a special price for replica servers (also called "readers", or "followers"), which is implemented by multiplying the replica count with a multiplier (e.g. 0.5), with the total rounded up. Annual plans are available and come at a discount compared to the monthly plans Contact us for custom requirements
    More Pricing Information
    Best Alternatives
    pganalyzeSolarWinds Database Performance Monitor
    Small Businesses
    No answers on this topic
    No answers on this topic
    Medium-sized Companies
    SolarWinds Database Performance Analyzer
    Score5.5 out of 10
    SolarWinds Database Performance Analyzer
    Score5.5 out of 10
    Enterprises
    Foglight
    Score10 out of 10
    Foglight
    Score10 out of 10
    All AlternativesView all alternativesView all alternatives
    User Ratings
    pganalyzeSolarWinds Database Performance Monitor
    Likelihood to Recommend
    9.0
    (1 ratings)
    8.0
    (1 ratings)
    User Testimonials
    pganalyzeSolarWinds Database Performance Monitor
    Likelihood to Recommend
    pganalyze
    pganalyze works great with the postgresql and gives a good alternatives to the existing producsts available out there like Slick or basic as microsoft SQL server manaagement studio. We have used in our projects of data migration and integration of enterprise data warehouseing and reporting . And it has provides us satisfactory results.
    Incentivized
    Read full review
    SolarWinds
    Computing resources consumed by the DB instance, DPA queries & wait time, deadlock conditions, virtual infrastructure resources. The addition of NPM & DPA integration as well as cross-correlation in the identification of issues with the network or server or DB is all stupid-proof. Monitoring is more than just health and resource consumption, it's also performance. DB performance analysis is key to maintaining healthy DB instances.
    Incentivized
    Read full review
    Pros
    pganalyze
    • User and role setup
    • Performance tuning
    • Tracking of queries
    Incentivized
    Read full review
    SolarWinds
    • Simple to use and very easy to learn.
    • The execution engines run in parallel, can execute any syntax or query.
    • DPN can run all queries for both Oracle and SQL with no additional support.
    Incentivized
    Read full review
    Cons
    pganalyze
    • Visualization
    • Database insights
    Incentivized
    Read full review
    SolarWinds
    • The Reporting feature currently doesn't allow customization.
    Incentivized
    Read full review
    Alternatives Considered
    pganalyze
    It is better in terms of results provided. We were using Microsoft SQL Server Management Studio so far and relying only on that but some one recommend to us to use pganalyze to do the query analysis and we started using it for one project and we liked it much that we have started recomended to all projects teams ..
    Incentivized
    Read full review
    SolarWinds
    DPM is less expensive and more feature-rich. Also, Oracle tech support is garbage, unless you can afford to spend a day getting assistance.
    Incentivized
    Read full review
    Return on Investment
    pganalyze
    • Efficient product
    • Good value for money
    • You dont have to depend on external services
    Incentivized
    Read full review
    SolarWinds
    • What is the cost of a downed DB instance? That's your ROI. DPM lets you see issues before they become critical.
    Incentivized
    Read full review
    ScreenShots

    pganalyze Screenshots

    Screenshot of Query Performance Overview: pganalyze provides access to historic query data and provides tools to help with optimizing and performance tuning of Postgres databases, including trend analysis, and config tuning recommendations.Screenshot of Query Details Page: Displays detailed statistics on a per-query basis so users can learn what to focus on. pganalyze can also be used to perform query drill-down analysis and observe per-query statistics.Screenshot of pganalyze Index Advisor: pganalyze automatically validates that existing indexes are useful, gives index recommendations to improve performance, and helps reduce load on the database.Screenshot of pganalyze EXPLAIN Insights: pganalyze automatically collects EXPLAIN plans with auto_explain, provides visualizations and gives meaningful insights into Postgres Queries.Screenshot of pganalyze Log Insights: PostgreSQL logs often contain critical details about whats going on in an associated database. pganalyze Log Insights automatically extracts the logs into structured data, and filters any sensitive information.Screenshot of pganalyze VACUUM Advisor: pganalyze helps optimize table bloat, freezing and VACUUM performance - ensuring ideal performance, stability, and efficiency for  databases.

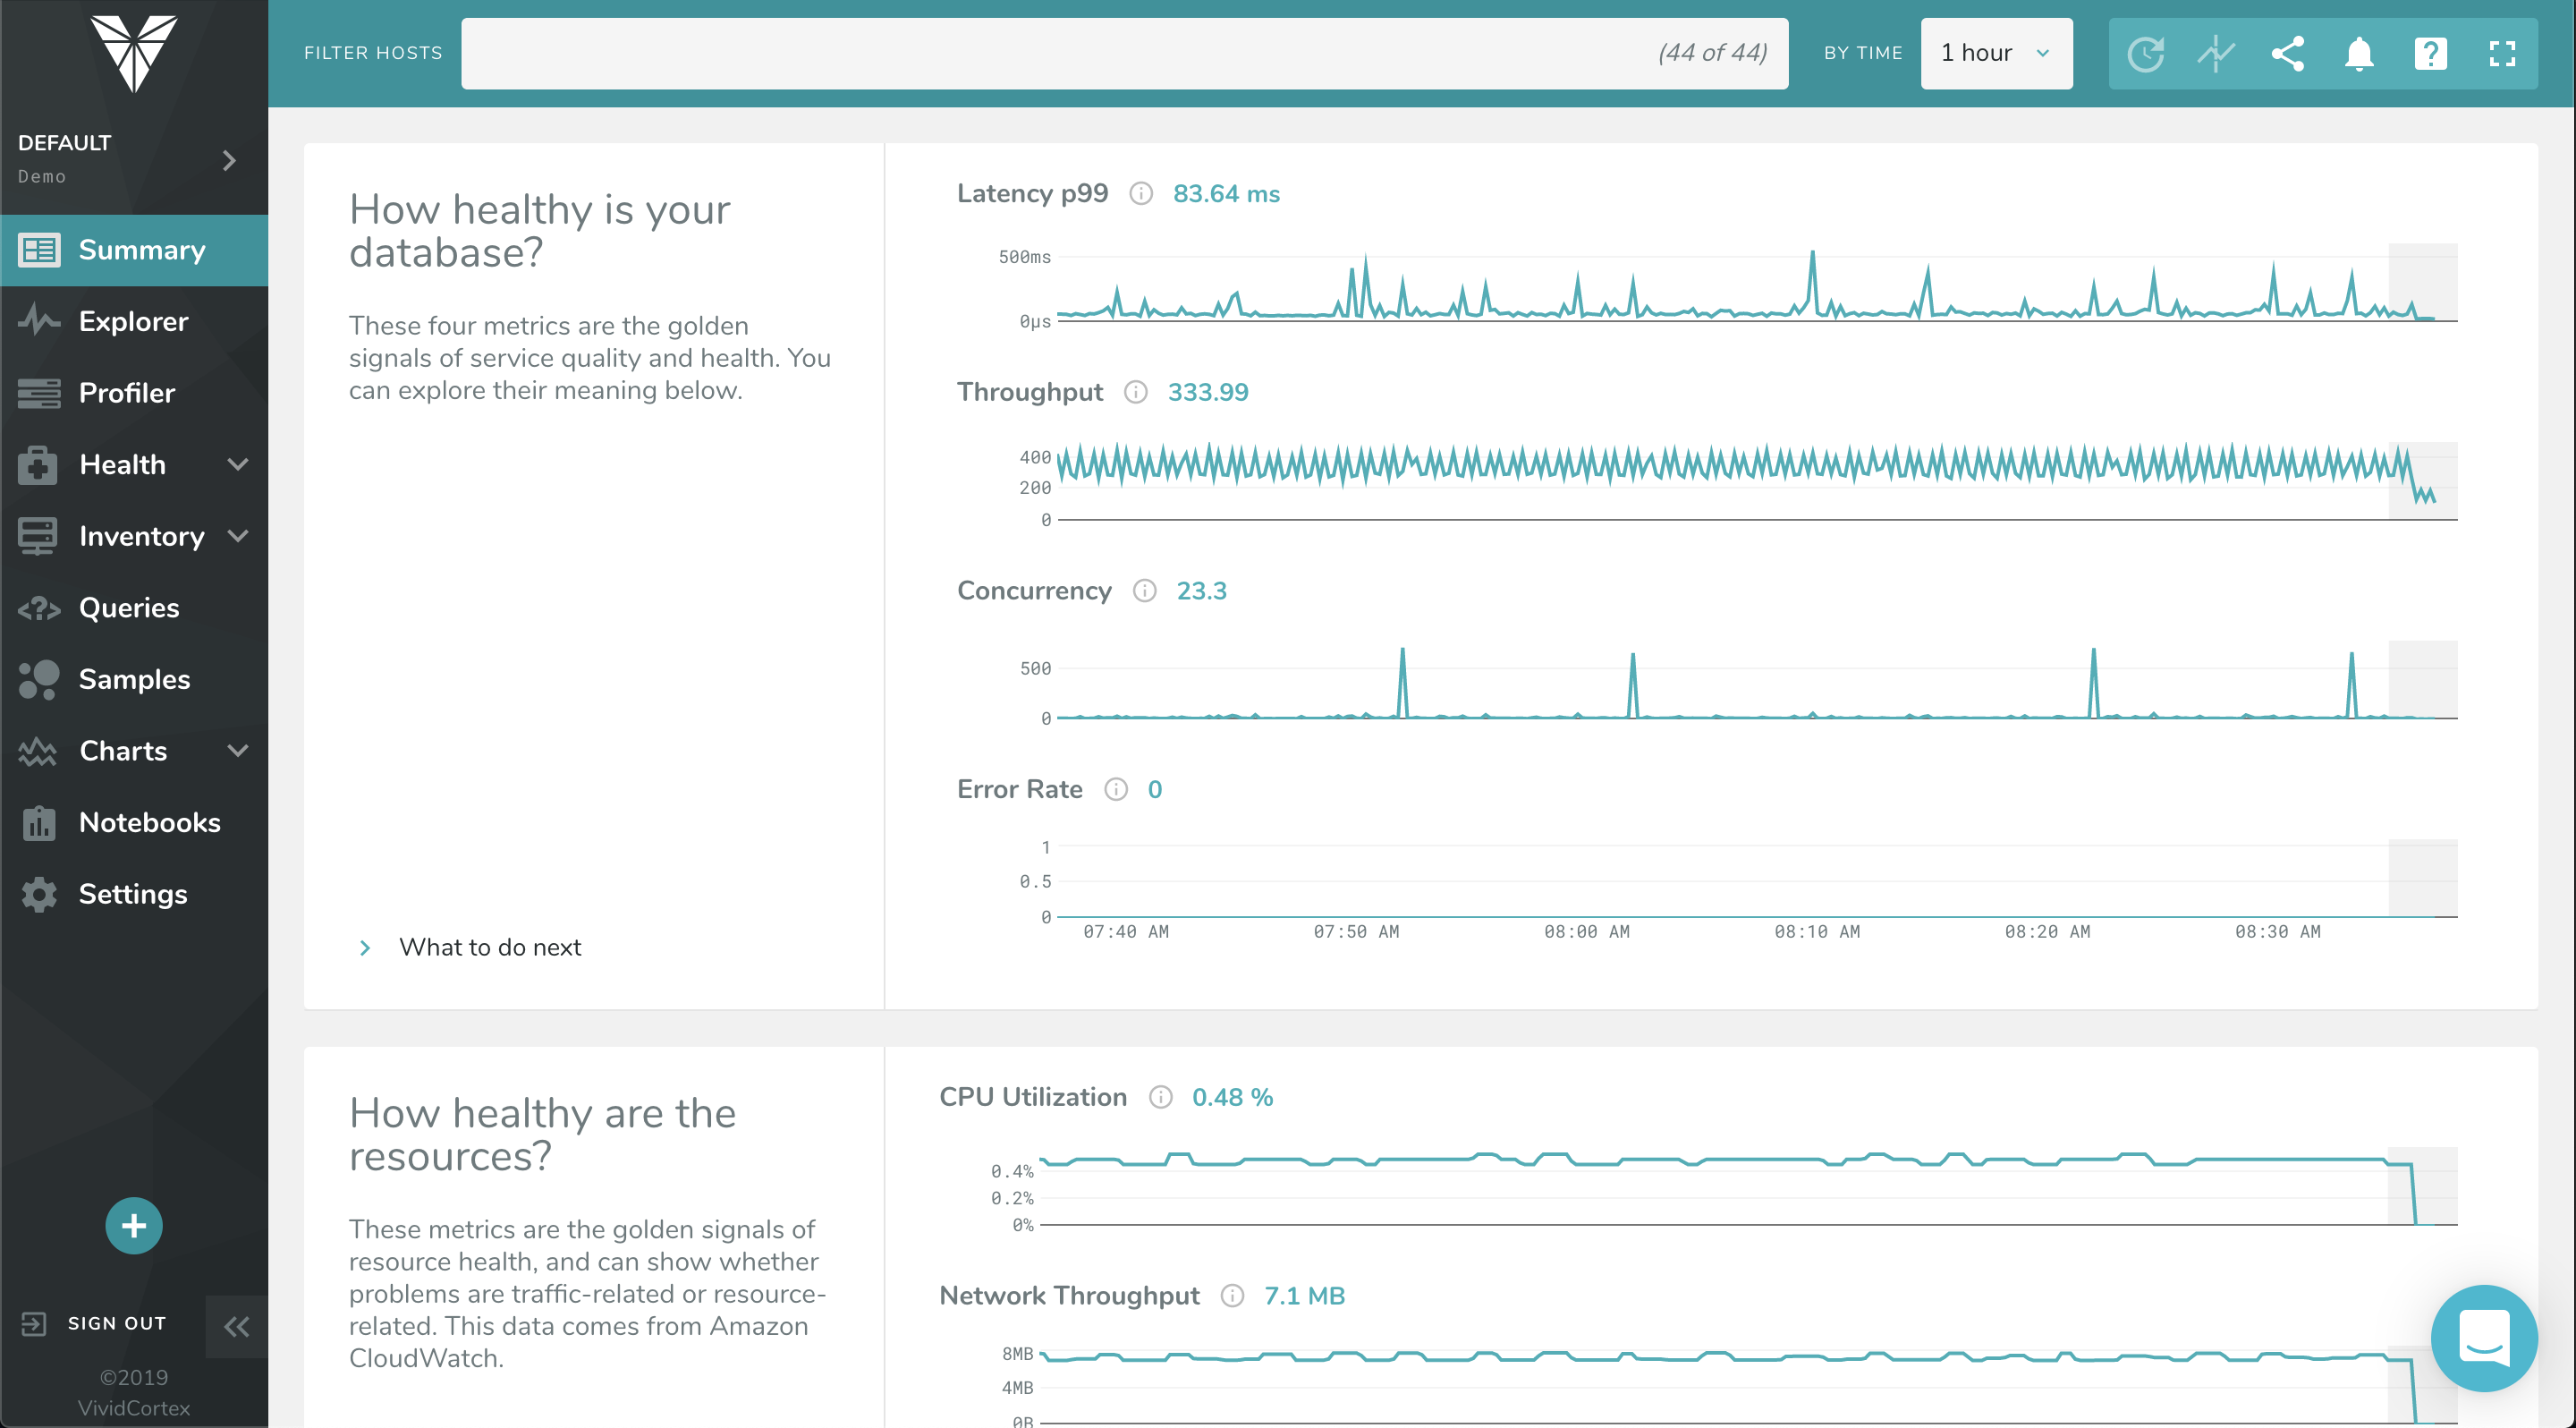
    SolarWinds Database Performance Monitor Screenshots

    Screenshot of The Profiler Dashboard is a powerful, dynamic dashboard for ranking and filtering activity on your servers: It can instantly show you what needs attention and it provides a unified view of all your database types that VividCortex monitors. It enables you to view and understand your system by profiling it according to its most significant attributes—customized and selected by you.Screenshot of This dashboard displays a list of queries and allows you to filter them with powerful specificity. Filters can be set according to query text, host, and timeframe when the query was first seen / last active.Screenshot of VividCortex captures an enormous amount of data, and the Summary Dashboard helps users make sense of it, reducing their time-to-insight. It features widgets with automatic displays for Top 5 Queries by Total Time, Top 5 Queries by User CPU, Application Overview, Critical Events, and more.Screenshot of VividCortex monitors thousands of metrics in your system, and the Charts and Dashboard’s navigation pane allows you to toggle, customize, and enable various categories of generated charts. You can then easily navigate and examine the charts’ metrics with mouseover and zoom capabilities.