Oracle’s Enterprise Manager is an on-premises monitoring and management tool. The console is designed primarily to manage other Oracle products, it but can integrate to manage non-Oracle components as well.
N/A
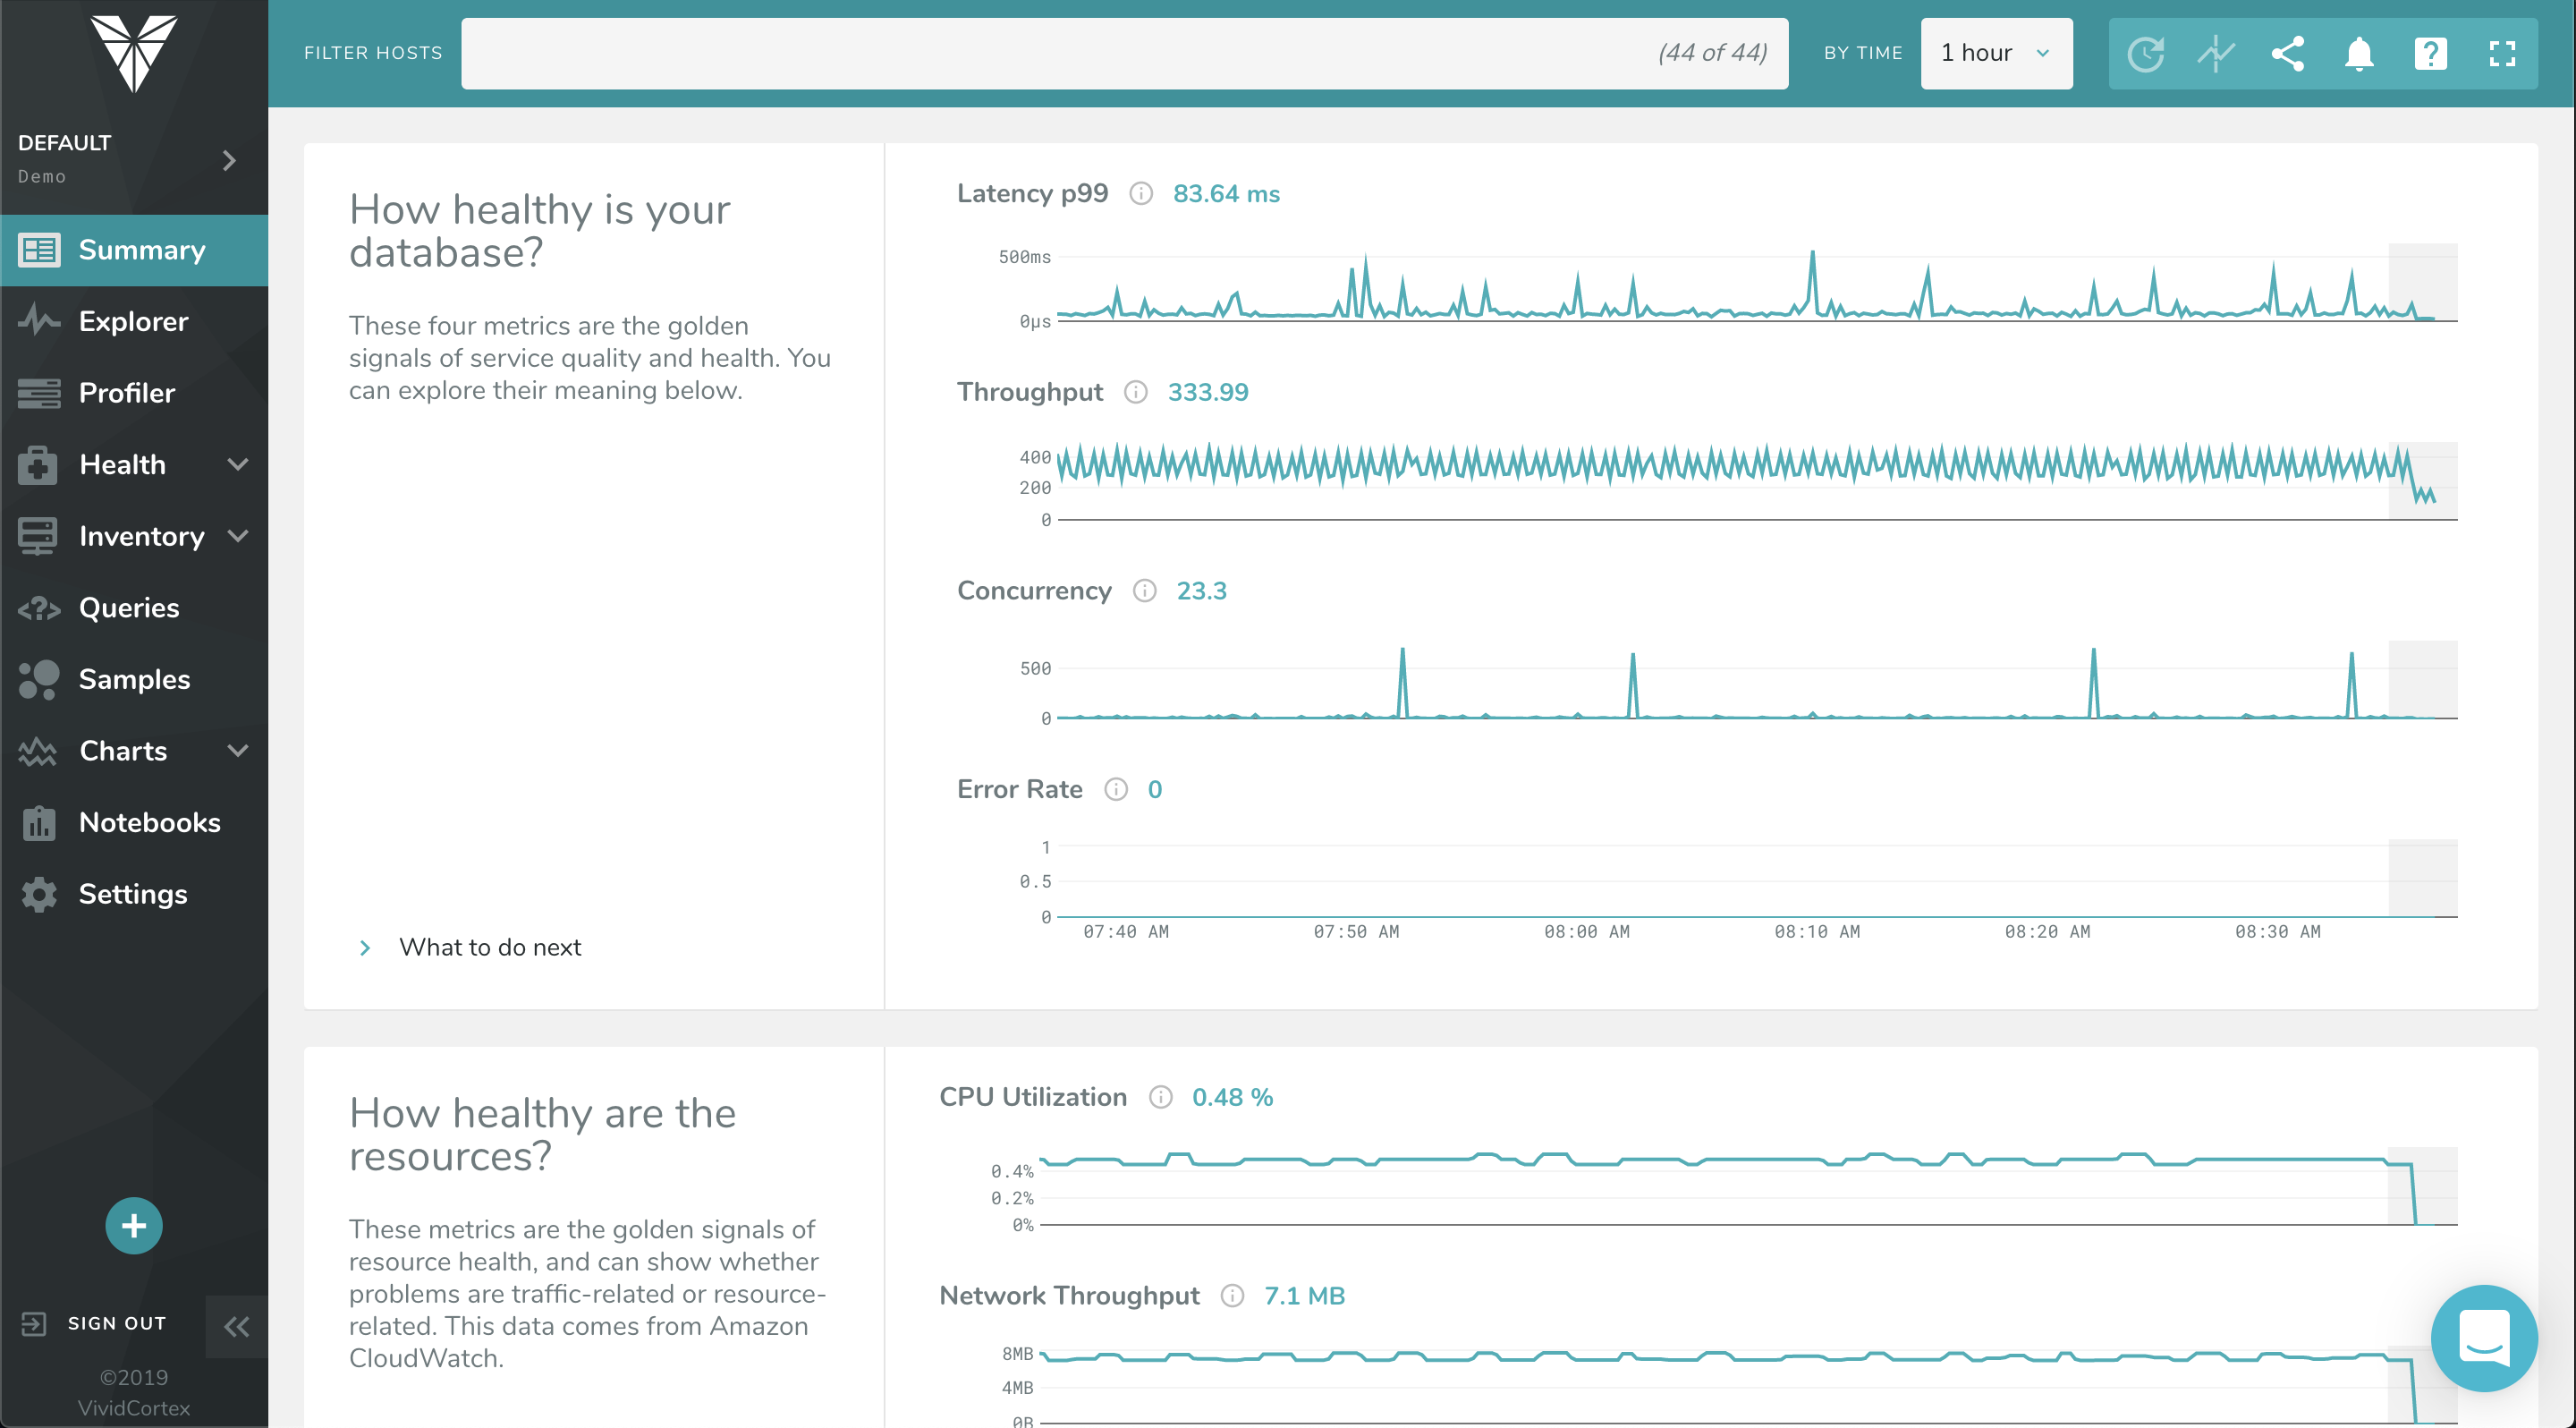
SolarWinds Database Performance Monitor
Score 9.2 out of 10
N/A
VividCortex, acquired by SolarWinds in
December 2019, provides database performance monitoring designed to increase
system performance, team efficiency, and infrastructure cost savings. The GDPR-
and SOC 2-compliant platform offers visibility into major open-source databases—MySQL,
PostgreSQL, Amazon Aurora, MongoDB, and Redis—for the engineering team at
scale. Industry leaders like Etsy, GitHub, SendGrid, and Yelp rely on Database
Performance Monitor for all-query monitoring and drill…
I wish I had an option to give it a 9.5 :) OEM Cloud Control is very well suited if you have a system with multiple implementations of Oracle Database Enterprise Edition. If you are willing to pay for the huge license cost which is typical with Oracle, then you will love to use OEM Cloud Control to monitor your entire ERP solution including web servers, applications, network, storage, and physical servers. It is not worth the buck if your's is a small implementation. Your DBA's should be able to work without depending on OEM Cloud Control.
Computing resources consumed by the DB instance, DPA queries & wait time, deadlock conditions, virtual infrastructure resources. The addition of NPM & DPA integration as well as cross-correlation in the identification of issues with the network or server or DB is all stupid-proof. Monitoring is more than just health and resource consumption, it's also performance. DB performance analysis is key to maintaining healthy DB instances.
Oracle Enterprise Manager is a "one stop shop" for all of our management needs. This is helpful because it minimizes the management of the management software itself. There are less upgrades and connectivity issues to handle. And there are "plug-ins" for additional products we use like Blue Medora's one for PostgreSQL.
Managing administrative jobs can be burdensome in a shop with dozens of servers and databases. OEM Cloud Control makes it easy since you can view all the jobs for all servers in one place. It is easy to filter on jobs with problems or the like so that you can quickly look at the logs and fix the issues.
Tuning PL/SQL is much easier using OEM Cloud Control. Most DBAs are familiar with trace files and TKPROF, but not having to do those things at a command line smooths the process out. The graphical interface makes it easier to show developers exactly what the issues are. This makes for less finger-pointing and quicker resolution of performance problems.
Proactive management is easier using OEM Cloud Control. Before having the gui, I had a collection of scripts that I would have to install on each database server, then set up cron jobs to run them. When Oracle was upgraded, those scripts might have to be updated on each and every server. OEM Cloud Control has those things built in. You can choose exactly which metrics are important to you. And you can keep performance graphs up all day on a second monitor to let you instantly see when something might cause a problem.
We also use OEM to monitor SQL Server. However, OEM only provided limited features for SQL Server. It would be nice if we can schedule backup jobs for SQL Server in OEM.
The ability to run SQL queries. You can't run queries in OEM. I have to go to SQL Developer or SQL PLUS to run. queries.
It's great! It does everything and anything you would want it to do. It can monitor things which doesn't comes out of the box by adding plug ins to it, for example, you can even monitor Oracle GoldenGate Replication by adding a plug-in to OEM Cloud Control.
I still rate OEM as a must-have tool for central management of Oracle fleet. The pros and cons of the product is prominent. Meanwhile, I also acknowledge that OEM was design about a decade ago. At that time, it did not have the landscape we have today, such as cloud, DEVOPS, machine learning, etc. I hope in future releases, the design will incorporate those features.
Kibana from Elastic is another monitoring tool that claims to provide very similar information to OEM. It seems to be an information tool rather than a tool that can actually make changes within a database. I think Kibana is more robust for hardware versus database software so it is more suited to that purpose and does to compare to the Oracle Database monitoring attributes of OEM.
Positive: Alerting features. Without this we would have to be a 24x7 shop with someone always manning the helm. With the alerting feature we can define levels of alerts and only get the most pressing alerts sent out.
ROI: OEM is free, so the ROI is whatever you make of it.