New Relic vs. SolarWinds Database Performance Monitor

Overview
ProductRatingMost Used ByProduct SummaryStarting Price
New Relic
Score 7.9 out of 10
N/A
New Relic is a SaaS-based web and mobile application performance management provider for the cloud and the datacenter. They provide code-level diagnostics for dedicated infrastructures, the cloud, or hybrid environments and real time monitoring.
$0
No credit card required; 100 GB free ingest per month, 1 free full user + unlimited basic users, 8 days retention, 100 Synthetics Checks
SolarWinds Database Performance Monitor
Score 9.2 out of 10
N/A
VividCortex, acquired by SolarWinds in December 2019, provides database performance monitoring designed to increase system performance, team efficiency, and infrastructure cost savings. The GDPR- and SOC 2-compliant platform offers visibility into major open-source databases—MySQL, PostgreSQL, Amazon Aurora, MongoDB, and Redis—for the engineering team at scale. Industry leaders like Etsy, GitHub, SendGrid, and Yelp rely on Database Performance Monitor for all-query monitoring and drill…N/A
Pricing
New RelicSolarWinds Database Performance Monitor
Editions & Modules
Free (Forever)
$0
No credit card required; 100 GB free ingest per month, 1 free full user + unlimited basic users, 8 days retention, 100 Synthetics Checks
Telemetry Data Platform
$0.25
per month per extra GB data ingest (after first free 100GB per month)
Incident Intelligence
$0.50
per month per event (after first 1000 free events per month)
Standard
$99
per month per full user (after first free full user - unlimited free basic users)
Pro
Contact sales team
Enterprise
Contact sales team
No answers on this topic
Offerings
Pricing Offerings
New RelicSolarWinds Database Performance Monitor
Free Trial
NoYes
Free/Freemium Version
YesNo
Premium Consulting/Integration Services
NoNo
Entry-level Setup FeeNo setup feeNo setup fee
Additional Details
More Pricing Information
Community Pulse
New RelicSolarWinds Database Performance Monitor
Best Alternatives
New RelicSolarWinds Database Performance Monitor
Small Businesses
InfluxDB
InfluxDB
Score 8.8 out of 10

No answers on this topic

Medium-sized Companies
Sumo Logic
Sumo Logic
Score 9.4 out of 10
LogicMonitor
LogicMonitor
Score 8.4 out of 10
Enterprises
NetBrain Technologies
Score 9.2 out of 10
LogicMonitor
LogicMonitor
Score 8.4 out of 10
All AlternativesView all alternativesView all alternatives
User Ratings
New RelicSolarWinds Database Performance Monitor
Likelihood to Recommend
6.6
(0 ratings)
8.0
(0 ratings)
Likelihood to Renew
9.0
(0 ratings)
-
(0 ratings)
Usability
8.9
(0 ratings)
-
(0 ratings)
Availability
9.1
(0 ratings)
-
(0 ratings)
Performance
8.2
(0 ratings)
-
(0 ratings)
Support Rating
7.5
(0 ratings)
-
(0 ratings)
Implementation Rating
8.0
(0 ratings)
-
(0 ratings)
Configurability
9.1
(0 ratings)
-
(0 ratings)
Ease of integration
9.1
(0 ratings)
-
(0 ratings)
Product Scalability
9.1
(0 ratings)
-
(0 ratings)
Vendor post-sale
9.1
(0 ratings)
-
(0 ratings)
Vendor pre-sale
7.3
(0 ratings)
-
(0 ratings)
User Testimonials
New RelicSolarWinds Database Performance Monitor
Likelihood to Recommend
It is perfect for observing our energy platforms during high-load situations, such as grid demand spikes, or our real-time ingest of sensor data, allowing us to respond in real time to anomalies. And it’s a good way to monitor API performance in client dashboards, too. But it’s not as conducive for low-budget/low-code work or deep customization that doesn’t get ample development support given its complexity and expense.
Read full review
Computing resources consumed by the DB instance, DPA queries & wait time, deadlock conditions, virtual infrastructure resources. The addition of NPM & DPA integration as well as cross-correlation in the identification of issues with the network or server or DB is all stupid-proof. Monitoring is more than just health and resource consumption, it's also performance. DB performance analysis is key to maintaining healthy DB instances.
Read full review
Pros
  • Capturing Front end Metrics specially web vitals and setting up alerts for violations really helps.
  • NRQL is great tool to fetch the data you need. With queries you can pull the data and put the data by table or by chart. You can even trend graphs and create dashboards.
  • Synthetic Monitoring is very helpful for proactive monitoring. You can use it for user journeys by using scripted browser monitor type or just check availability using PING type.
  • ASk AI is great addition that can fetch details you need with natuaral language
Read full review
  • Simple to use and very easy to learn.
  • The execution engines run in parallel, can execute any syntax or query.
  • DPN can run all queries for both Oracle and SQL with no additional support.
Read full review
Cons
  • Support for SQL like query with more functional features of analysis while viewing distributed tracing.
  • support for very low level specific integration from APIs to classes to functions to piece of code
  • More detailed documentation, as we faced issues while integrating for the first time.
Read full review
  • The Reporting feature currently doesn't allow customization.
Read full review
Likelihood to Renew
I have not yet found any similar product that offers me this range of features to help us keep our online service fast and reliable. Besides this, New Relic is constantly evolving by adding new plugins to emerging technologies and platforms. Server performance measuring features are a key point as our user database grows.
Read full review
No answers on this topic
Usability
New Relic helps in observability setup for the critical environments and getting known about the issues and troubleshoot the applications and services. Alerts helps in knowing the abnormal state of the system and services, Dashboards are used for visualizing the key metrics and muting the unwanted notifications and dropping the extra data from the source.
Read full review
No answers on this topic
Reliability and Availability
Never observed an outage
Read full review
No answers on this topic
Performance
Always responsive. Never observed slow page loads
Read full review
No answers on this topic
Support Rating
The support team has been really helpful and resolved most of the issues on time. However, for a couple of issues, several follow-ups were needed to elicit a reasonable response. The issue was deeply technical and could have been investigated only by their Architects, and bringing them into the ticket took longer than needed
Read full review
No answers on this topic
Implementation Rating
The documentation was clear and concise; the only issue we ran into was custom application naming. Due to HTTPD mod_fcgid and the need for the application name to be set in php.ini (not in .htaccess or the virtual host directive) ... we had issues setting this up.
Read full review
No answers on this topic
Alternatives Considered
Its covers all the observability aspects as well as giving us more competitive pricing models compared to other providers that's why I like to use New Relic in place of other tools. And also it introduces new Agentic AI features as well as it adopts AI in its RCA. As an observability tool it should reduce the RCA of any problem and New Relic is continuously focusing on that that's why I am preferring New Relic in place of other tools.
Read full review
DPM is less expensive and more feature-rich. Also, Oracle tech support is garbage, unless you can afford to spend a day getting assistance.
Read full review
Scalability
Agent deployment is easily integrated into our workflow. Adding the agent to new servers is quick and painless
Read full review
No answers on this topic
Return on Investment
  • We were able to quickly identify our most time consuming APIs. In some cases we were able to bring down times for some apis from 4s to 200ms.
  • We were able to identify our slowest database queries and optimize them for quicker response times.
Read full review
  • What is the cost of a downed DB instance? That's your ROI. DPM lets you see issues before they become critical.
Read full review
ScreenShots

SolarWinds Database Performance Monitor Screenshots

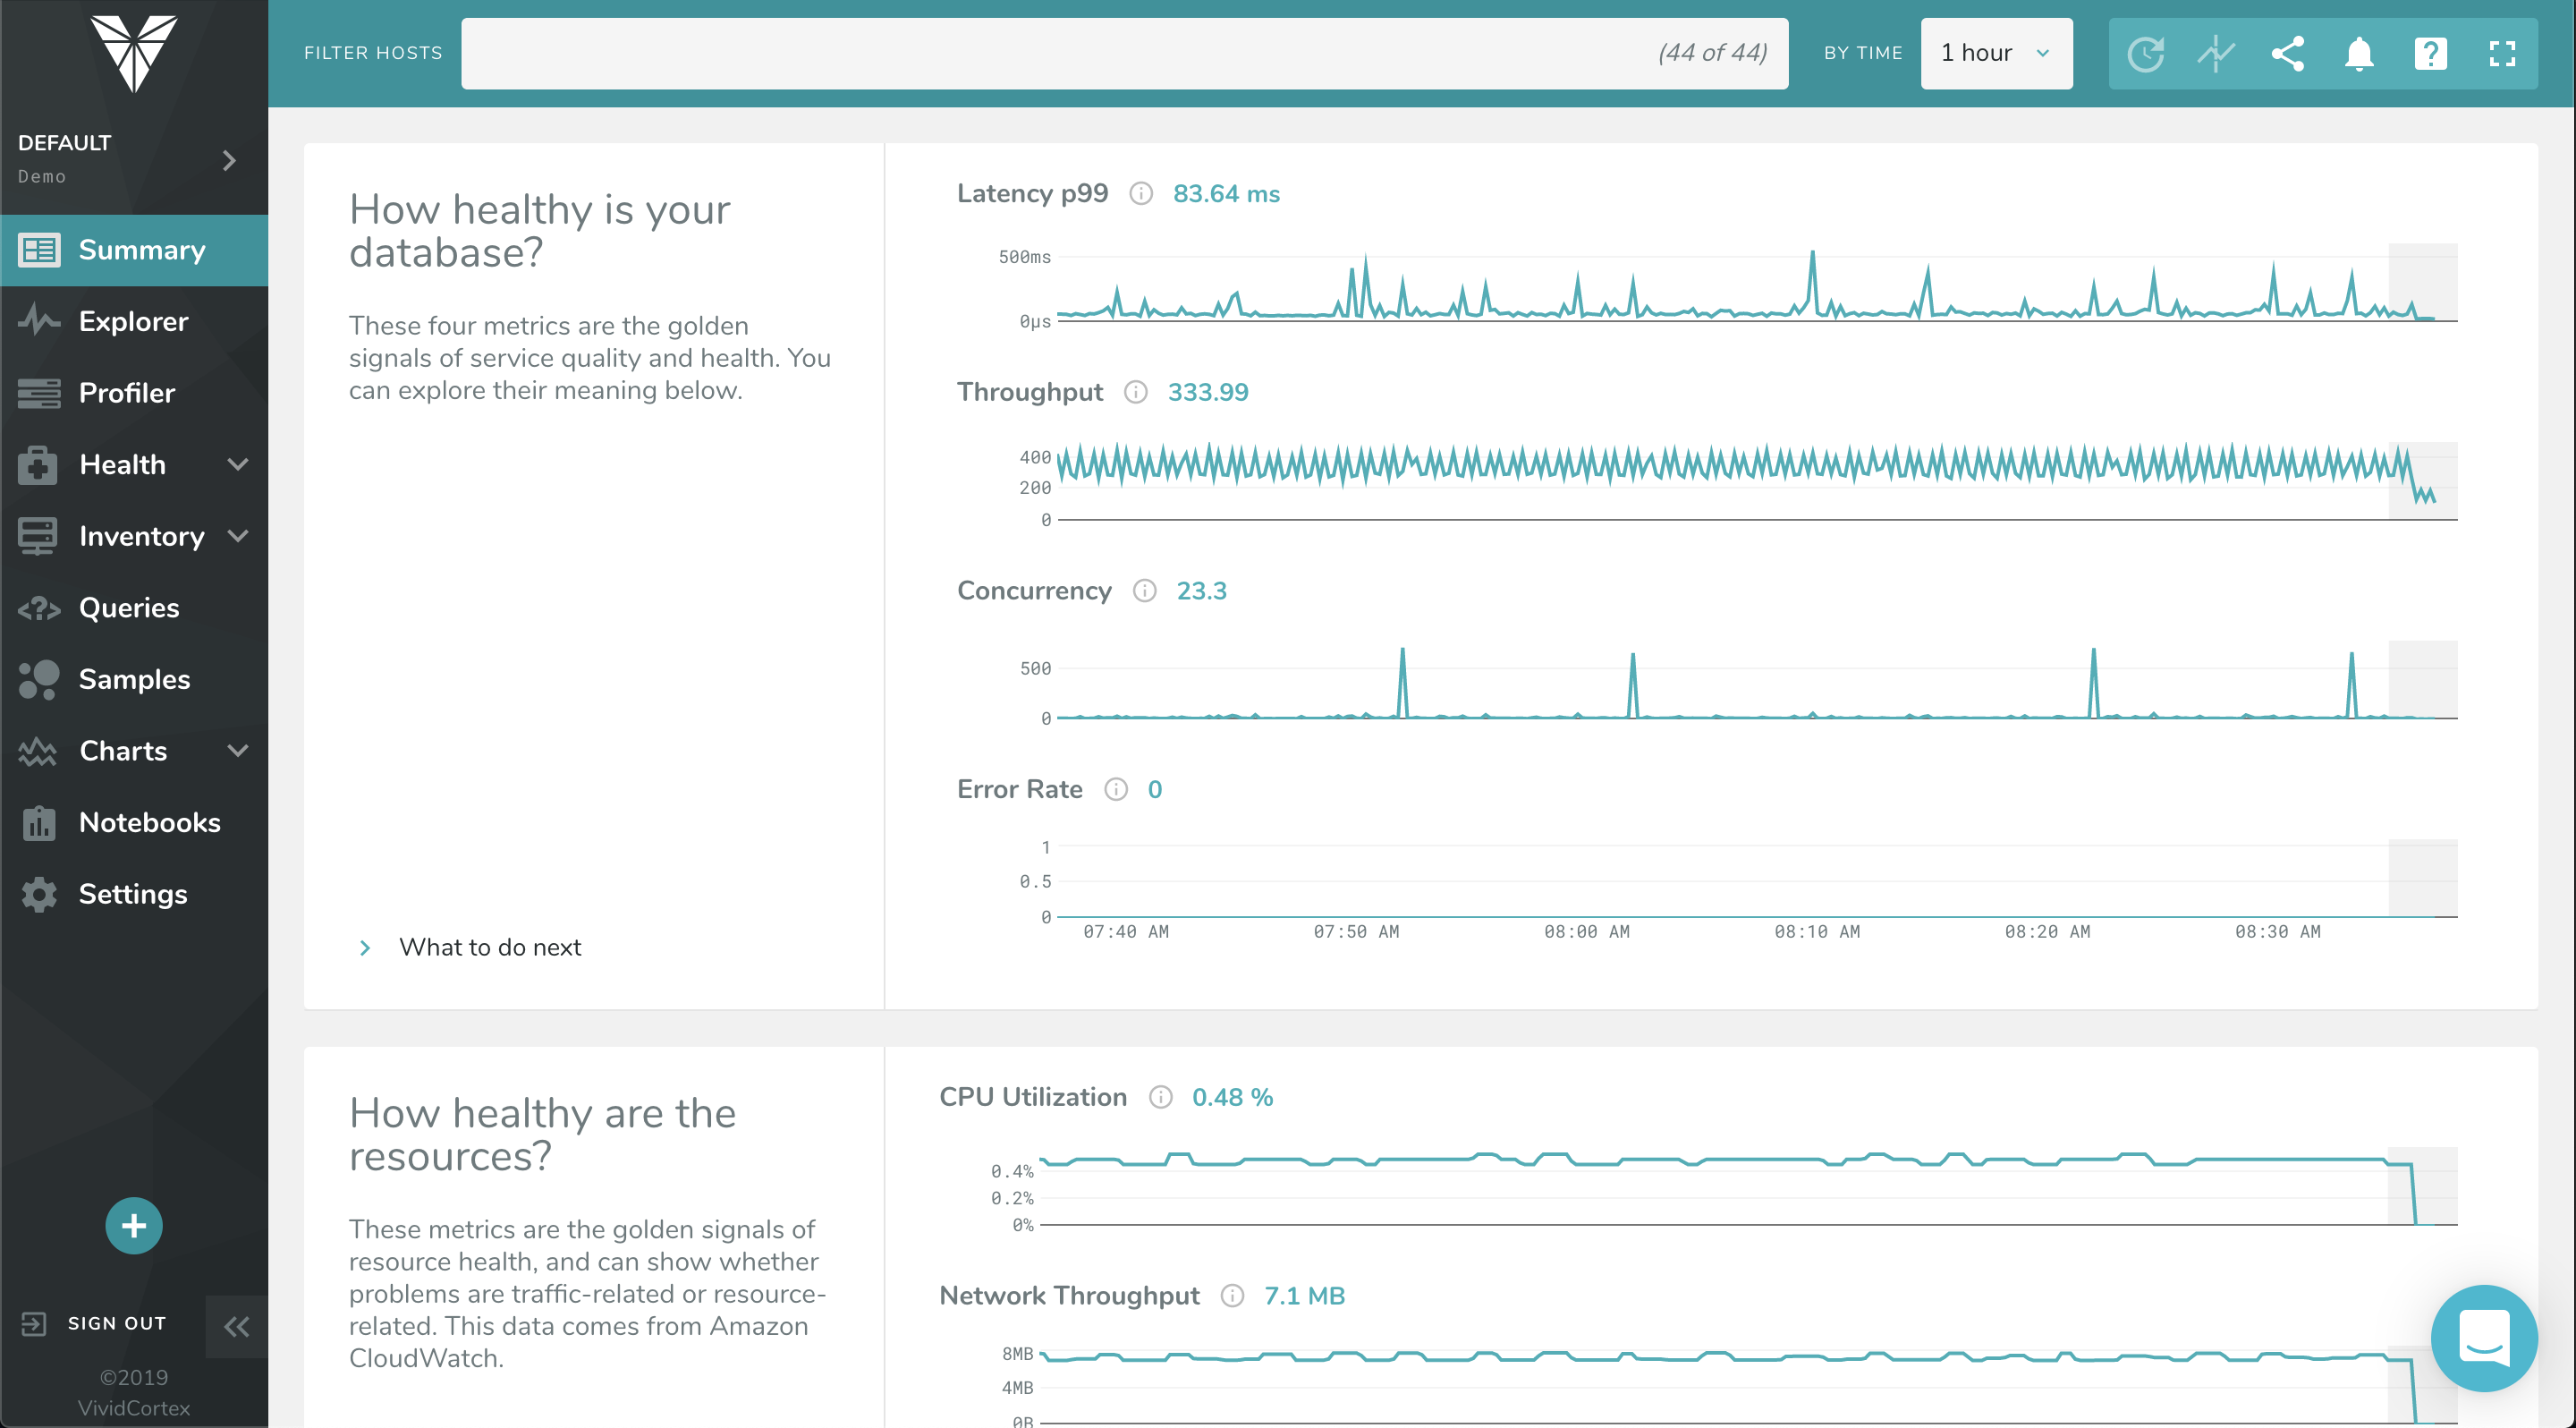
Screenshot of The Profiler Dashboard is a powerful, dynamic dashboard for ranking and filtering activity on your servers: It can instantly show you what needs attention and it provides a unified view of all your database types that VividCortex monitors. It enables you to view and understand your system by profiling it according to its most significant attributes—customized and selected by you.Screenshot of This dashboard displays a list of queries and allows you to filter them with powerful specificity. Filters can be set according to query text, host, and timeframe when the query was first seen / last active.Screenshot of VividCortex captures an enormous amount of data, and the Summary Dashboard helps users make sense of it, reducing their time-to-insight. It features widgets with automatic displays for Top 5 Queries by Total Time, Top 5 Queries by User CPU, Application Overview, Critical Events, and more.Screenshot of VividCortex monitors thousands of metrics in your system, and the Charts and Dashboard’s navigation pane allows you to toggle, customize, and enable various categories of generated charts. You can then easily navigate and examine the charts’ metrics with mouseover and zoom capabilities.