Lucid Visual Collaboration Suite vs. SmartDraw

Overview
ProductRatingMost Used ByProduct SummaryStarting Price
Lucid Visual Collaboration Suite
Score 8.5 out of 10
N/A
The Lucid Visual Collaboration Suite empowers teams to ideate, plan, design, build, and launch game-changing solutions from a shared infinite canvas.
$0
SmartDraw
Score 5.9 out of 10
N/A
SmartDraw is a diagramming and flow chart building tool from SmartDraw Software in San Diego, California.
$119.40
per year per user (3 minimum)
Pricing
Lucid Visual Collaboration SuiteSmartDraw
Editions & Modules
Free
$0
Individual
$9
per month per user
Team
$10
per month per user (3 user minimum)
Enterprise
.
per year
Team
$119.40
per year per user (3 minimum)
Individual
$131.40
per year single user
Enterprise
Contact Sales
Offerings
Pricing Offerings
Lucid Visual Collaboration SuiteSmartDraw
Free Trial
YesYes
Free/Freemium Version
YesNo
Premium Consulting/Integration Services
NoNo
Entry-level Setup FeeOptionalNo setup fee
Additional Details
More Pricing Information
Community Pulse
Lucid Visual Collaboration SuiteSmartDraw
Best Alternatives
Lucid Visual Collaboration SuiteSmartDraw
Small Businesses

No answers on this topic

OmniGraffle
OmniGraffle
Score 9.1 out of 10
Medium-sized Companies
Microsoft Visio
Microsoft Visio
Score 7.6 out of 10
Cvent Event Diagramming
Score 9.5 out of 10
Enterprises
Miro
Miro
Score 9.2 out of 10
Cvent Event Diagramming
Score 9.5 out of 10
All AlternativesView all alternativesView all alternatives
User Ratings
Lucid Visual Collaboration SuiteSmartDraw
Likelihood to Recommend
8.8
(0 ratings)
2.8
(0 ratings)
Likelihood to Renew
9.1
(0 ratings)
-
(0 ratings)
Usability
8.9
(0 ratings)
-
(0 ratings)
Support Rating
7.3
(0 ratings)
8.4
(0 ratings)
User Testimonials
Lucid Visual Collaboration SuiteSmartDraw
Likelihood to Recommend
It is hard to think of ways in which Lucid Visual Collaboration Suite would not be best suited to provide an effective tool for any organization to find success in its use. Whether it is a visual display to map an organizational structure, a collaboration to find an answer of how to improve workflow, or even to display the upcoming budget needs, working in Lucid can seamlessly provide that!
Read full review
As a developer i use it extensively for sharing ideas specially related for system design and application flows. Entire team finds it comfortable to use it, understand it and make changes swiftly. We use it for High Level System design. While discussing the only missing thing we find about it is the integration of an ide for Low Level Design but in my opinion this tool isn't made for that purpose.
Read full review
Pros
  • Serverless. You don't need to install another program to create diagrams, you just open a new tab and there you are, ready to go.
  • Collaboration. You don't need to update your colleague diagram by creating a new file and creating a new file version, you both are in the same diagram and you and all the team are free to update it at any time, at the same time, you are seeing the same thing. That is really helpful and time-saving.
  • Shapes. It has any shape that you can think of and Lucidchart is always updating them, I can create an Azure solution architecture, an AWS one, an old on-premise solution. Or just put standard shapes to describe a business process. Providing so many specific shapes help the diagram to express specific information, and for specific teams, that's less text and more visual information, you don't need to put a text below a standard database shape (this is an Azure SQL database), you just put the azure shape and done. That....is beautifully helpful.
Read full review
  • Provides examples to work off of--these are helpful when you don't know exactly where to start.
  • Provides a number of stylistic options without making things too complex, so you can be creative without getting overwhelmed.
  • Provides a wide variety of templates, meets a wide variety of needs.
Read full review
Cons
  • Bandwidth - when working with complex workflows spanning multiple shapes and layers, the page tends to slow down and sometimes crash.
  • Zooming in & out - when a workflow is spread out over multiple pages, the view can become small even with a large screen.
  • Pricing - newly introduced monthly/annual pricing schemes are not as good as previous quarterly payment models.
Read full review
  • A month-to-month plan would be ideal for users that don't have a need to create many projects
  • The sidebar navigation can be a little confusing with all of the tools listed.
  • Offering customizable plans with only the feature you need would simplify navigation
Read full review
Usability
The interface is easy to use and understand and most features feel very familiar from the start. There are so many features and functions that users may not know it can be done without some instruction. Lucid's champion network is a great, fun resource to learn more about the product.
Read full review
No answers on this topic
Support Rating
I would rate the overall support for Lucidchart as a 9. The support provided is generally robust and responsive. Their help center, tutorials, and webinars offer extensive resources for users. The ticket-based support system is effective, providing timely resolutions to most issues. Moreover, they actively gather user feedback, demonstrating a commitment to continuous improvement
Read full review
They are always very helpful, we get computers every two years and I have to call them to move the license from one computer to another and they do it with a smile in their voice!
Read full review
Alternatives Considered
Based on my personal experience, Lucid Visual Collaboration Suite is head and shoulders above any other competitor. Canva is good, but not intuitive at all. Miro is good as well, but not nearly as appealing and still lacks some of the logical functions that LucidSpark has. I’ve also used Apple FreeForm quite a bit, which is a free software with Apple. Once again you can accomplish the same things in any of these software, but Lucid Visual Collaboration Suite is so much better to the point that it is 3-4 times faster to use Lucid than Free Form or Canva.
Read full review
As noted in first question, SmartDraw has them beat in every category I can think of (except for price; but need to keep in mind the old adage "you get what you pay for"!). This product allows for VASTLY-improved uploading of data than the Lucidchart product, and customer service is real, tangible service... they understand that when you have a question and need an answer, waiting 2 or 3 days for an email response is not acceptable.
Read full review
Return on Investment
  • Though I can't necessarily provide hard numbers, I can confidently say that Lucidchart has saved countless hours for myself and my teams as we don't need to try to develop some type of complex diagram using markup or any kind of code.
  • I have previously been able to build a complete ERD using Lucidchart in a past position, which the company never had before. It ended up being used by countless teams in the company and ultimately in a large-scale data stack migration effort.
Read full review
  • SmartDraw has provided good return for our internal purposes. Using it to understand an organization's structure and inner workings has been valuable. On the client side, creating steps and businesses processes has also been a big plus. It has helped decrease confusing reporting structures and has provided a detailed map for individuals to understand where they fit within their organization.
  • Unfortunately, SmartDraw has been somewhat inefficient with some of the more complex projects on our plate and has really deterred certain employees from even wanting to use it.
Read full review
ScreenShots

Lucid Visual Collaboration Suite Screenshots
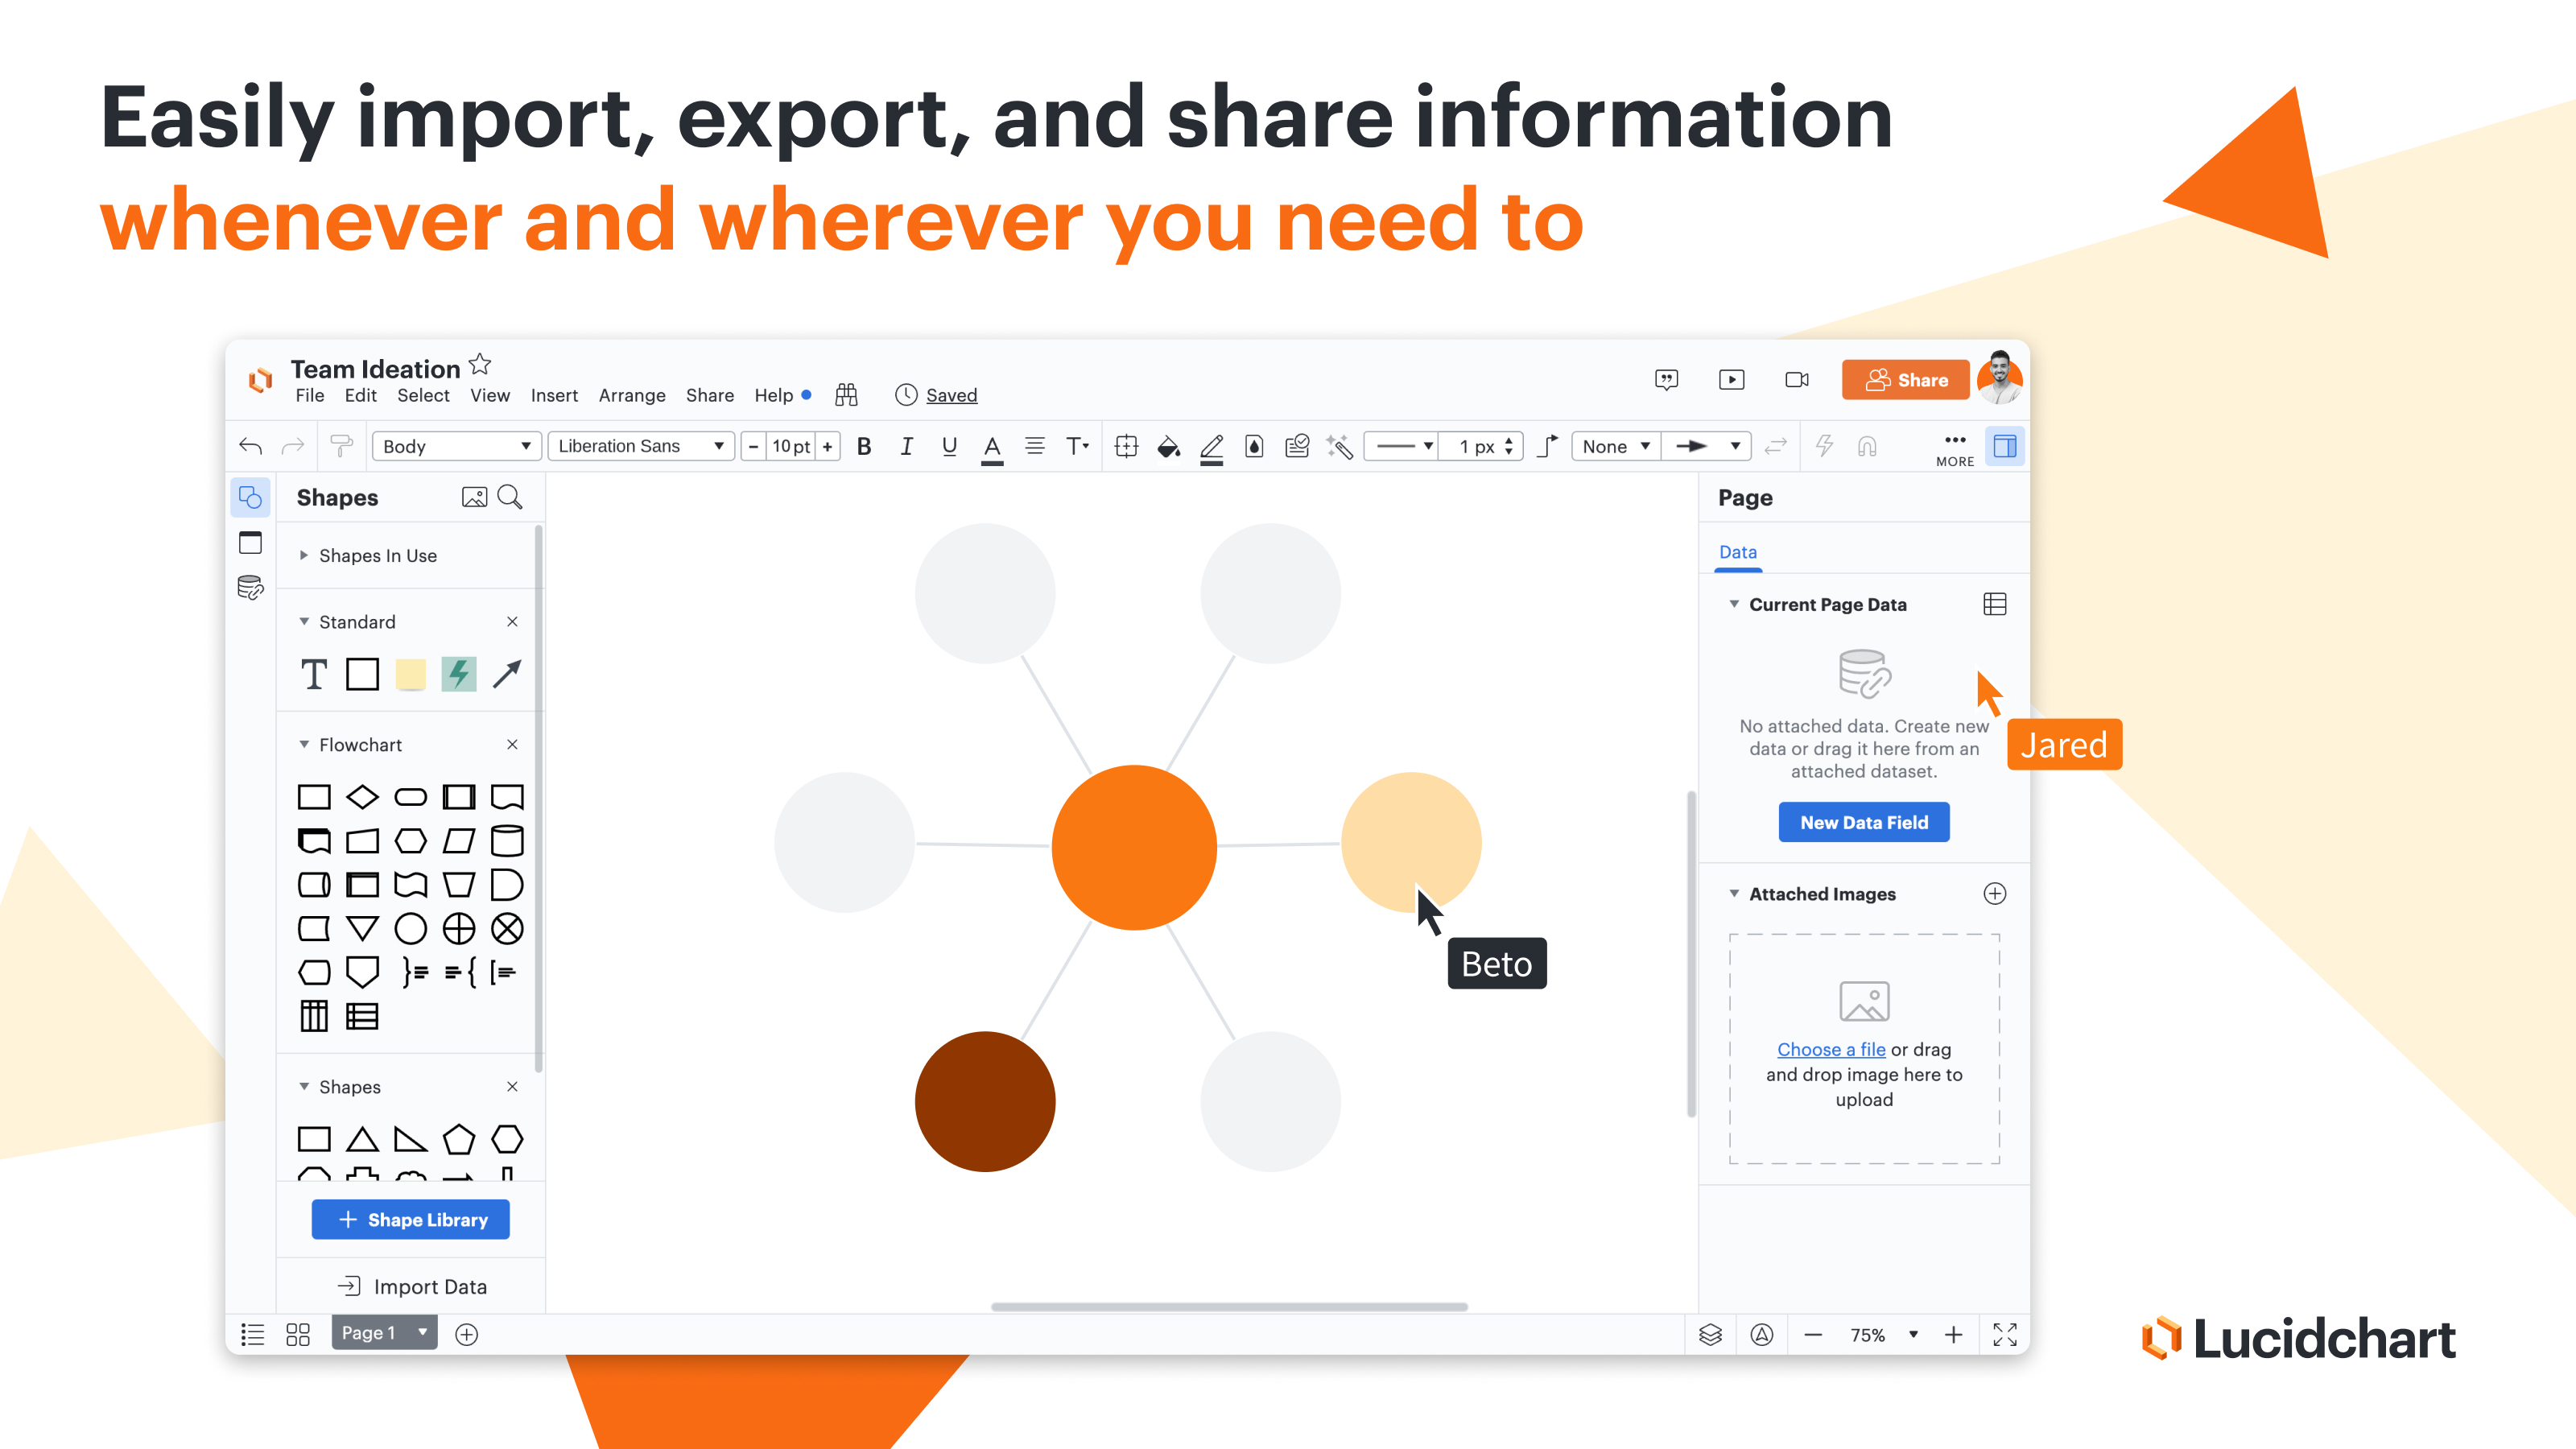
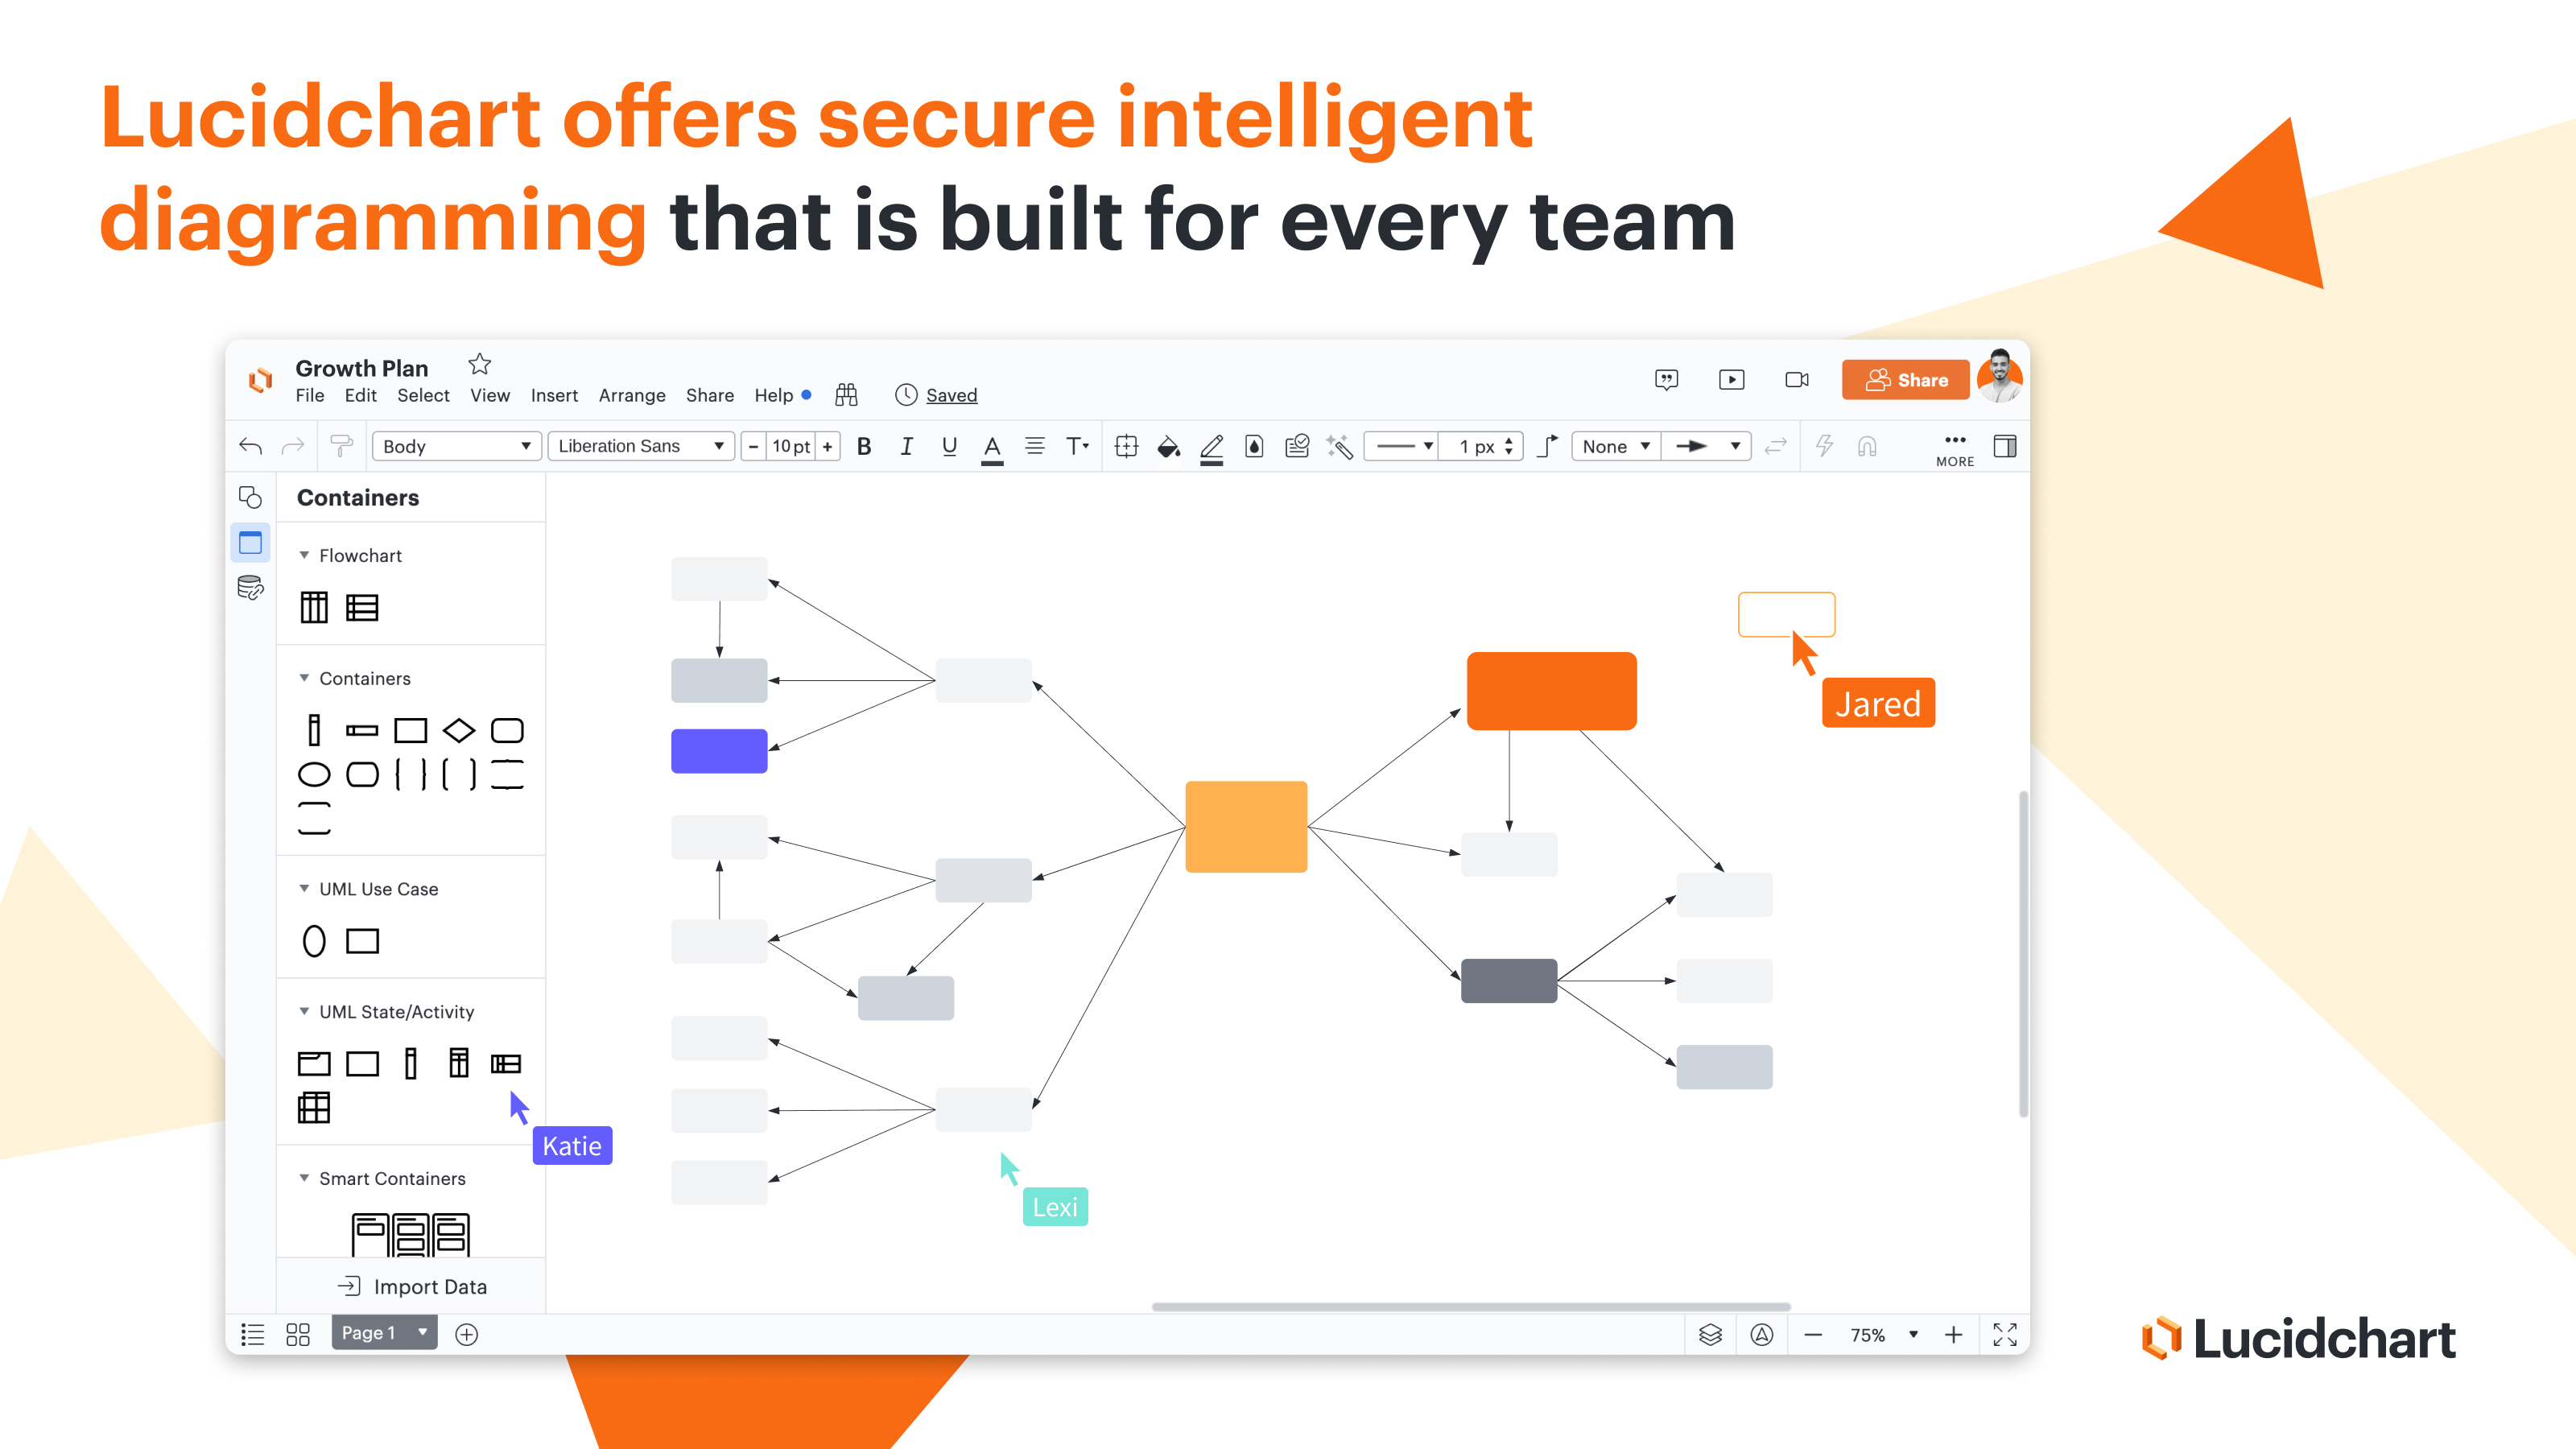
Screenshot of how Lucid helps teams to clarify complexity, align their insights.Screenshot of where information can be imported, exported, and shared whenever and wherever it is needed.Screenshot of how Lucidchart offers secure intelligent diagramming that is built for teams.

SmartDraw Screenshots

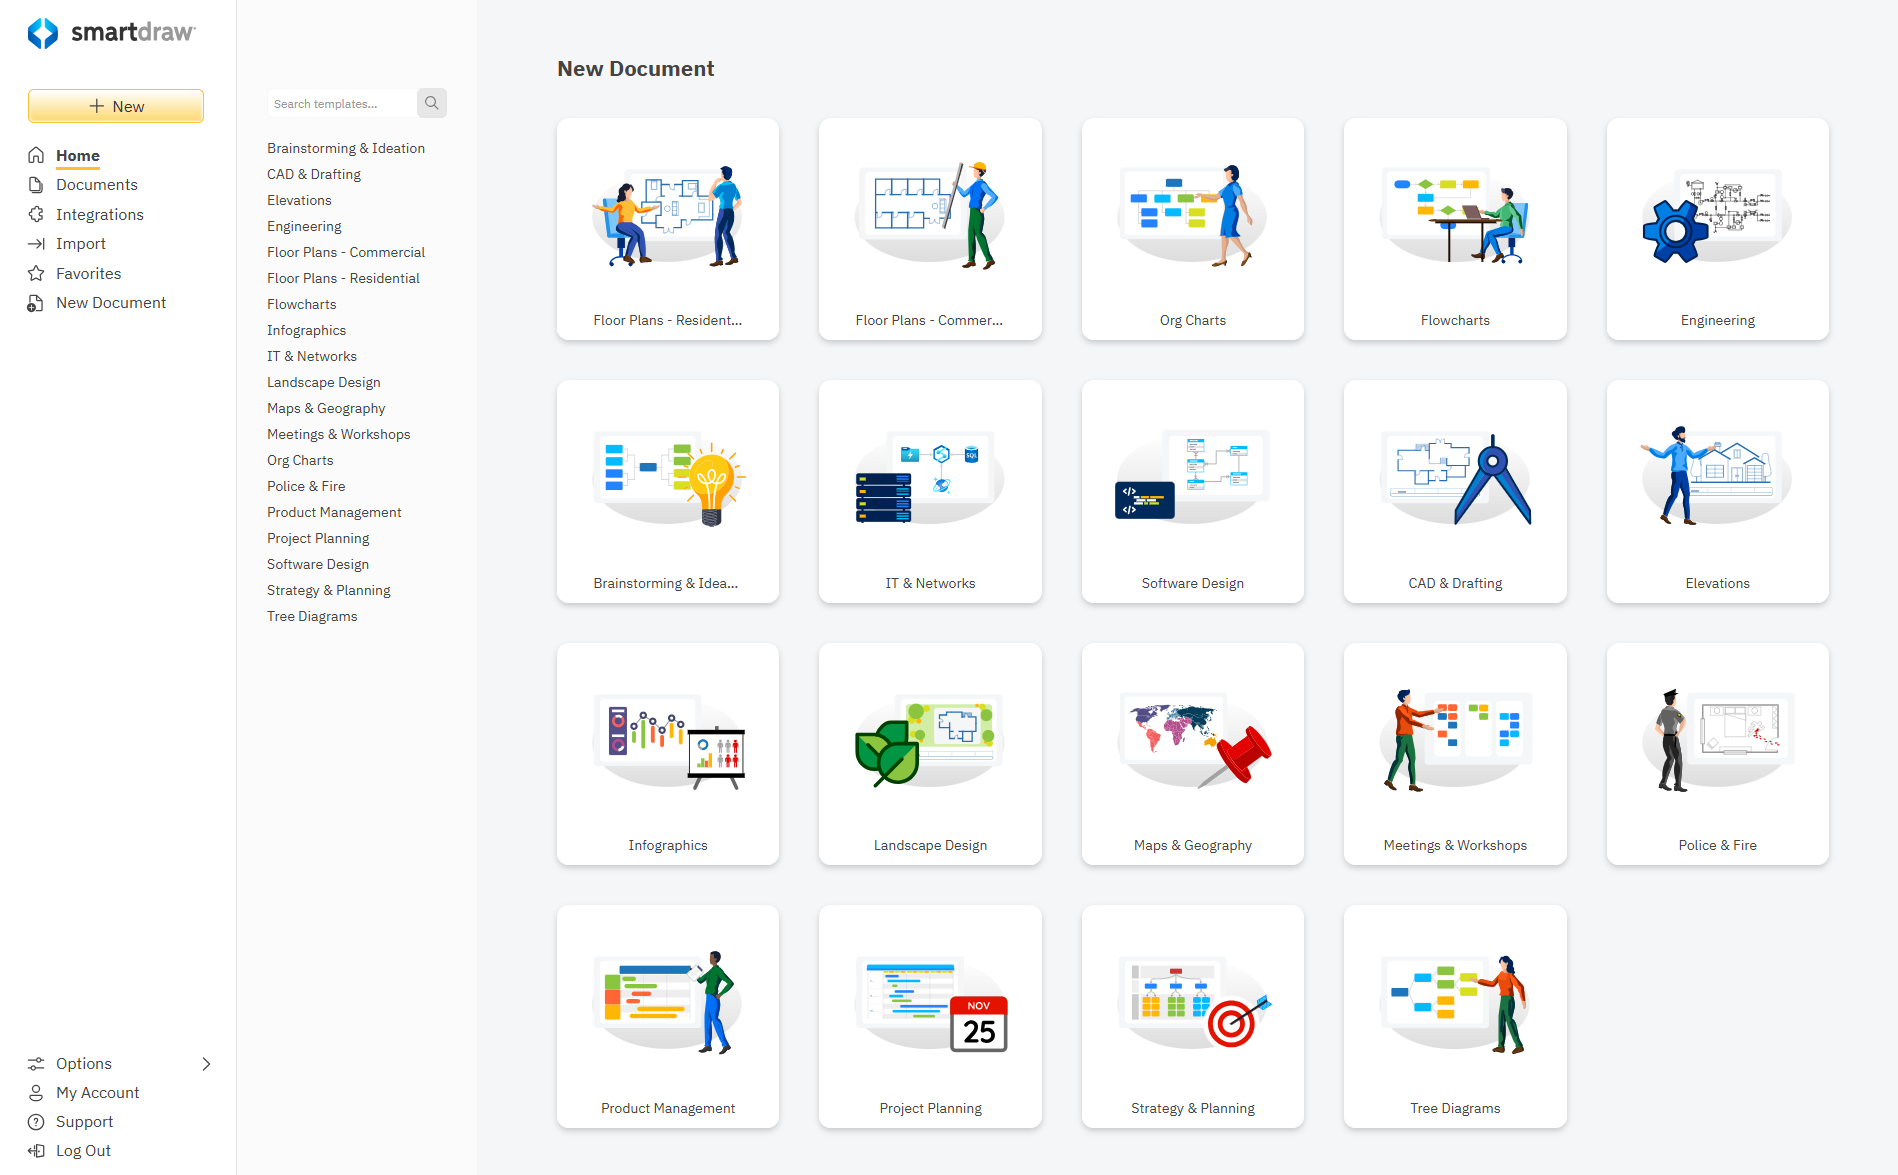
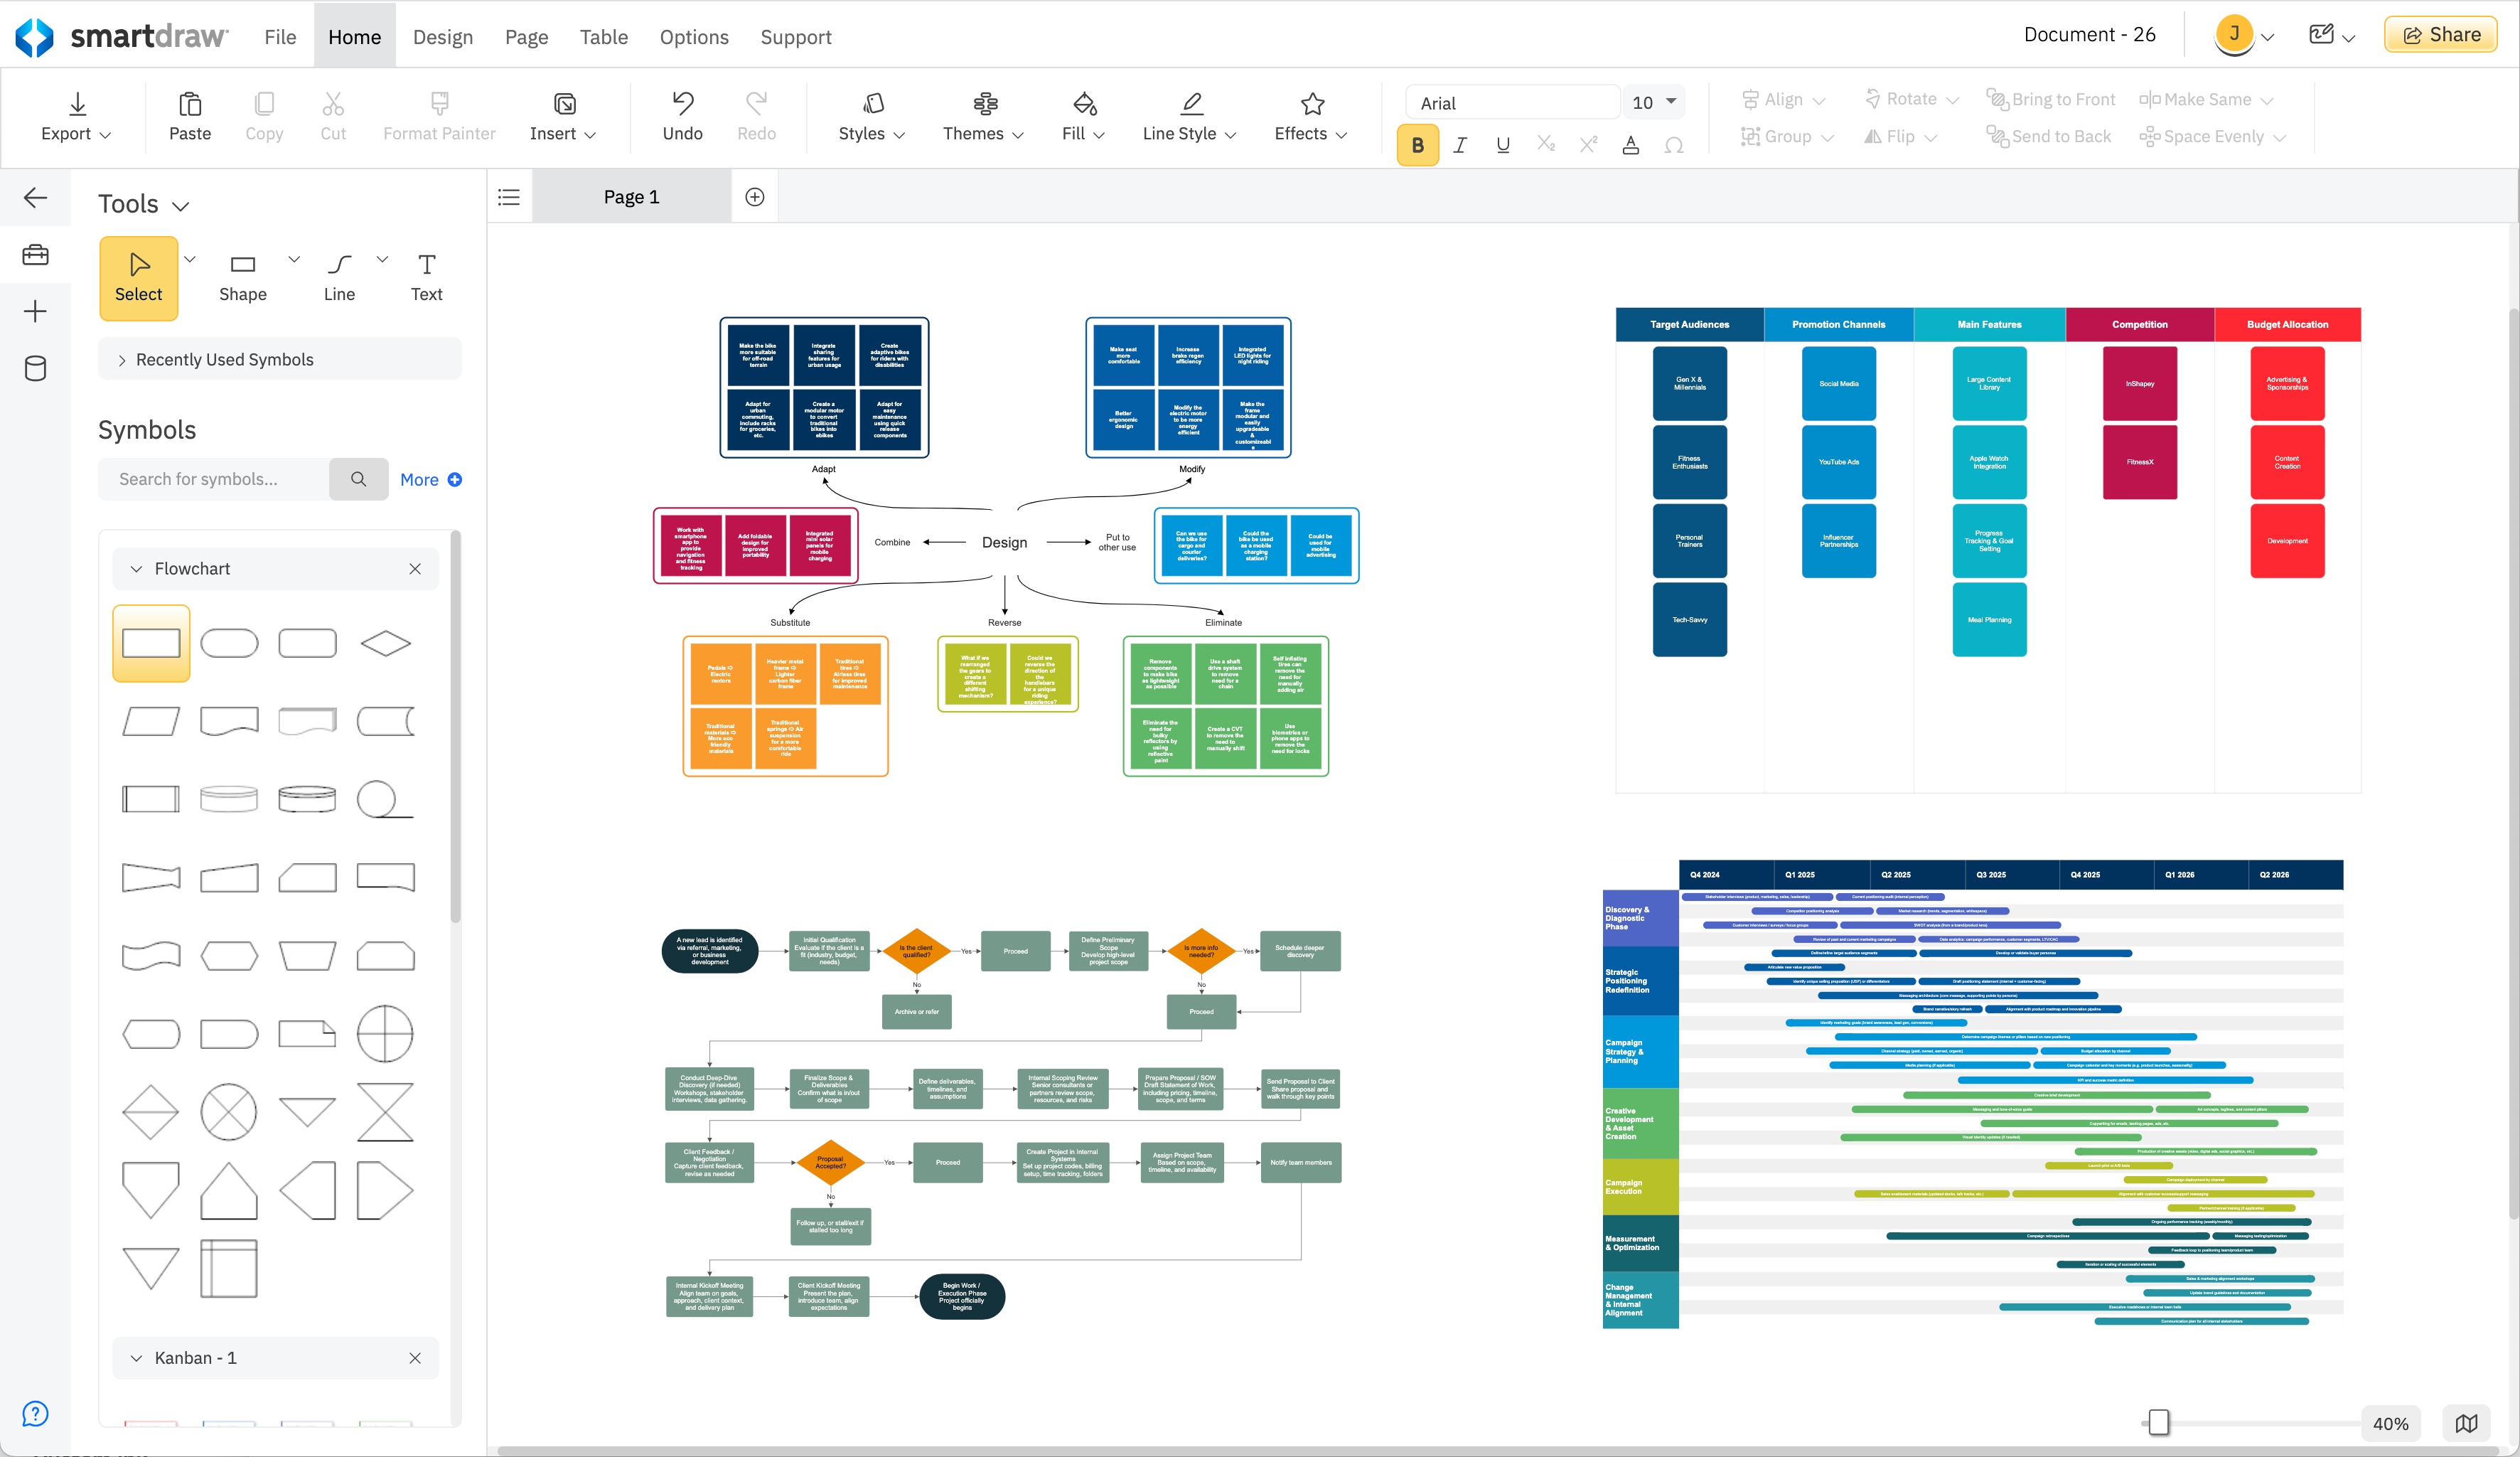
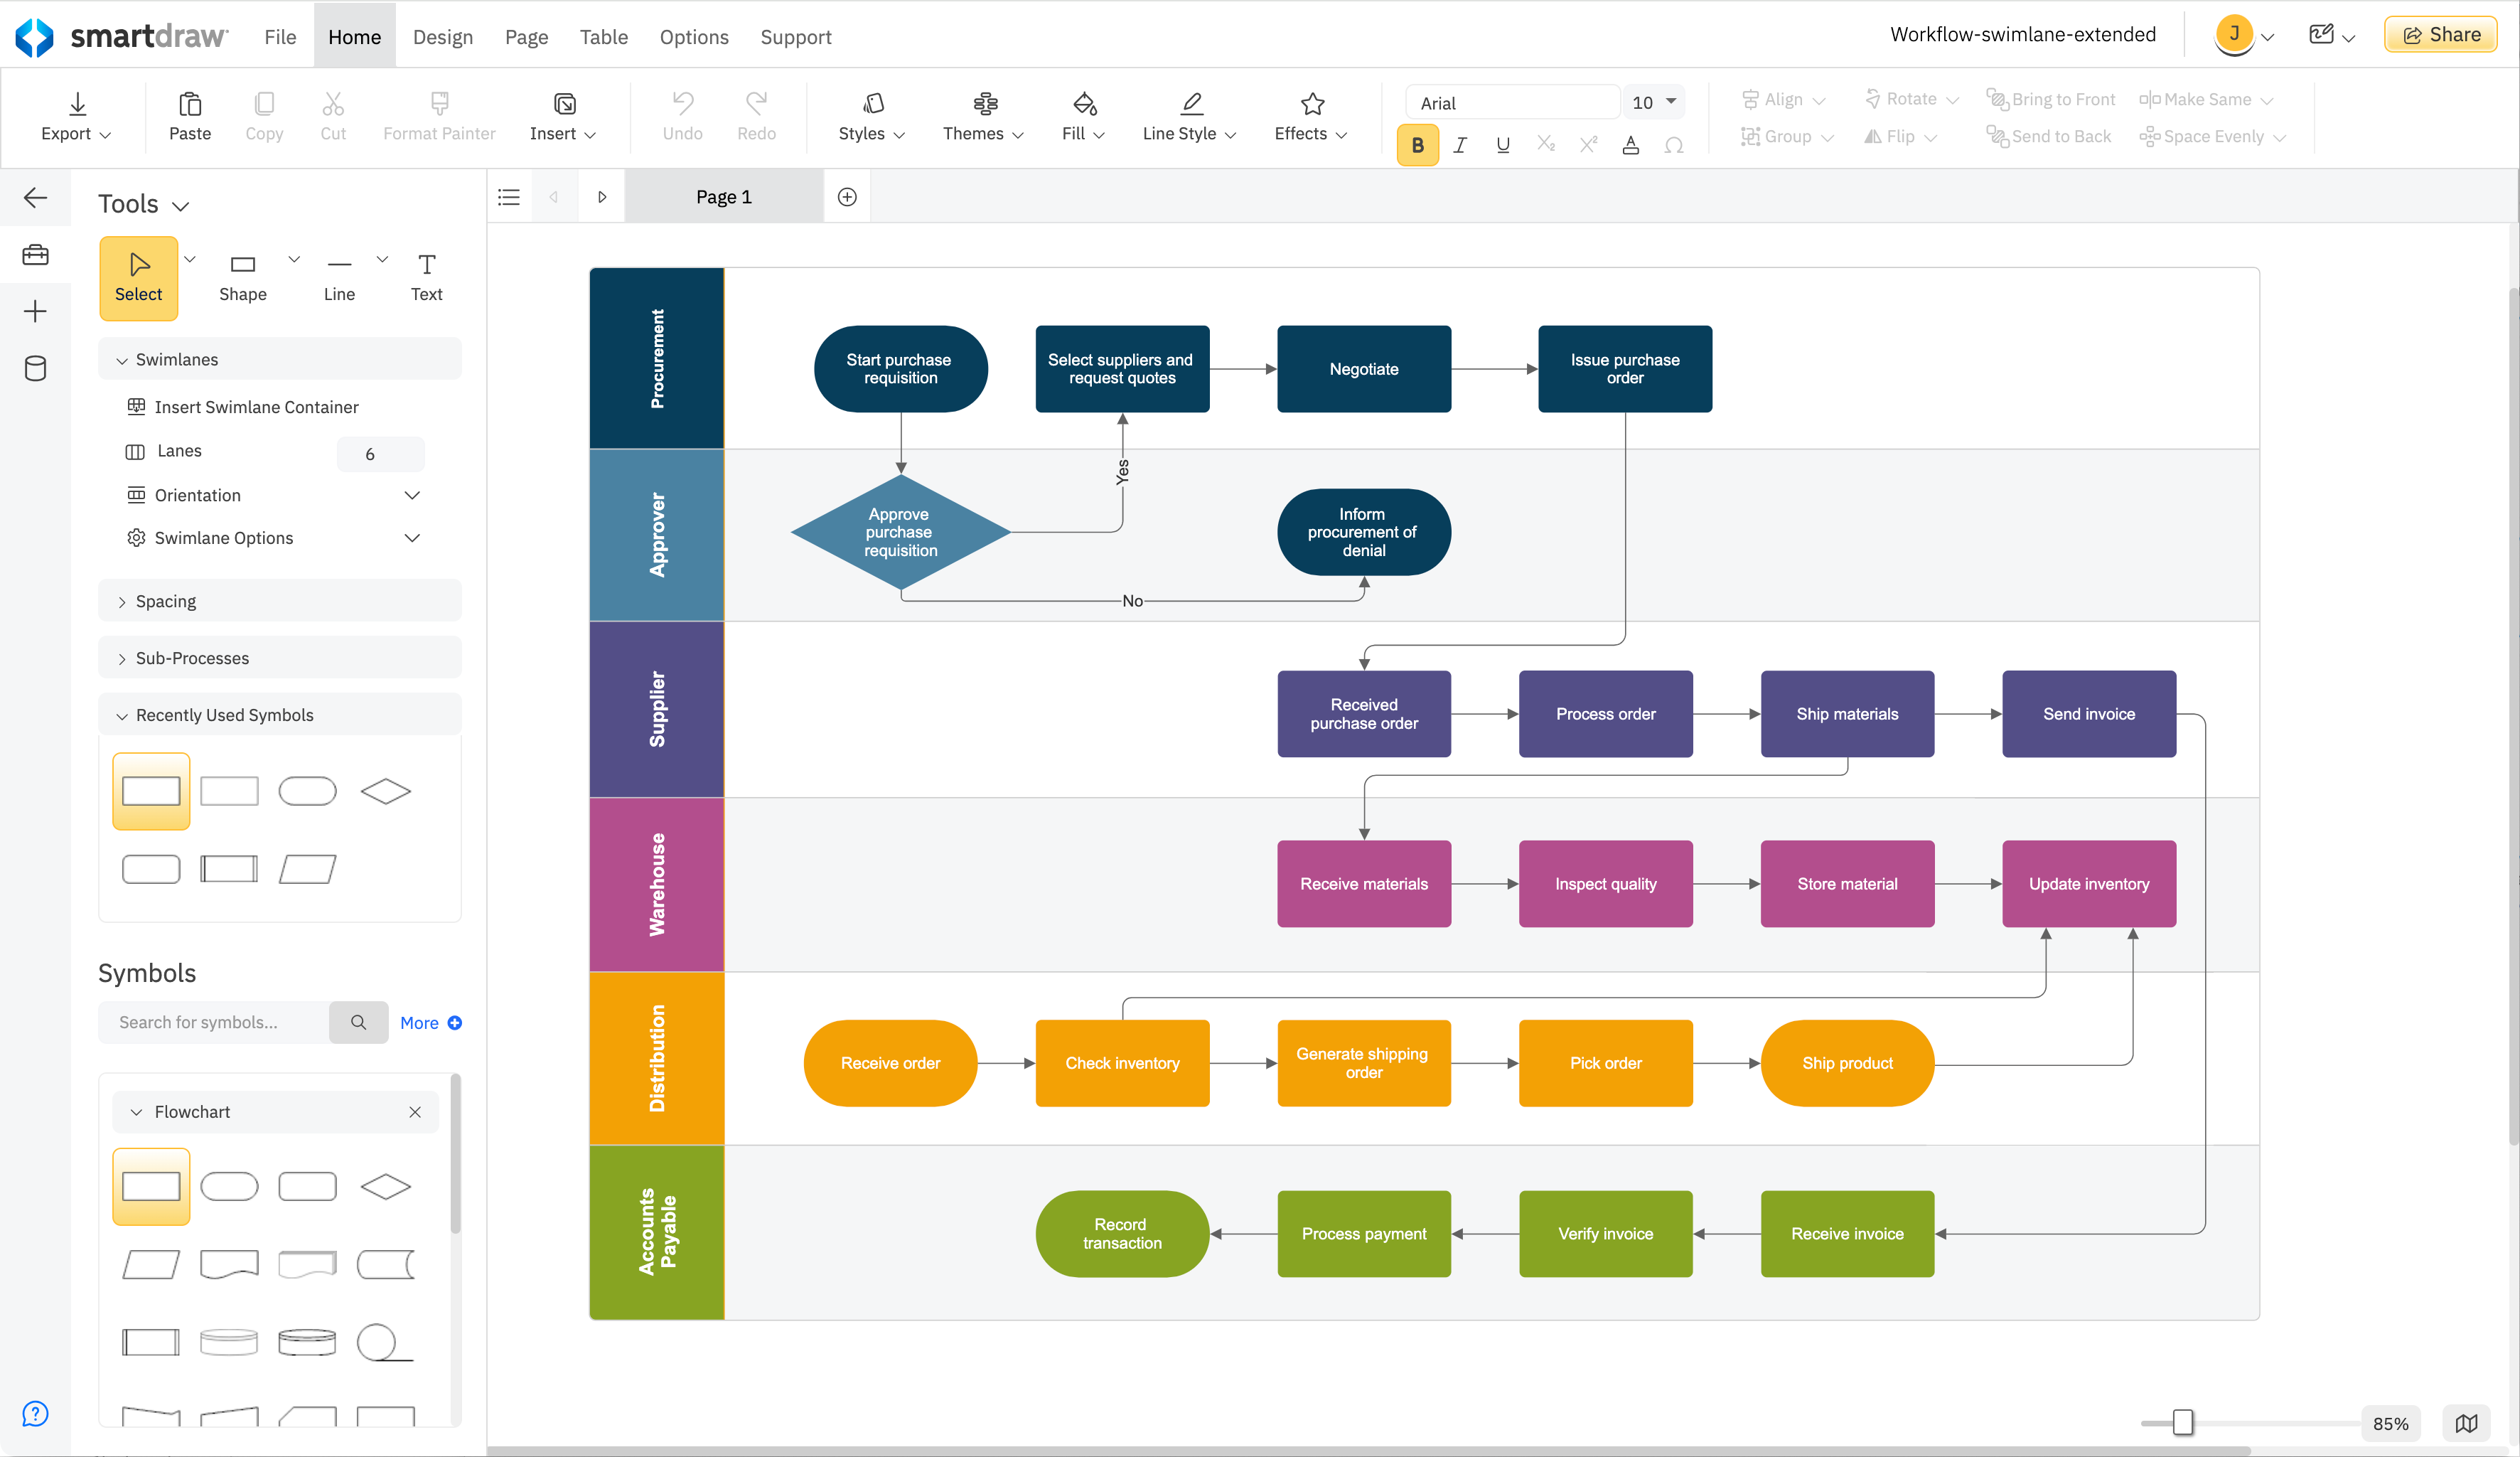
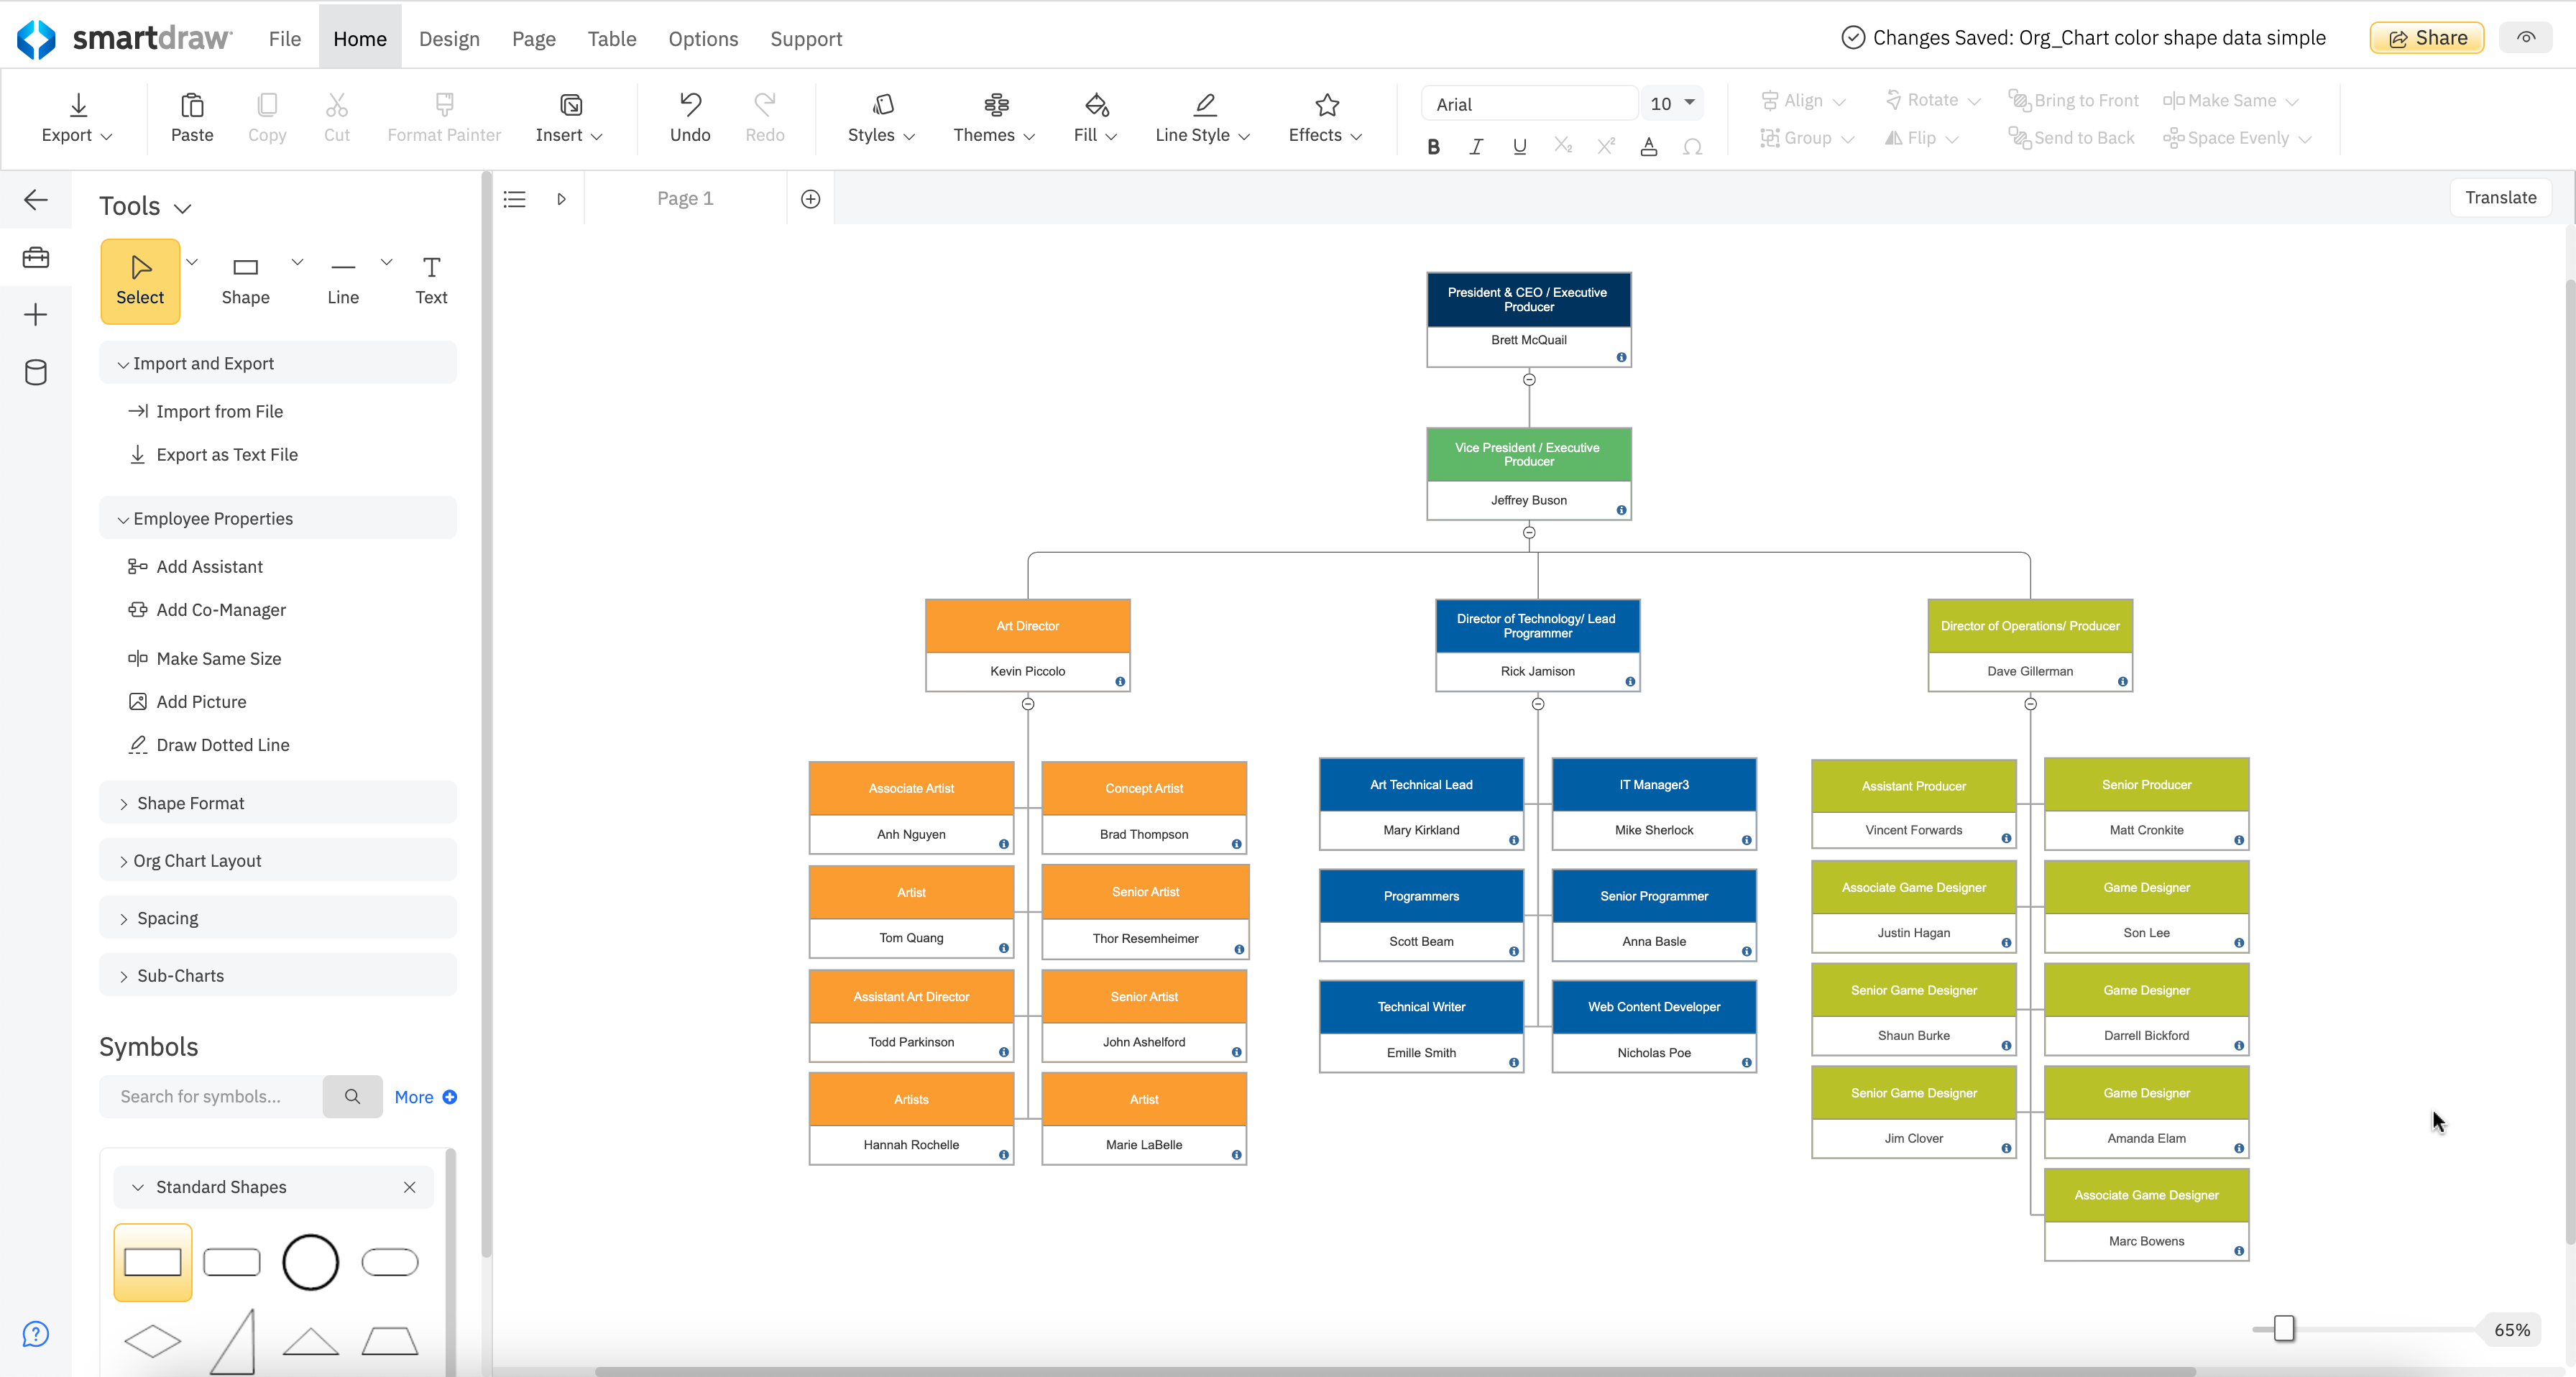
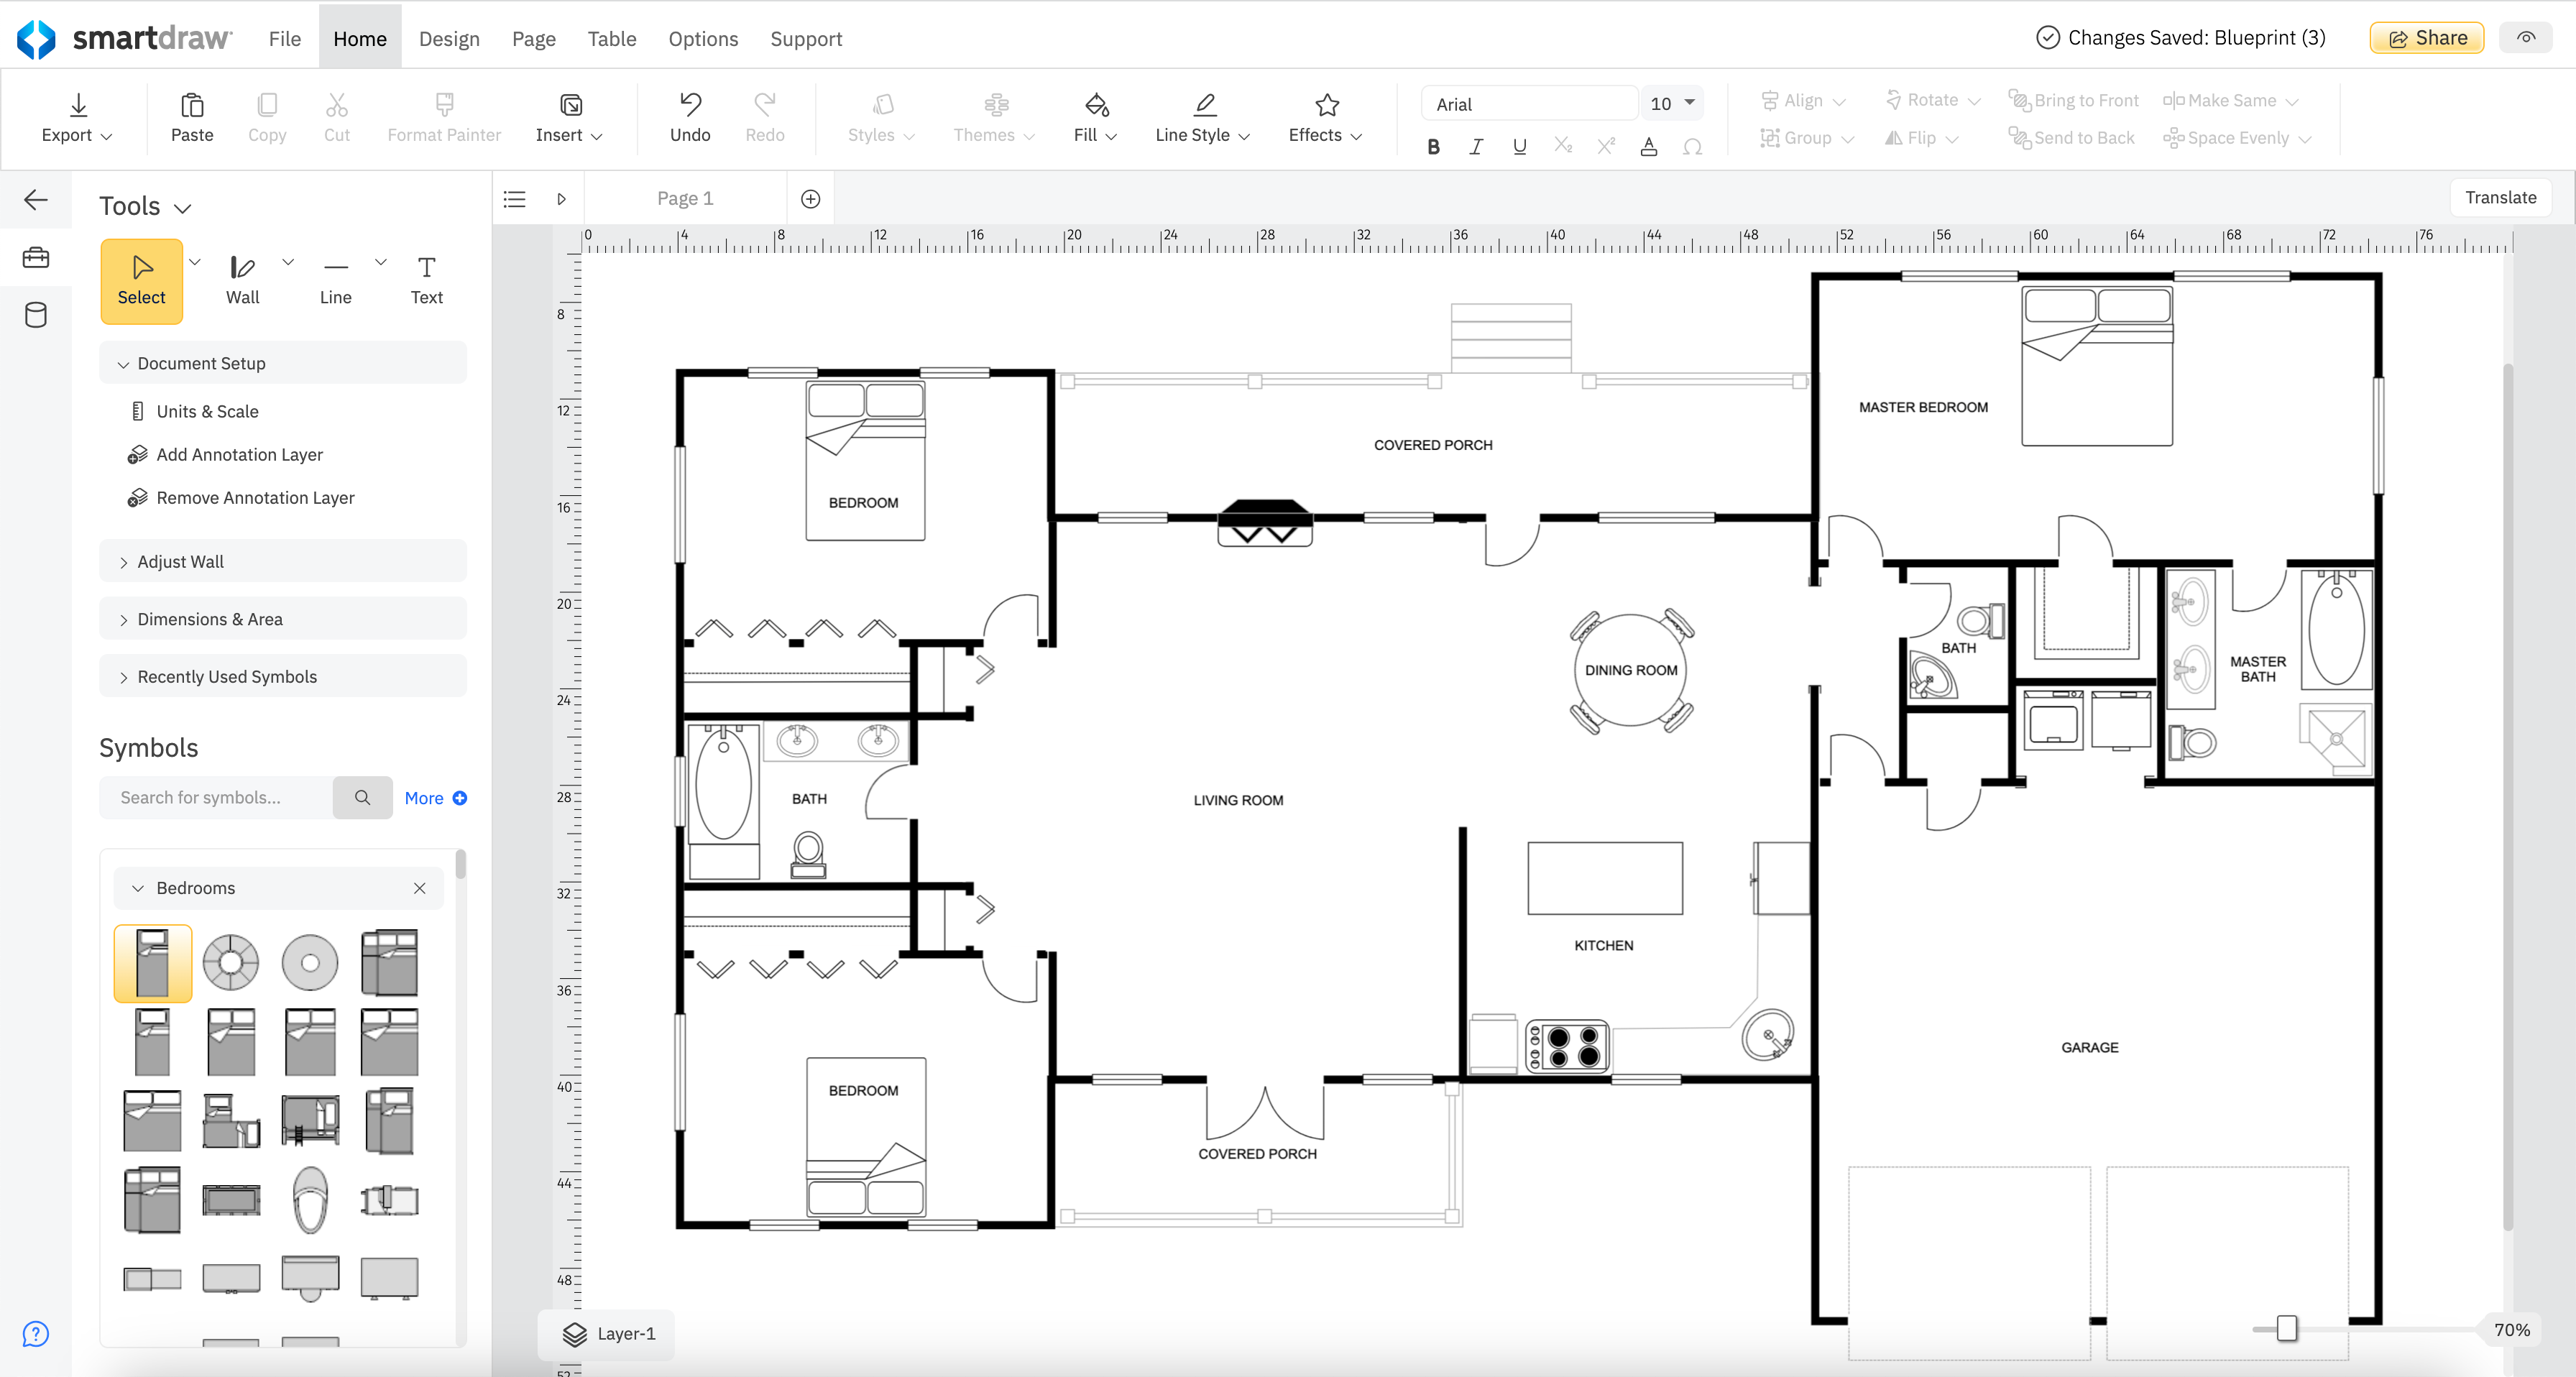
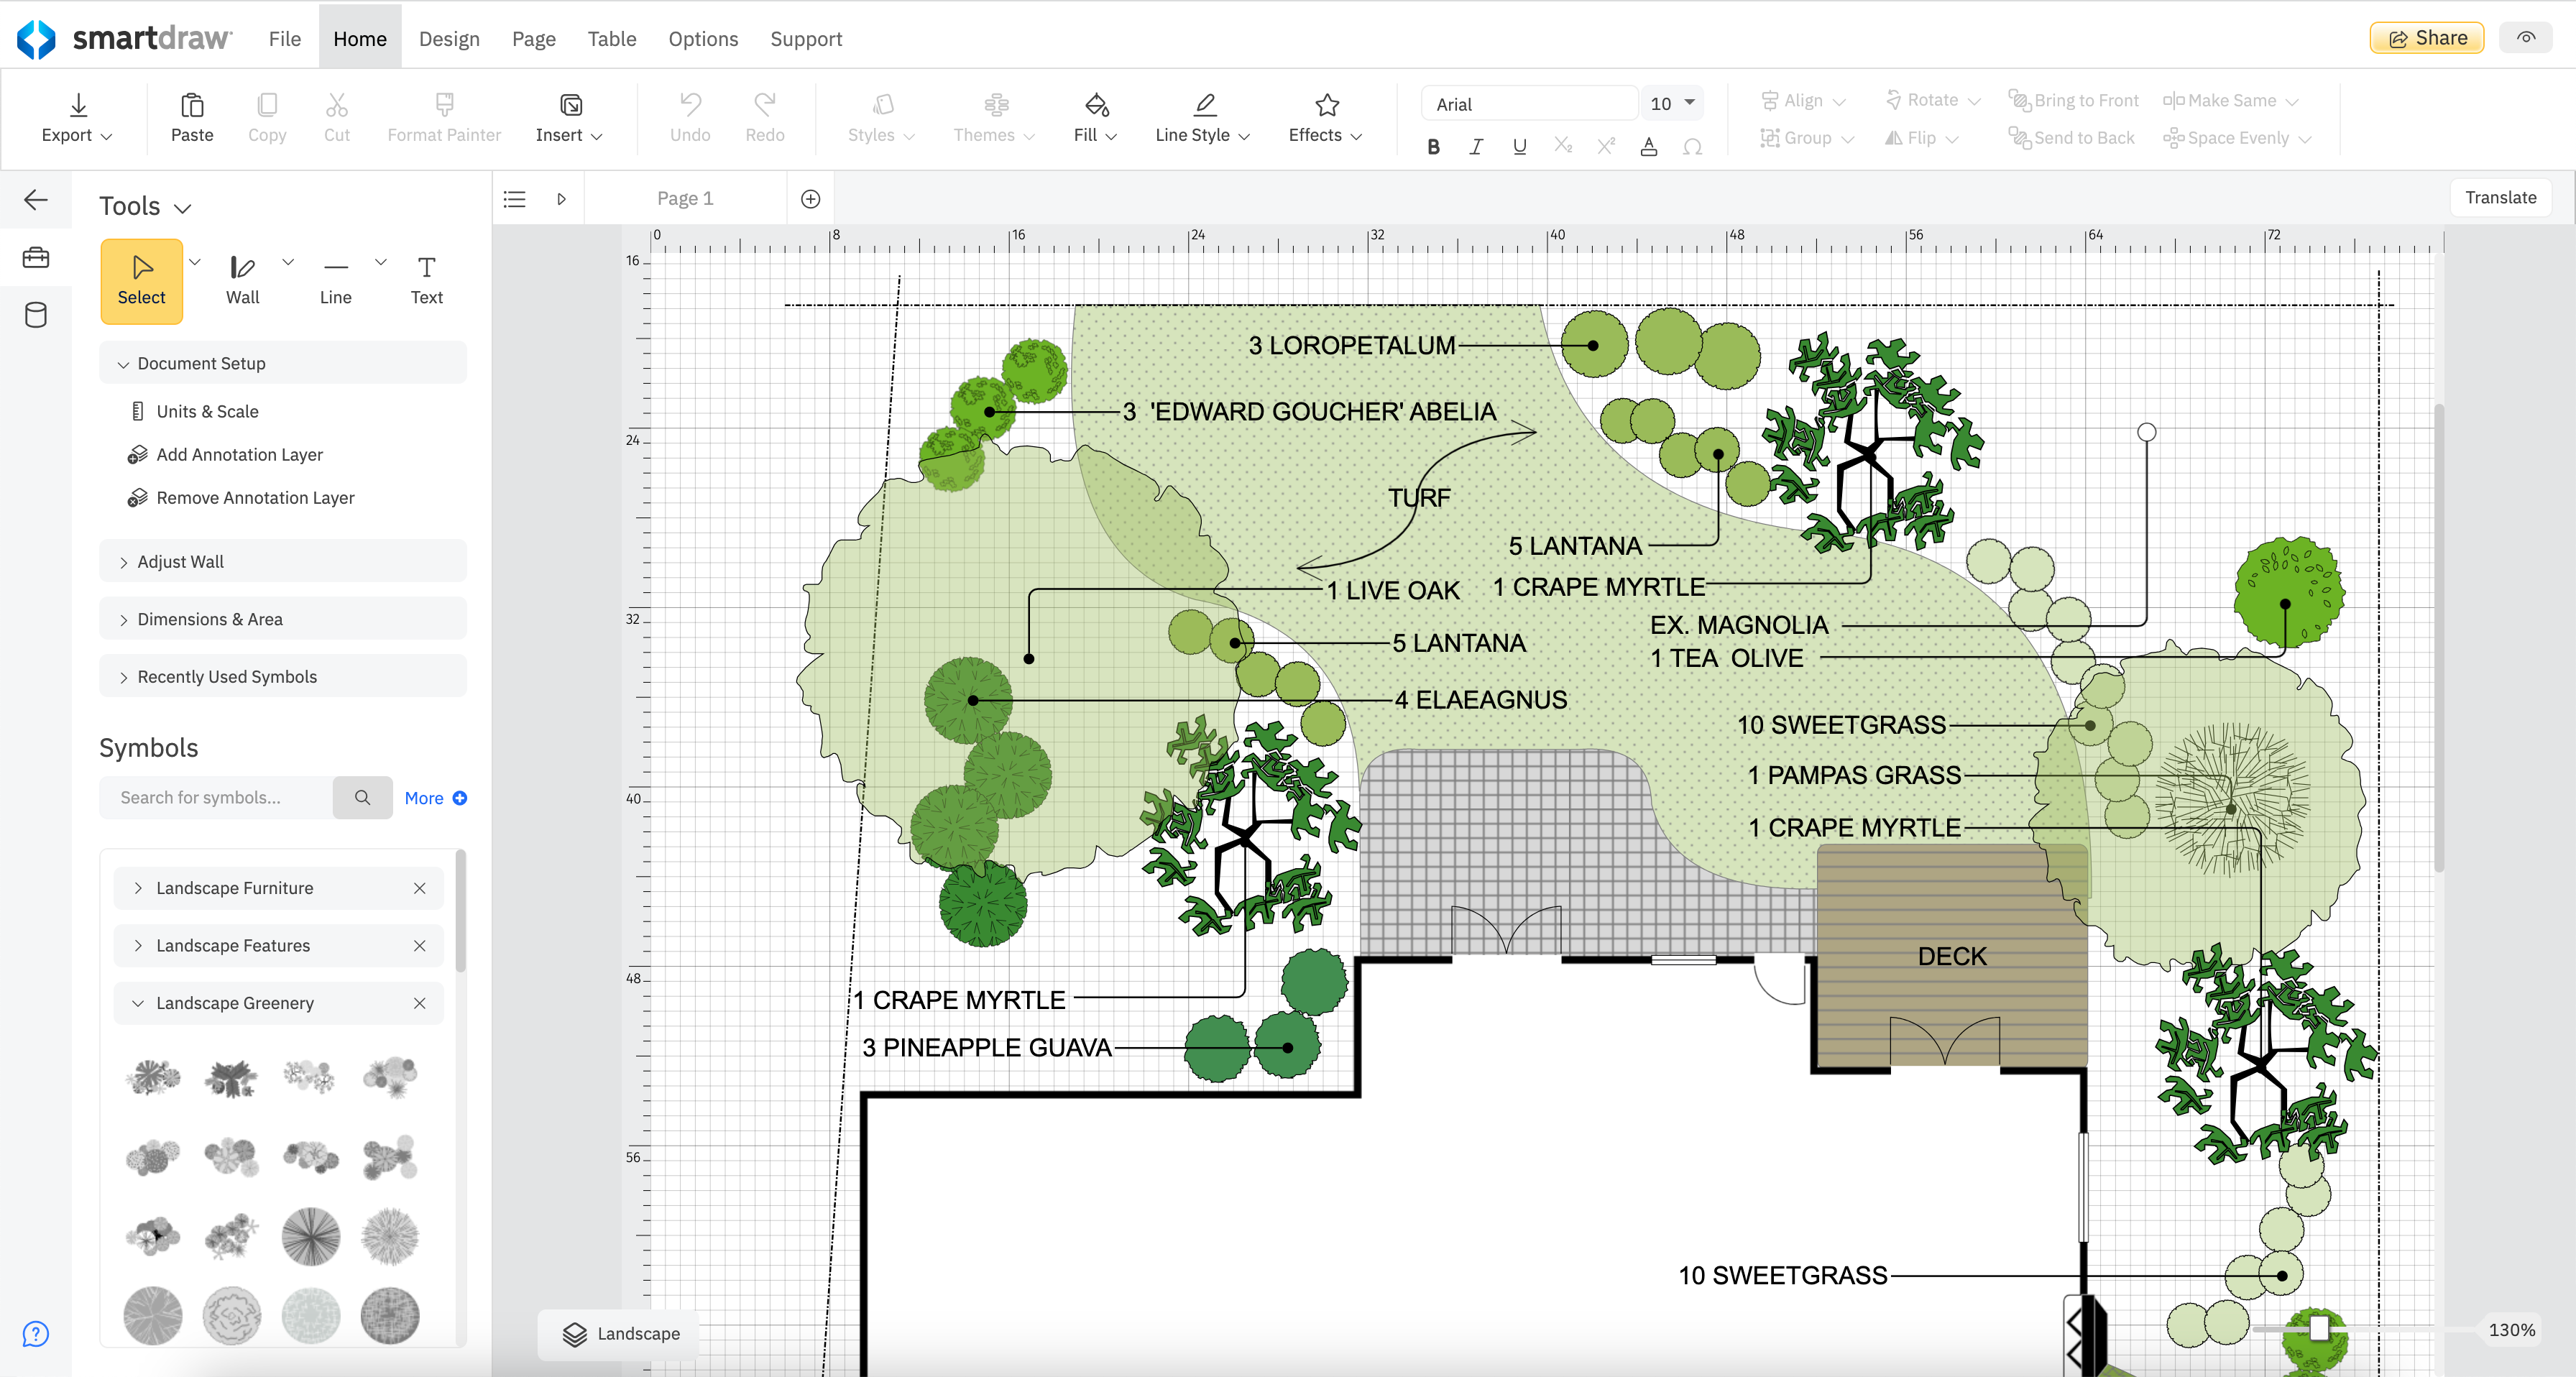
Screenshot of where to create diagrams, including: flowcharts and swimlanes, organizational charts, mind maps, CAD drawings & floor plans, project charts, network diagrams, and wireframes & mockups.Screenshot of a workspace that combines brainstorming with technical diagrams. SmartDraw can be used to visualize processes, organizations, roadmaps, and even generate diagrams from data.Screenshot of SmartDraw's templates and tools used to make flowcharts, swimlanes, and process maps.Screenshot of the org chart tool, used to document organizational structure and work as a team to plan for growth or manage change. Data can be imported to generate a chart automatically.Screenshot of the CAD drawing and floor plan tools, used to design a home or optimize office space to improve traffic flow in a retail space.Screenshot of an example of the built-in templates for landscapes, gardens, backyards used to design outdoor spaces. Users can drag-and-drop flowers, shrubs, and other plants, or add sprinkler systems, lights, and walkways, and apply photo-realistic textures for a professional finish.