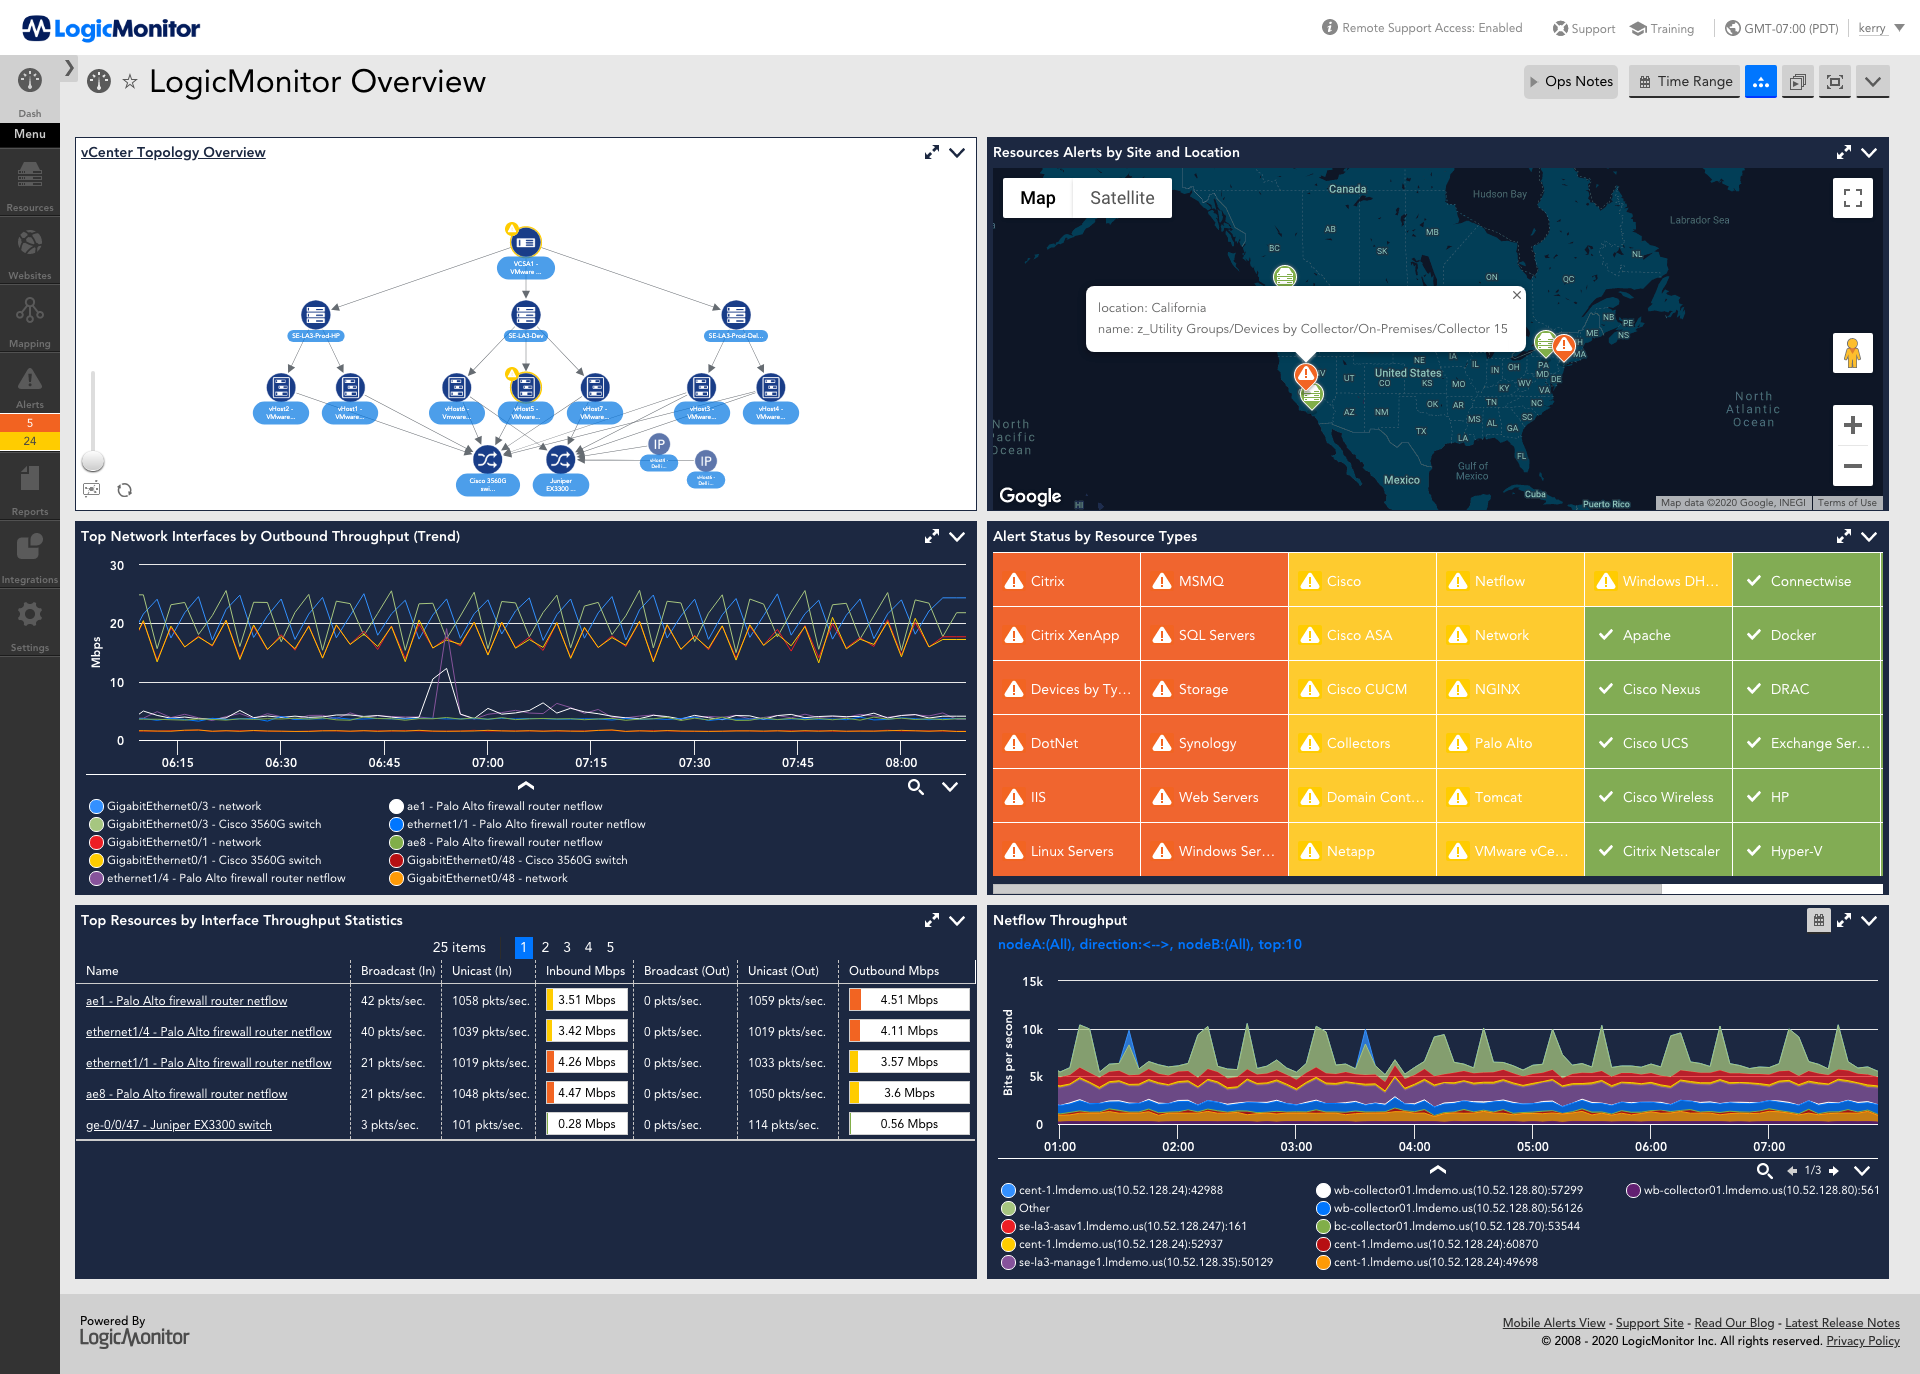
LogicMonitor’s SaaS-based platform, LM Envision, enables observability across on-prem and multi-cloud environments. It provides IT and business teams operational visibility and predictability across their technologies and applications.
N/A
SolarWinds SQL Sentry
Score9 out of 10
N/A
SolarWinds SQL Sentry is designed to help data professionals optimize SQL Server database performance
in physical, virtual, and cloud environments. SQL Sentry delivers metrics to help users find and fix database performance problems
and provides scalability, boasting demonstrated success monitoring 800+ SQL
Server instances with one monitoring database. With
SQL Sentry, the user can monitor:
SQL Server
Azure SQL
Database
SQL Server
Analysis…
$0
Free
Pricing
LogicMonitor
SolarWinds SQL Sentry
Editions & Modules
Enterprise
Contact sales team
Website Monitoring
Contact sales team
Plan Explorer (SQL Server Query Tuning)
$0
Free
SQL Sentry for Azure SQL Database
$161
Per year per database (annual subscription)
SQL Sentry
1,450
Per year per instance (annual subscription)
Offerings
Pricing Offerings
LogicMonitor
SolarWinds SQL Sentry
Free Trial
Yes
Yes
Free/Freemium Version
No
No
Premium Consulting/Integration Services
Yes
Yes
Entry-level Setup Fee
No setup fee
No setup fee
Additional Details
Our platform is broken down into Pro and Enterprise Pricing. Pro includes monitoring for all of your cloud, hybrid, and on-premises infrastructure. Our Enterprise package includes all of this, plus our AIOps and Machine Learning functionality that provides dynamic thresholds, root cause analysis, anomaly detection and more!
LogicMonitor only charges by the device. What is considered a device? A device is anything with an IP address that you want to monitor, including a physical device or a cloud resource. This means multiple data sources under the same IP address can be monitored for the same price. Unlike some monitoring platforms. we don’t charge per node, interface, or metric.
DBA Manager in Information Technology at DealerSocket (Automotive, 1001-5000 employees)
Chose LogicMonitor
For being a product that can monitor a wide variety of resource types it is a strong tool. It just breaks down against some of the more in depth database monitoring tools that we need in the DBA team. We need more detail tracking on SPIDs and query level analysis and this is …
A de minimis incentive was given to thank the reviewer for their time. The incentive was not used to bias or drive a particular response, nor was the incentive contingent on a positive endorsement. More Info
The example I will give will explain my rating for it. One employee left our company due to a personal issue, and at that time, our team was working on a highly secure project. He wanted to take revenge on our company, so he began hacking our systems from the outside. Since it appears that someone without authorization is attempting to access our systems, LogicMonitor simultaneously alerted our team to the problem. We stopped that threat with LogicMonitor.
A de minimis incentive was given to thank the reviewer for their time. The incentive was not used to bias or drive a particular response, nor was the incentive contingent on a positive endorsement. More Info
This solution is perfect for a team with a large server count and, at least, moderate experience supporting a SQL Server environment. If the environment is smaller or the team has less experience working with SQL Server performance tuning methodologies, then the tool may be overwhelming for the users.
A de minimis incentive was given to thank the reviewer for their time. The incentive was not used to bias or drive a particular response, nor was the incentive contingent on a positive endorsement. More Info
A de minimis incentive was given to thank the reviewer for their time. The incentive was not used to bias or drive a particular response, nor was the incentive contingent on a positive endorsement. TR verified that a representative sample of customers was invited. More Info
The Top SQL functionality has been extremely useful for identifying poorly performing queries by resource consumption.
The flexibility of creating your own Advisory Conditions has allowed us to integrate our custom internal alerts into a centralized dashboard and alerting platform.
Being able to highlight any chart on the dashboard and then tool-matching that window across all the other charts makes it much easier to correlate the different performance metrics against each other.
A de minimis incentive was given to thank the reviewer for their time. The incentive was not used to bias or drive a particular response, nor was the incentive contingent on a positive endorsement. More Info
A de minimis incentive was given to thank the reviewer for their time. The incentive was not used to bias or drive a particular response, nor was the incentive contingent on a positive endorsement. More Info
Tuning advice: With all the graphs and data available, it's not always easy to determine the best thing to do. I'd like to see SentryOne provide some best practice analysis based on the historical information collected for the server being looked at.
They could add help tips or links to help documents, when you select a graph on the dashboard. Inexperienced users tend to put blinders on and focus on one thing when they see a high counter or something out of the ordinary. It would be very useful to include a link that provides underlying help. The link would provide an explanation of the counter in detail and offer possible explanations as to why the counter is off.
This product has met virtually all of our needs. It was easy to implement and has been simple to support. Customization has been intuitive with many options available. They keep adding features and expanding available options. The future of LogicMonitor looks even better than it is today which is very promising. The management and support teams at LogicMonitor are always helpful
A de minimis incentive was given to thank the reviewer for their time. The incentive was not used to bias or drive a particular response, nor was the incentive contingent on a positive endorsement. More Info
Absolutely. SQL Sentry is an absolute must have for any company with a SQL Server estate. It provides a force multiplier to effectively manage SQL Server, and the feature sets are second to none. The support and expertise at SentryOne is incredible. They are very supportive of both the platform users and helping your business with the product
A de minimis incentive was given to thank the reviewer for their time. The incentive was not used to bias or drive a particular response, nor was the incentive contingent on a positive endorsement. More Info
Set up is super easy. Just stand up a small Linux or Windows server to act as a collector. There are no agents to install on monitored devices and all you need is SNMP or WMI access. When creating dashboards, all you have to do is find the widget on the device you want to show up and choose the menu option to add it.
A de minimis incentive was given to thank the reviewer for their time. The incentive was not used to bias or drive a particular response, nor was the incentive contingent on a positive endorsement. More Info
I accept that the flexibility of the alerting comes at a price. Other than the alerting SQL Sentry's interface is intuitive. Connecting to a new SQL instance, given that all the needed ports are open in your firewalls is straight forward. Reviewing the performance and queries for an instance is available in with a right click. As you dig in new tabs are created to present the detailed data. I find the ability to filter and rollup metrics on a query very helpful in dealing with the "it's running slow". You can easily compare the metrics of run times for the same query to let the user know, it's probably data your doing a billion reads instead of the usual 100 thousand.
A de minimis incentive was given to thank the reviewer for their time. The incentive was not used to bias or drive a particular response, nor was the incentive contingent on a positive endorsement. TR verified that a representative sample of customers was invited. More Info
The system is working perfectly in capturing data, but we do experience issues with SQL Timeout when viewing results in the remote clients. This may be due to the fact that our monitoring service is consuming most of the CPU, and it is the same server that is hosting the SQL Repository. We could probably fix the issue by separating the SQL instance from the monitoring service.
A de minimis incentive was given to thank the reviewer for their time. The incentive was not used to bias or drive a particular response, nor was the incentive contingent on a positive endorsement. More Info
In most cases the pages load very quickly. In our particular case, we need to do some movement of services to separate our monitoring service to separate infrastructure from the repository. When we first started with SQL Sentry on 5 licenses, we did not have any issues. Since we have now grown that to 25, we are experiencing some challenges. We do not believe this to be a tool problem
A de minimis incentive was given to thank the reviewer for their time. The incentive was not used to bias or drive a particular response, nor was the incentive contingent on a positive endorsement. More Info
The sales team support we received was top notch. They worked hand in hand to make sure the product met all expectations. So far we have not really had to work with support that much; we have worked with setup team after purchase to deploy product fully. No issues so far and we are four weeks in.
A de minimis incentive was given to thank the reviewer for their time. The incentive was not used to bias or drive a particular response, nor was the incentive contingent on a positive endorsement. More Info
From their infancy as a smaller company to now as a global player they have always kept focus on prioritising he customer. They know their product and the technology it supports and are easily accessible for both resolving problems with the product all the way to adding value through additional training and assisting with getting return on investment through utilisation of the many features the product provides.
A de minimis incentive was given to thank the reviewer for their time. The incentive was not used to bias or drive a particular response, nor was the incentive contingent on a positive endorsement. TR verified that a representative sample of customers was invited. More Info
A de minimis incentive was given to thank the reviewer for their time. The incentive was not used to bias or drive a particular response, nor was the incentive contingent on a positive endorsement. More Info
A de minimis incentive was given to thank the reviewer for their time. The incentive was not used to bias or drive a particular response, nor was the incentive contingent on a positive endorsement. TR verified that a representative sample of customers was invited. More Info
A de minimis incentive was given to thank the reviewer for their time. The incentive was not used to bias or drive a particular response, nor was the incentive contingent on a positive endorsement. More Info
I did not truly dedicate myself to implementing LogicMonitor. However, I overheard the IT team members explain that "LogicMonitor is perfect for us as it has made most of the work automated, and implementation and training sessions were perfect for us." Thus, I can state that everything went smoothly with our implementation.
A de minimis incentive was given to thank the reviewer for their time. The incentive was not used to bias or drive a particular response, nor was the incentive contingent on a positive endorsement. TR verified that a representative sample of customers was invited. More Info
Was suggested that we install the process monitors on a dev or qa database server, but we found it more useful to create an IT db server and put it there (along with a few other apps that we use for monitoring).
A de minimis incentive was given to thank the reviewer for their time. The incentive was not used to bias or drive a particular response, nor was the incentive contingent on a positive endorsement. More Info
Basically, we did not have any idea about it and how to choose, but we asked one of our former bosses, as they were very experienced with it, so they helped us by clarifying a few things between New Relic and LogicMonitor, as they told us that if you are looking for an automated option, then there is no better option than LogicMonitor.
A de minimis incentive was given to thank the reviewer for their time. The incentive was not used to bias or drive a particular response, nor was the incentive contingent on a positive endorsement. TR verified that a representative sample of customers was invited. More Info
SQL Sentry offers more features and is customize-able to fit our business needs. It has more centralized management and support. The company's technical support is also top notch. It is also worth mentioning that SentryOne Team Blog is an excellent source. One can find lots of valuable troubleshooting skills on the blog site - very educational and informational.
A de minimis incentive was given to thank the reviewer for their time. The incentive was not used to bias or drive a particular response, nor was the incentive contingent on a positive endorsement. More Info
Pricing seems to be getting more and more aggressive, I worry that it's going to turn into ServiceNow or SAP and everything minor feature will be an extreme cost that prices out us and our customers
A de minimis incentive was given to thank the reviewer for their time. The incentive was not used to bias or drive a particular response, nor was the incentive contingent on a positive endorsement. More Info
We are running 25 instances through a single monitoring service and it is able to keep up. We are finding that this many instances in our environment is about as many as can be handled. We will need to deploy additional monitoring services. Luckily, there is no additional licensing costs to deploy additional monitoring services. For us, it's just an additional Azure VM.
A de minimis incentive was given to thank the reviewer for their time. The incentive was not used to bias or drive a particular response, nor was the incentive contingent on a positive endorsement. More Info
Haven't really used it but our initial onboarding PS was disappointing. Felt like we were being told what we needed to cover as opposed to what we wanted to cover. In addition, we were pushed into using the PS in tight time frames and we were not ready to do so.
A de minimis incentive was given to thank the reviewer for their time. The incentive was not used to bias or drive a particular response, nor was the incentive contingent on a positive endorsement. More Info
A de minimis incentive was given to thank the reviewer for their time. The incentive was not used to bias or drive a particular response, nor was the incentive contingent on a positive endorsement. TR verified that a representative sample of customers was invited. More Info
Better customer service as it alerts me automatically to loss of service issues so I can react and either get things fixed before it impacts the customers or to let my management know as soon as possible
It helps me find expensive SQL so our customers get better performance and we make better use of our resources
A de minimis incentive was given to thank the reviewer for their time. The incentive was not used to bias or drive a particular response, nor was the incentive contingent on a positive endorsement. More Info