
IDERA SQL Diagnostic Manager for MySQL vs. SolarWinds Database Performance Monitor
IDERA SQL Diagnostic Manager for MySQL vs. SolarWinds Database Performance Monitor
| Product | Rating | Most Used By | Product Summary | Starting Price |
|---|---|---|---|---|
 IDERA SQL Diagnostic Manager for MySQL | N/A | A customizable MySQL monitoring tool that helps database administrators identify and solve performance issues. Monyog takes the repetitive work out of performance monitoring without overloading servers. IDERA presents Monyog as a single tool to monitor MySQL performance across physical, virtual, and cloud environments. Monyog does not limit its use to MySQL servers. Monyog can also help identify and resolve MariaDB performance issues in real time to avoid costly server outages. To… | $399 per server per year | |
 SolarWinds Database Performance Monitor | N/A | VividCortex, acquired by SolarWinds in December 2019, provides database performance monitoring designed to increase system performance, team efficiency, and infrastructure cost savings. The GDPR- and SOC 2-compliant platform offers visibility into major open-source databases—MySQL, PostgreSQL, Amazon Aurora, MongoDB, and Redis—for the engineering team at scale. Industry leaders like Etsy, GitHub, SendGrid, and Yelp rely on Database Performance Monitor for all-query monitoring and drill… | N/A |
| IDERA SQL Diagnostic Manager for MySQL | SolarWinds Database Performance Monitor | |||||||||||||||
|---|---|---|---|---|---|---|---|---|---|---|---|---|---|---|---|---|
| Editions & Modules |
| No answers on this topic | ||||||||||||||
| Offerings |
| |||||||||||||||
| Entry-level Setup Fee | No setup fee | No setup fee | ||||||||||||||
| Additional Details | Maintenance includes access to technical support and product updates for the defined period of the agreement. | — | ||||||||||||||
| More Pricing Information | ||||||||||||||||
| IDERA SQL Diagnostic Manager for MySQL | SolarWinds Database Performance Monitor |
|---|
| IDERA SQL Diagnostic Manager for MySQL | SolarWinds Database Performance Monitor | |
|---|---|---|
| Small Businesses | No answers on this topic | No answers on this topic |
| Medium-sized Companies |  LogicMonitor Score 8.4 out of 10 | LogicMonitor Score 8.4 out of 10 |
| Enterprises | LogicMonitor Score 8.4 out of 10 | LogicMonitor Score 8.4 out of 10 |
| All Alternatives | View all alternatives | View all alternatives |
| IDERA SQL Diagnostic Manager for MySQL | SolarWinds Database Performance Monitor | |
|---|---|---|
| Likelihood to Recommend | 10.0 (0 ratings) | 8.0 (0 ratings) |
| IDERA SQL Diagnostic Manager for MySQL | SolarWinds Database Performance Monitor | |
|---|---|---|
| Likelihood to Recommend |  No answers on this topic | 
 Mike Maner Network Systems Engineer |
| Pros | No answers on this topic |
Mike Maner Network Systems Engineer |
| Cons | No answers on this topic |
Mike Maner Network Systems Engineer |
| Alternatives Considered | No answers on this topic |
Mike Maner Network Systems Engineer |
| Return on Investment | No answers on this topic |
Mike Maner Network Systems Engineer |
| ScreenShots | IDERA SQL Diagnostic Manager for MySQL Screenshots    | SolarWinds Database Performance Monitor Screenshots  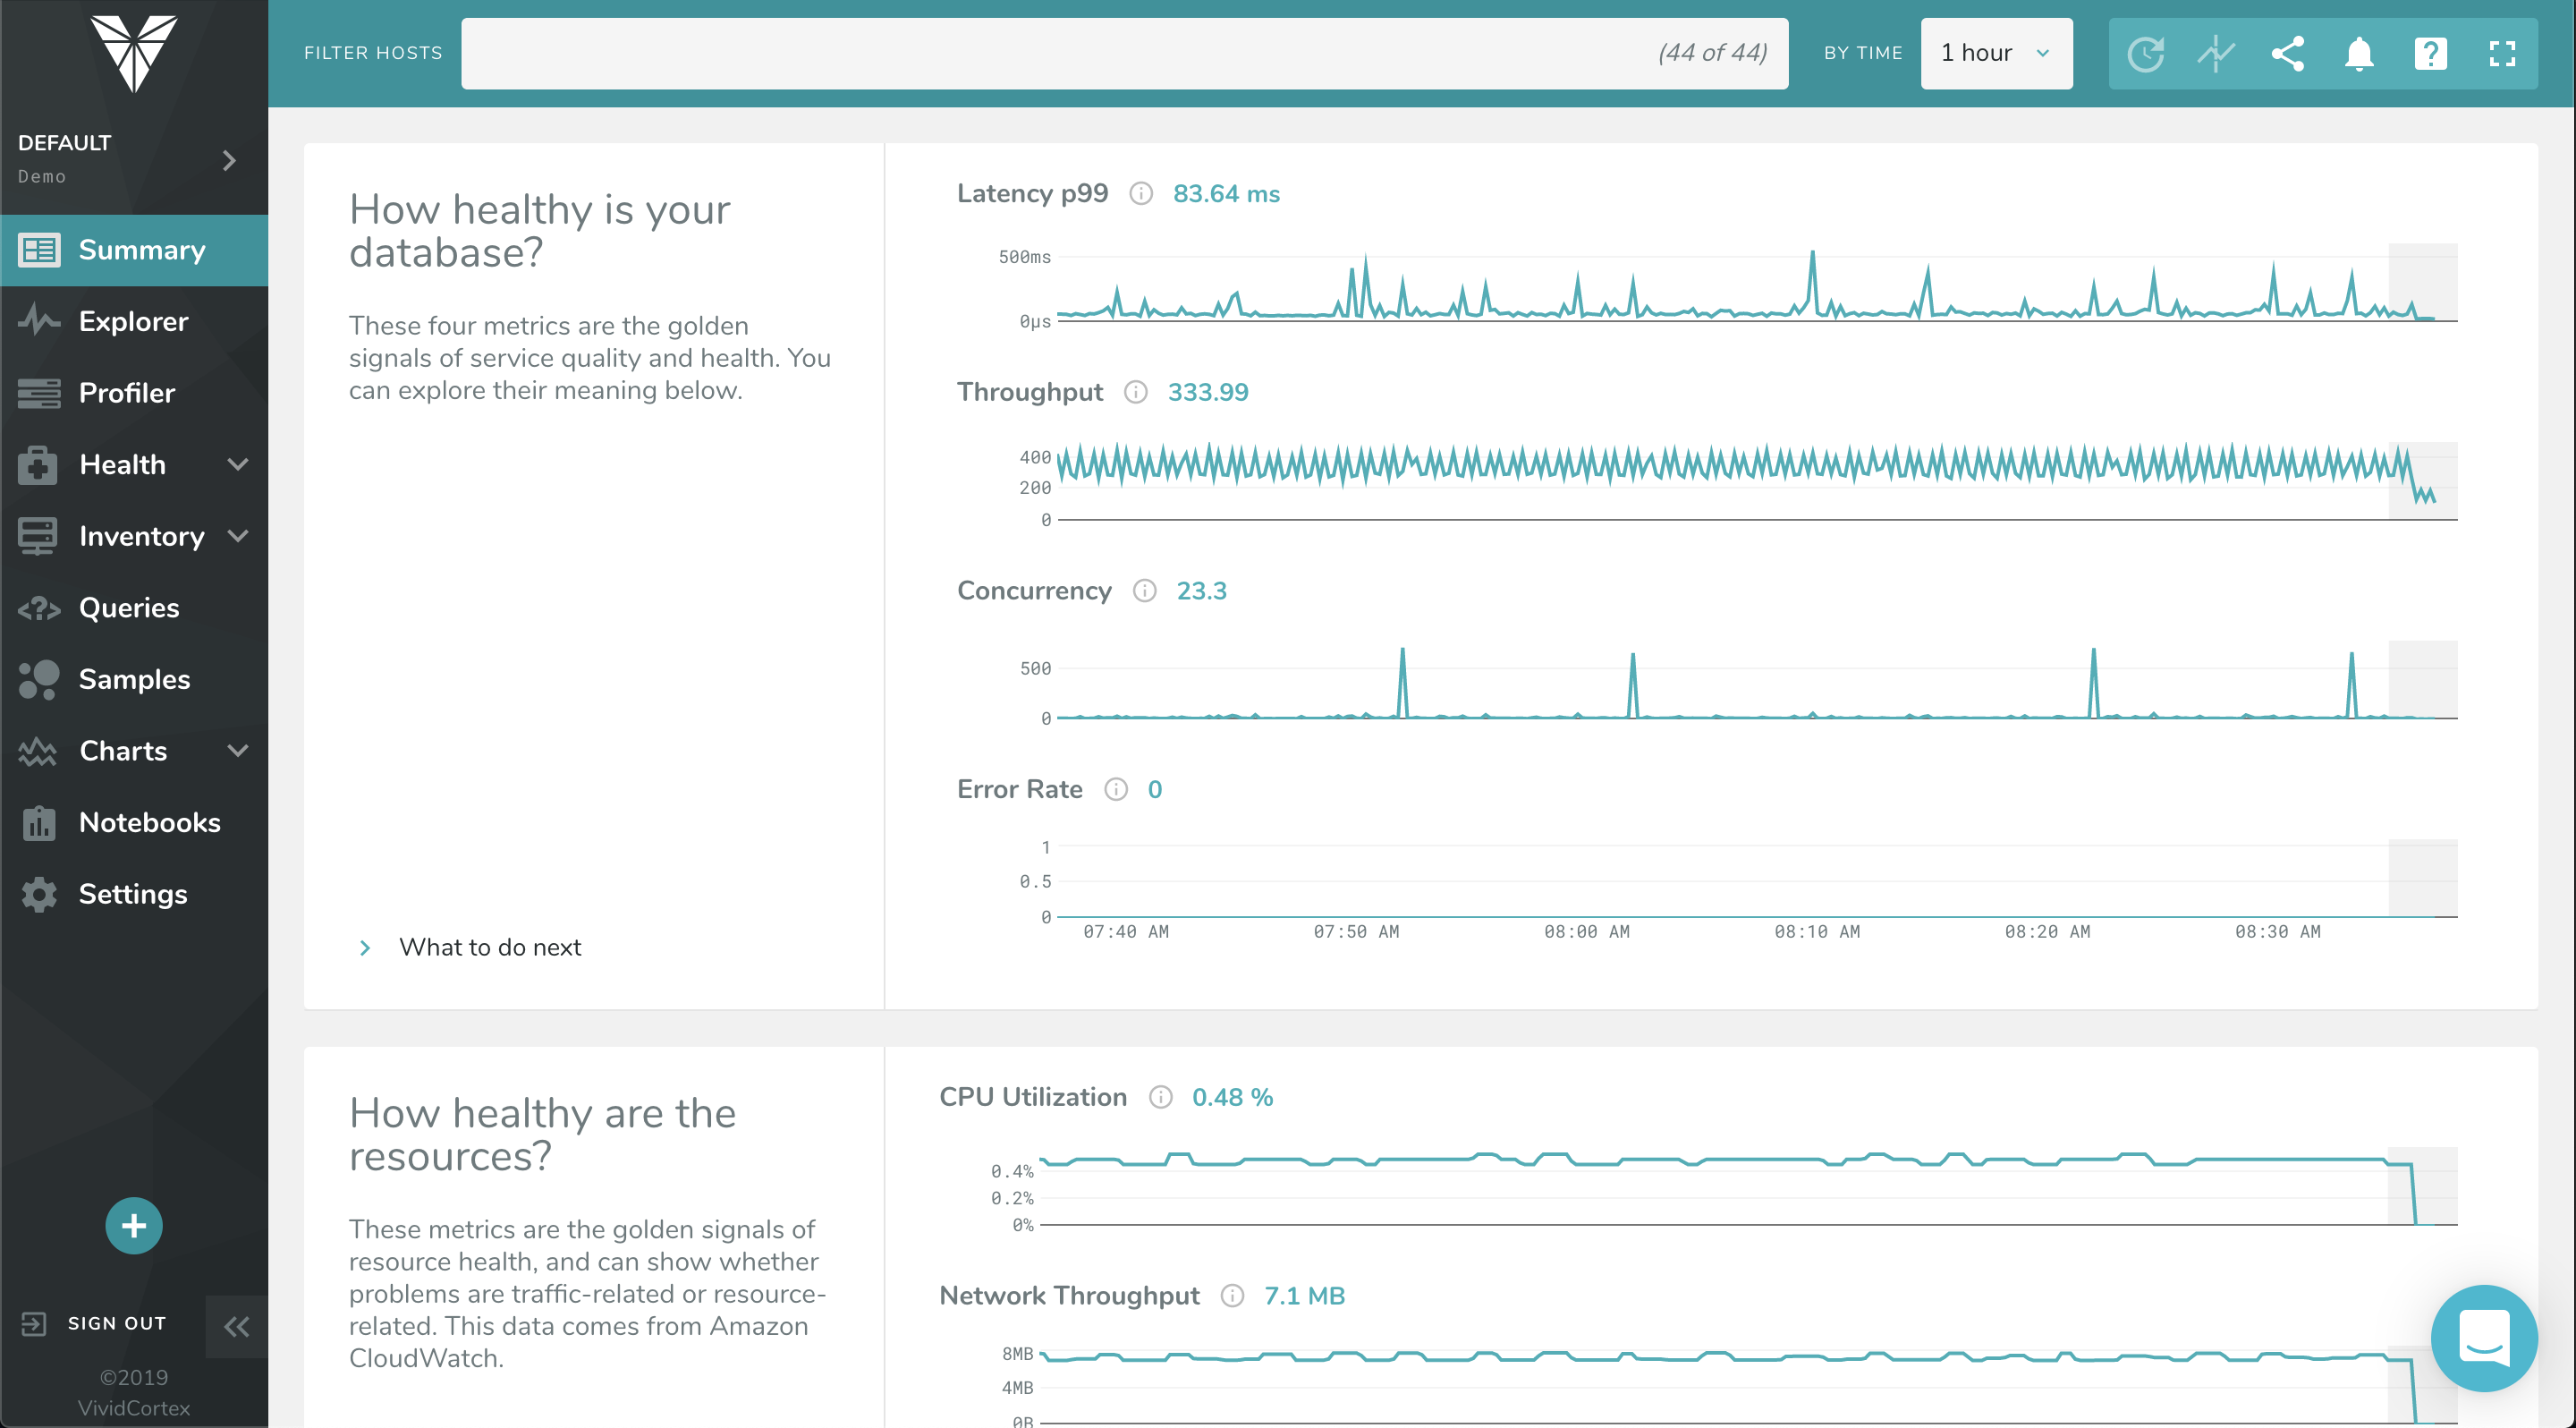  |