iCharts vs. Qlik Sense

Overview
ProductRatingMost Used ByProduct SummaryStarting Price
iCharts
Score 8.0 out of 10
Mid-Size Companies (51-1,000 employees)
iCharts is a Business Intelligence and Analytics solution for NetSuite. With this solution, users can transform their NetSuite data into interactive, real-time analytics without leaving their NetSuite dashboard. iCharts includes drag-and-drop chart creation and best-practice templates. The vendor’s value proposition is that iCharts accelerates an organization’s analytics strategy by empowering their team with the critical data-driven tools they need.
$10,000
per installation
Qlik Sense
Score 7.4 out of 10
N/A
Qlik Sense® is a self-service BI platform for data discovery and visualization. It supports a full range of analytics use cases—data governance, pixel-perfect reporting, and collaboration. Its Associative Engine indexes and connects relationships between data points for creating actionable insights.
$200
per month
Pricing
iChartsQlik Sense
Editions & Modules
Professional
$10,000
per installation
Business
15,000
per installation
Elite
$25,000
per installation
Starter
$200
per month
Standard
$825
per month
Premium
$2,750
per month
Qlik Sense Enterprise on Windows
Contact Sales
Enterprise
Custom Quote
Offerings
Pricing Offerings
iChartsQlik Sense
Free Trial
YesNo
Free/Freemium Version
NoNo
Premium Consulting/Integration Services
YesYes
Entry-level Setup Fee$3,000 per installationNo setup fee
Additional DetailsBased on number of NetSuite licenses
More Pricing Information
Community Pulse
iChartsQlik Sense
Features
iChartsQlik Sense
BI Standard Reporting
Comparison of BI Standard Reporting features of Product A and Product B
iCharts
9.0
2 Ratings
10% above category average
Qlik Sense
8.5
312 Ratings
4% above category average
Customizable dashboards10.02 Ratings8.9310 Ratings
Report Formatting Templates8.01 Ratings8.2225 Ratings
Pixel Perfect reports00 Ratings8.3213 Ratings
Ad-hoc Reporting
Comparison of Ad-hoc Reporting features of Product A and Product B
iCharts
9.0
2 Ratings
11% above category average
Qlik Sense
8.6
323 Ratings
7% above category average
Drill-down analysis9.02 Ratings8.9319 Ratings
Report sharing and collaboration9.02 Ratings9.0296 Ratings
Formatting capabilities00 Ratings8.2312 Ratings
Integration with R or other statistical packages00 Ratings8.4152 Ratings
Report Output and Scheduling
Comparison of Report Output and Scheduling features of Product A and Product B
iCharts
10.0
1 Ratings
19% above category average
Qlik Sense
8.8
275 Ratings
6% above category average
Publish to Web10.01 Ratings8.8207 Ratings
Publish to PDF00 Ratings8.8254 Ratings
Report Versioning00 Ratings8.8174 Ratings
Report Delivery Scheduling00 Ratings8.8180 Ratings
Delivery to Remote Servers00 Ratings8.8106 Ratings
Data Discovery and Visualization
Comparison of Data Discovery and Visualization features of Product A and Product B
iCharts
8.0
1 Ratings
0% above category average
Qlik Sense
8.7
311 Ratings
9% above category average
Pre-built visualization formats (heatmaps, scatter plots etc.)8.01 Ratings8.5304 Ratings
Location Analytics / Geographic Visualization00 Ratings8.8281 Ratings
Predictive Analytics00 Ratings8.7193 Ratings
Access Control and Security
Comparison of Access Control and Security features of Product A and Product B
iCharts
8.7
2 Ratings
3% above category average
Qlik Sense
9.0
294 Ratings
6% above category average
Multi-User Support (named login)9.02 Ratings9.2273 Ratings
Role-Based Security Model8.02 Ratings9.0270 Ratings
Multiple Access Permission Levels (Create, Read, Delete)9.02 Ratings8.8272 Ratings
Single Sign-On (SSO)00 Ratings8.9216 Ratings
Mobile Capabilities
Comparison of Mobile Capabilities features of Product A and Product B
iCharts
10.0
2 Ratings
24% above category average
Qlik Sense
7.4
220 Ratings
6% below category average
Responsive Design for Web Access10.01 Ratings8.3214 Ratings
Dashboard / Report / Visualization Interactivity on Mobile10.02 Ratings8.2184 Ratings
Mobile Application00 Ratings8.2132 Ratings
Application Program Interfaces (APIs) / Embedding
Comparison of Application Program Interfaces (APIs) / Embedding features of Product A and Product B
iCharts
-
Ratings
Qlik Sense
8.6
143 Ratings
10% above category average
REST API00 Ratings8.8123 Ratings
Javascript API00 Ratings8.492 Ratings
iFrames00 Ratings8.592 Ratings
Java API00 Ratings8.669 Ratings
Themeable User Interface (UI)00 Ratings8.695 Ratings
Customizable Platform (Open Source)00 Ratings8.482 Ratings
User Ratings
iChartsQlik Sense
Likelihood to Recommend
8.0
(2 ratings)
8.5
(327 ratings)
Likelihood to Renew
-
(0 ratings)
8.4
(7 ratings)
Usability
-
(0 ratings)
8.0
(11 ratings)
Support Rating
-
(0 ratings)
7.3
(8 ratings)
In-Person Training
-
(0 ratings)
9.1
(1 ratings)
Online Training
-
(0 ratings)
9.1
(1 ratings)
Implementation Rating
-
(0 ratings)
7.3
(5 ratings)
Vendor post-sale
-
(0 ratings)
9.1
(1 ratings)
Vendor pre-sale
-
(0 ratings)
9.1
(1 ratings)
User Testimonials
iChartsQlik Sense
Likelihood to Recommend
iCharts, Inc.
The iCharts has suited our organization work as it has helped us a lot in our internal and external works. As we use iCharts for the internal team in representing the working reports and data of the business in an accurate manner. It helps in representing the presentation to the client to showcase our work and present him the data and work flow through the iCharts. As I don't found anything missing in this software.
Read full review
Qlik
Qlik Sense is a program whose purpose is to greatly improve all your operations and use of all data in an organic way. The mission will always be to increase the economic and commercial processes of the company in a short time. I recommended it for its high technology, which was Created for this area, the results are successful. We have noticed how it has increased relationships with our clients thanks to the credibility and security that we provide.
Read full review
Pros
iCharts, Inc.
  • Their new platform is easy to navigate
  • We had a dedicated support person to help set up searches and train in the use of iCharts
  • Separate Dashboards for each group
Read full review
Qlik
  • Flexibility in data recording, from the app, as well as in handling them. Allowing you to view reports quickly and effectively.
  • Easy to generate dynamic graphics according to our needs.
  • It is very easy to use, intuitive, so it does not generate costs in the learning process compared to the tool with collaborators
Read full review
Cons
iCharts, Inc.
  • The new platform has limitations on colors and sizing
  • iCharts seem to have closed its doors without notification and now we have a product with no support
Read full review
Qlik
  • Scalability is RAM limited, all data is associative and in-memory so server's RAM is directly proportional to performance
  • Limitation on advanced analytics capabilities in the form of R integration to perform complex statistical and analytical calculations
  • Can have more intuitive interface
Read full review
Likelihood to Renew
iCharts, Inc.
No answers on this topic
Qlik
Qlik Sense is a constantly improving it's software and working with its' users to make it better. They are great at keeping their users informed of progress and care about delivering a quality product
Read full review
Usability
iCharts, Inc.
No answers on this topic
Qlik
Qlik Sense has a better and easy to learn user interface compared with other analytics tool which always help us to create regular and adhoc reports within the stipulated time frame and can be easily refreshed at a scheduled time and sent to multiple stakeholders for timely update regarding the Key metrics indicator.
Read full review
Support Rating
iCharts, Inc.
No answers on this topic
Qlik
Not only can you ask the support team for help, but you can also ask the community. Also with the community there is a vast amount of problems that have already been solved. The problem you are encountering has a likely chance of already being discussed and even solved in the community section saving you time from reaching out.
Read full review
In-Person Training
iCharts, Inc.
No answers on this topic
Qlik
The instructor was very knowledgeable.
Read full review
Online Training
iCharts, Inc.
No answers on this topic
Qlik
The online instructor was very knowledgeable.
Read full review
Implementation Rating
iCharts, Inc.
No answers on this topic
Qlik
Hire Qlik consultants. It's better done by them or with their aid.
Read full review
Alternatives Considered
iCharts, Inc.
I haven't experience any other alternative product of this.
Read full review
Qlik
The customization of the platform opens up plenty of other options depending on the use cases. The API layer is incredibly rich and makes integration of Qlik based visualization into web pages a simple and effective pattern. It's been very easy to use with a great community made up of professionals. Qlik Sense has introduces artificial Intelligence into my data visualization and reporting activity.
Read full review
Return on Investment
iCharts, Inc.
No answers on this topic
Qlik
  • Once an app is published and running good, we can quickly see the time we save to analyze data.
  • It's hard sometimes to realize the money we save by using this system.
  • People start understanding the power of data and asking more questions.
Read full review
ScreenShots

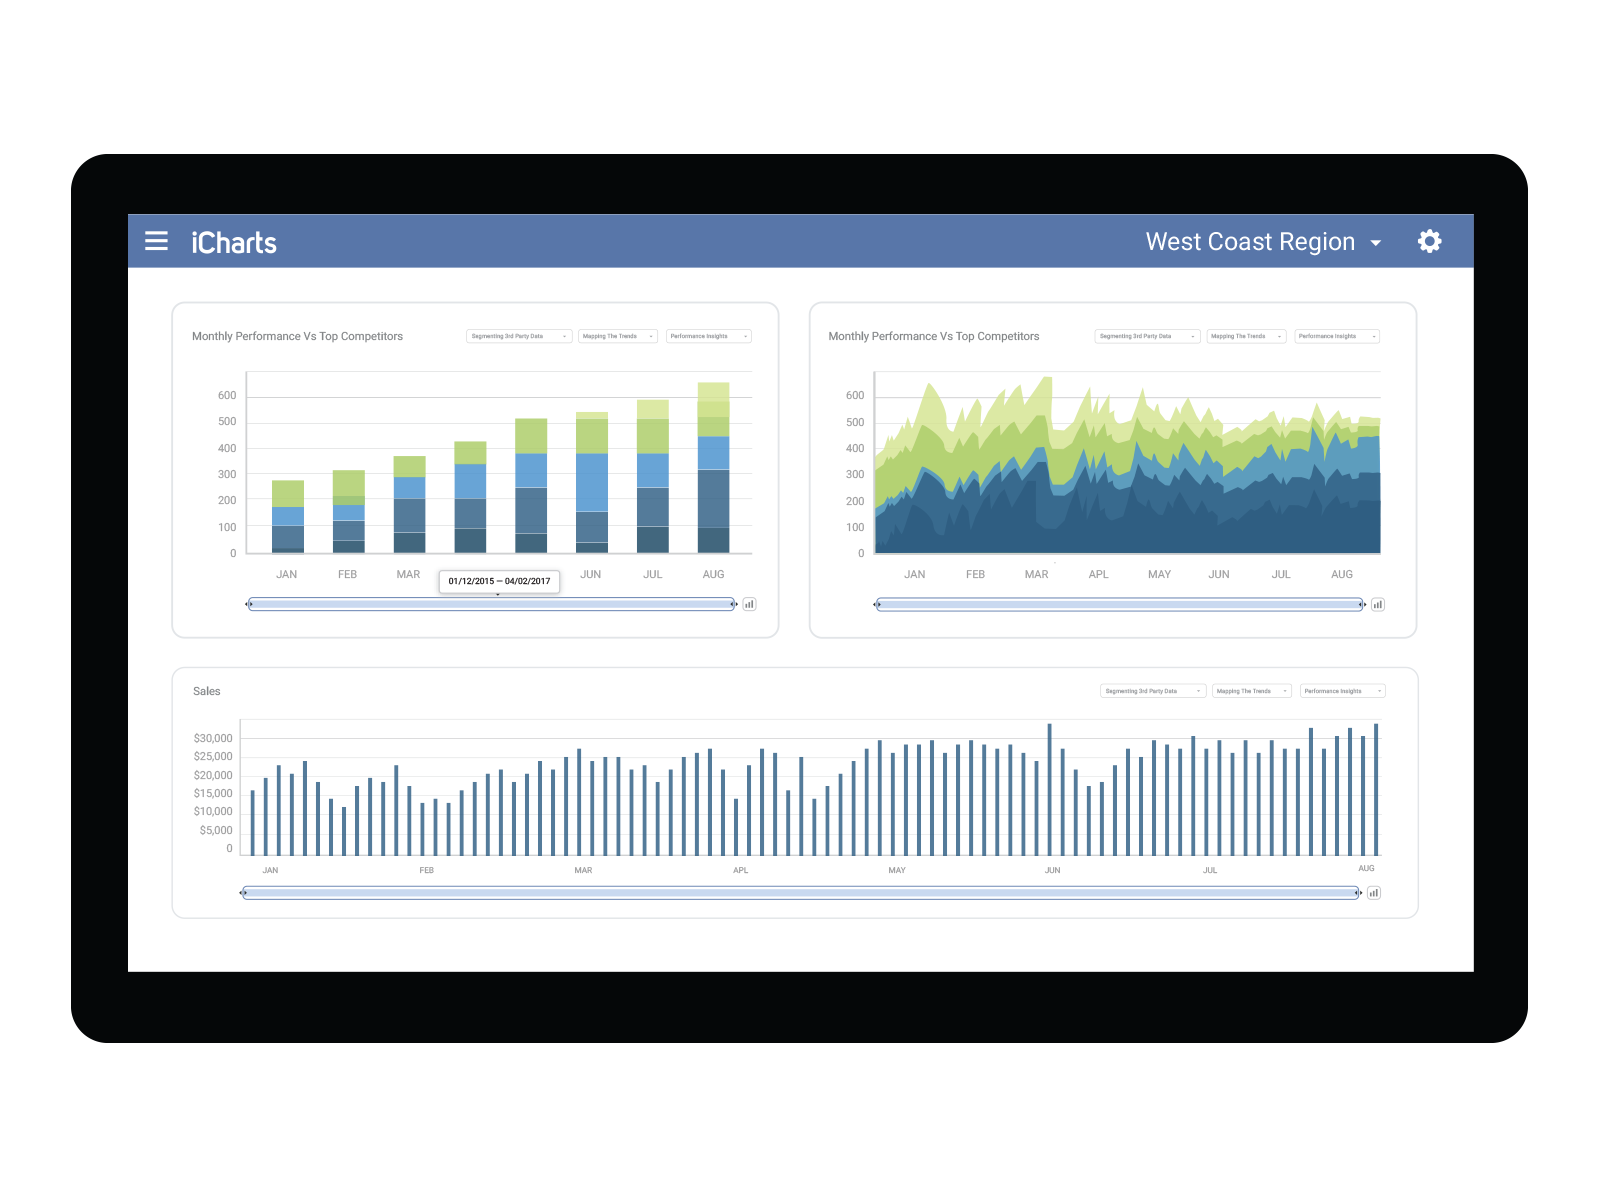
iCharts Screenshots

Screenshot of Screenshot of

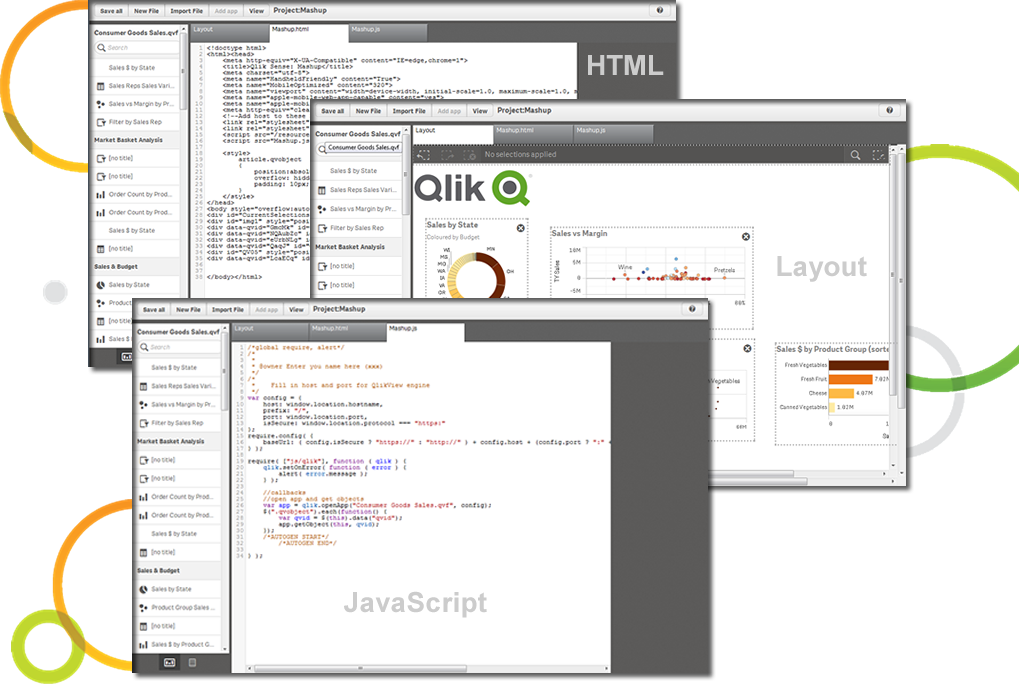
Qlik Sense Screenshots

Screenshot of Qlik Sense Cash Flow DashboardScreenshot of Qlik Sense Global Smart SearchScreenshot of Qlik Sense Smart Data Compression - Get immediate insight on large dataScreenshot of Extend, mix and mash-up with our APIsScreenshot of Add "External data" with Qlik DataMarket - Data as a ServiceScreenshot of Visualization Bundle