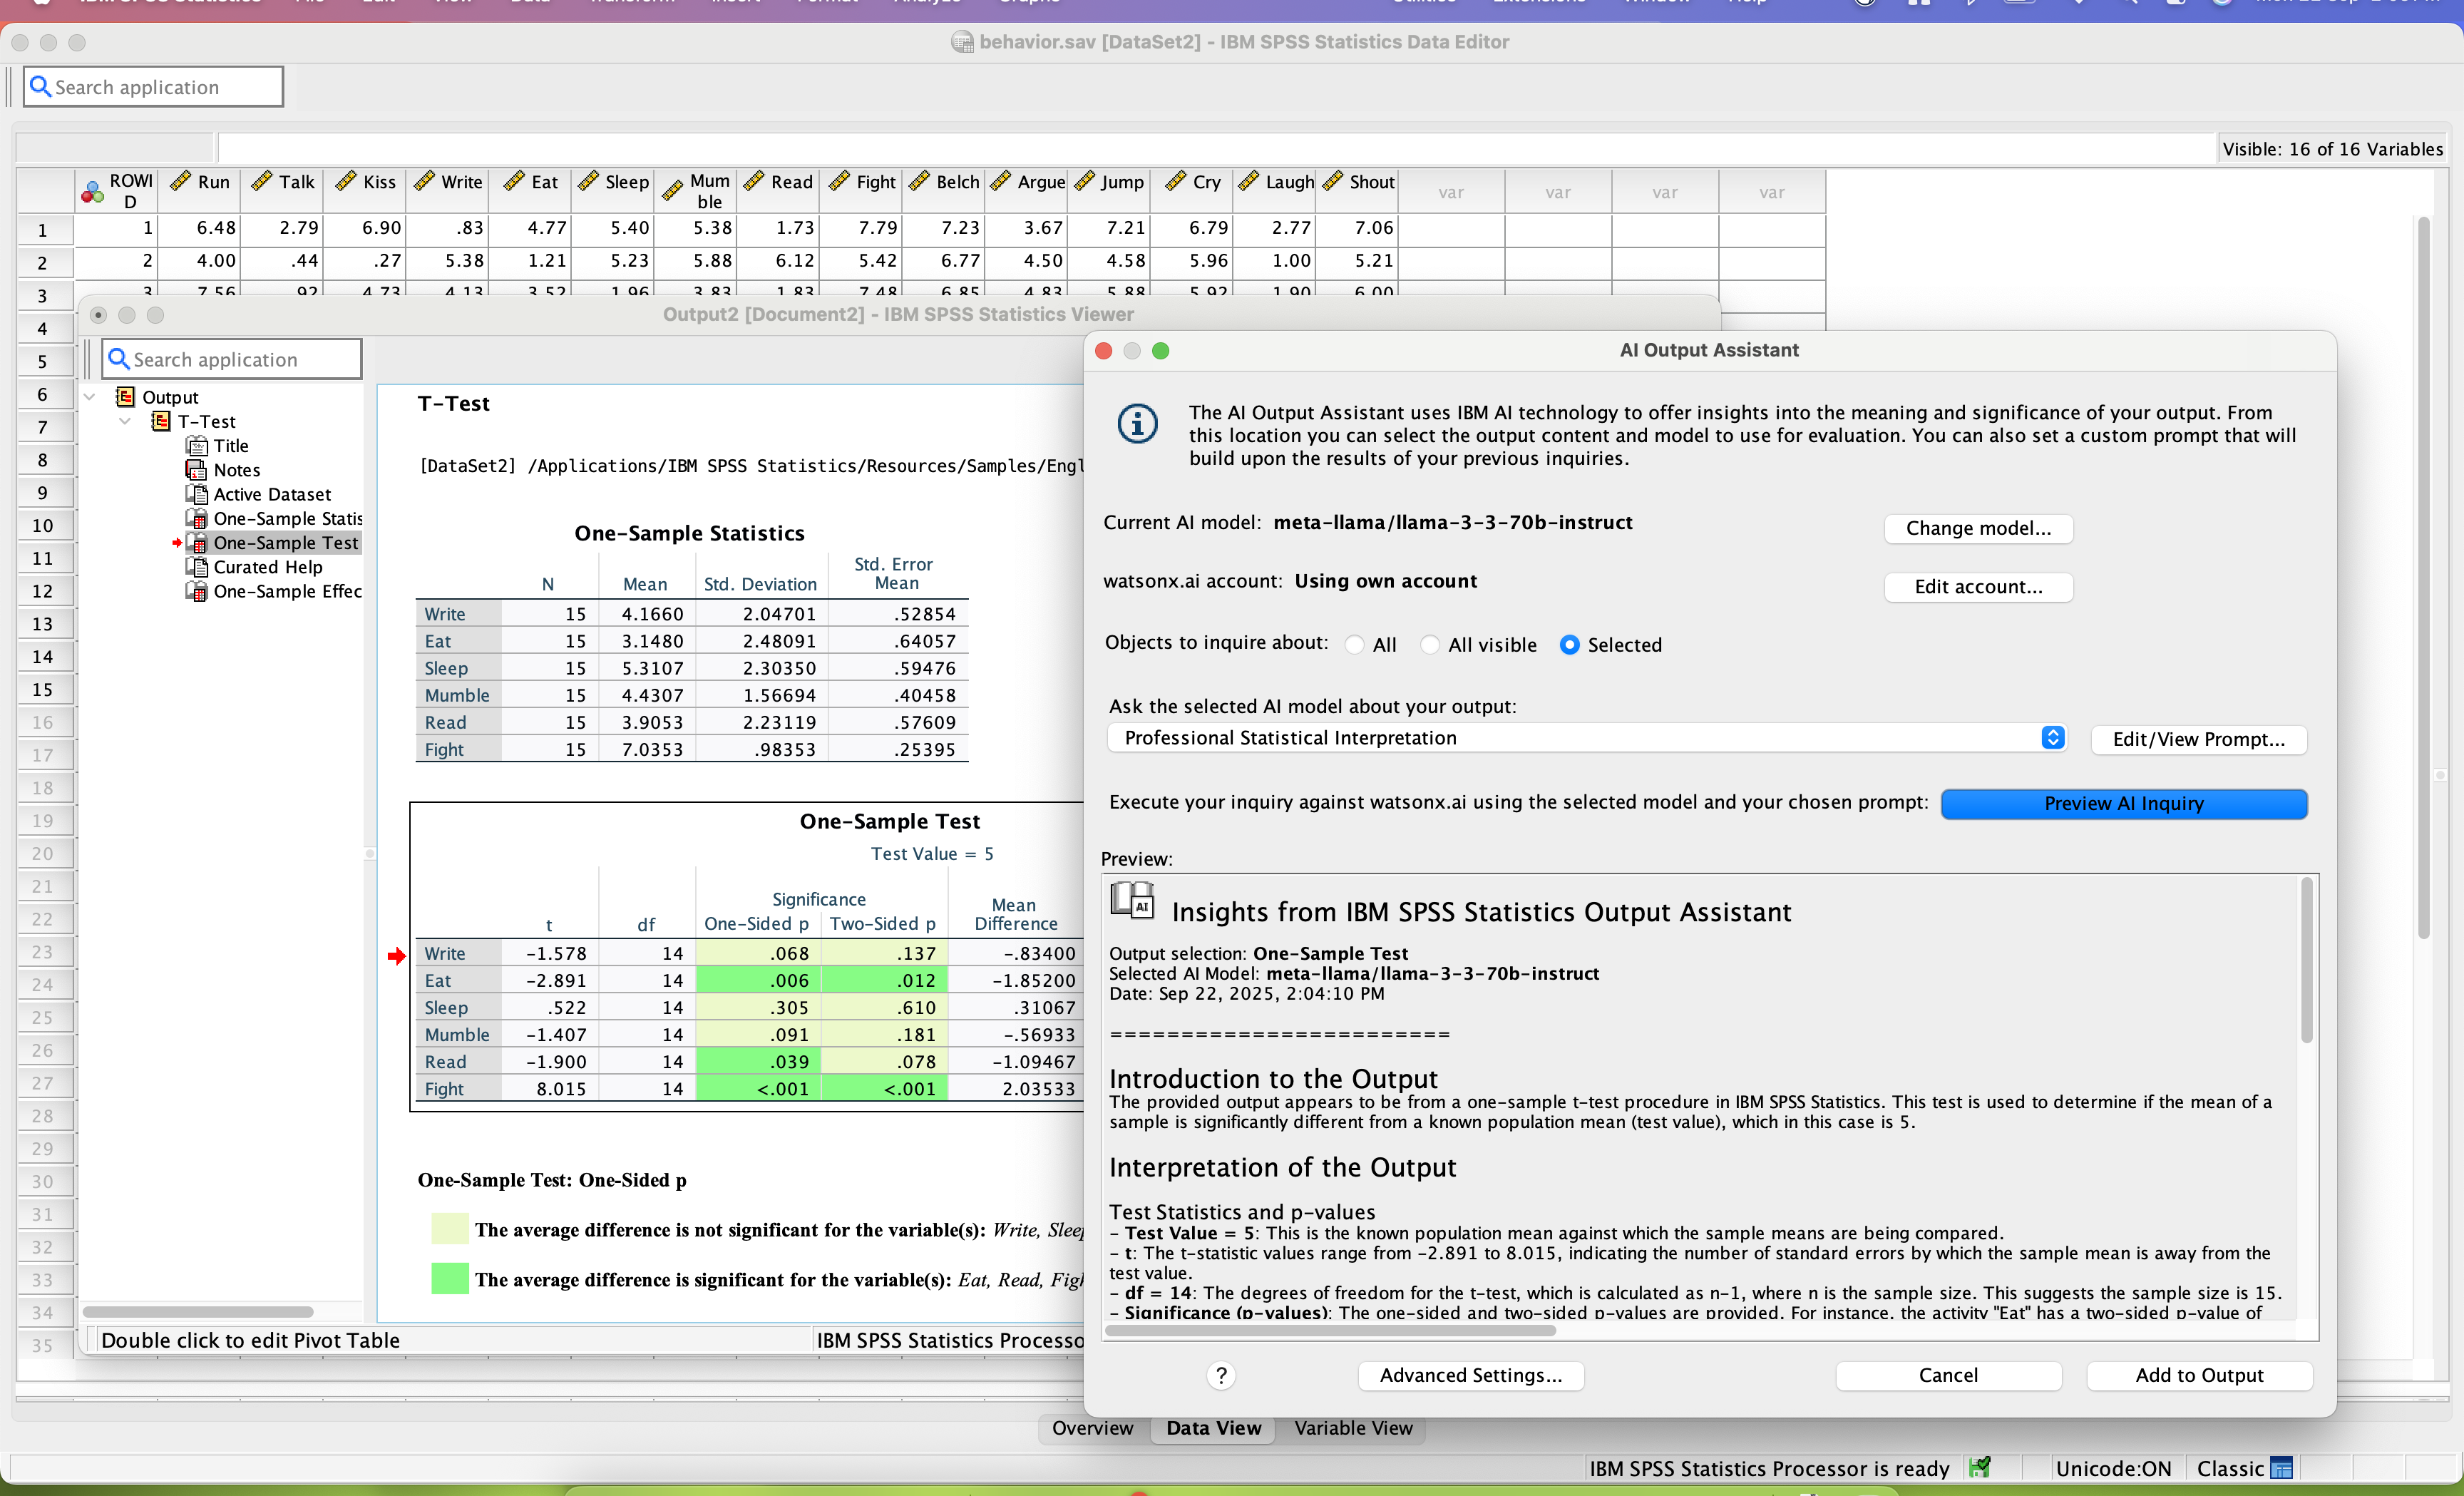
SPSS Statistics is a software package used for statistical analysis. It is now officially named "IBM SPSS Statistics". Companion products in the same family are used for survey authoring and deployment (IBM SPSS Data Collection), data mining (IBM SPSS Modeler), text analytics, and collaboration and deployment (batch and automated scoring services).
$99
per month per user
Qualtrics
Score 7.2 out of 10
N/A
Qualtrics is software for advanced quantitative and qualitative research to design products that satisfy customers, increase market share, and build enduring brands. The platform brings sophisticated quant and qual research together with analytics in a single platform.
SPSS is well-suited for the following: 1) User Behavior Analysis: SPSS handles large datasets to analyze user behavior data. 2) Customer Satisfaction / Foundational Surveys: SPSS facilitates analysis of quant data from satisfaction surveys, keeping us informed about customer needs and preferences. 3) A/B test analysis: SPSS statistical tools for A/B test analysis, which helps optimize user experience of our products. Scenarios where SPSS are less appropriate: 1) Qualitative Data Analysis: I do not use SPSS for open-ended survey responses/qual data. 2) Live/in-vivo data analysis: SPSS is not ideal for real-time data processing. 3) Complex Data Integration: SPSS isn’t the best fit for complex data integration tasks
I think Qualtrics CoreXM can be used in nearly every scenario. It is best suited for internal or external gathering of the voice of the customer through product/service satisfaction surveys, disenrollment surveys, net promoter scores, post-meeting satisfaction surveys, comparison surveys (conjoint studies), etc. It also works well as a knowledge-transfer assessment tool (for tests or quizzes). Also, as a way to capture registrations or RSVPs. It is not as well suited for managing an online community forum that relies on participants to see and react to comments/responses from other members of the online community (like social media). There are other products better suited for that use case.
SPSS has been around for quite a while and has amassed a large suite of functionality. One of its longest-running features is the ability to automate SPSS via scripting, AKA "syntax." There is a very large community of practice on the internet who can help newbies to quickly scale up their automation abilities with SPSS. And SPSS allows users to save syntax scripting directly from GUI wizards and configuration windows, which can be a real life-saver if one is not an experienced coder.
Many statistics package users are doing scientific research with an eye to publish reproducible results. SPSS allows you to save datasets and syntax scripting in a common format, facilitating attempts by peer reviewers and other researchers to quickly and easily attempt to reproduce your results. It's very portable!
SPSS has both legacy and modern visualization suites baked into the base software, giving users an easily mountable learning curve when it comes to outputting charts and graphs. It's very easy to start with a canned look and feel of an exported chart, and then you can tweak a saved copy to change just about everything, from colors, legends, and axis scaling, to orientation, labels, and grid lines. And when you've got a chart or graph set up the way you like, you can export it as an image file, or create a template syntax to apply to new visualizations going forward.
SPSS makes it easy for even beginner-level users to create statistical coding fields to support multidimensional analysis, ensuring that you never need to destructively modify your dataset.
In closing, SPSS's long and successful tenure ensures that just about any question a new user may have about it can be answered with a modicum of Google-fu. There are even several fully-fledged tutorial websites out there for newbie perusal.
Qualtrics offers a wide range of question formats. This feature allows for uniquely styled questions that keep a students interest.
Qualtrics is very useful for sending out surveys on a particular schedule at a good time to not overload our campus IT system. The reminder feature is great in that I can set up all four reminders for the entire survey when I set up the survey.
I most value the immediate support when I run into a problem. A problem stops my work in its tracks. It is very important that I get the issue resolved quickly so I can get on with my work.
The collaborate feature can be clunky and sometimes we have to remove access and add a person back in for them to see the survey in their lists
We have a contract through our university and more than one person has created their account in the wrong place, causing some administrative headaches as that is fixed so that we can collaborate on surveys with them.
I wish it was easier to organize my surveys into folders, there should be a more efficient way to do that.
It's super easy to use for newbies and super powerful for power users! It does EVERYTHING you are usually asked to do analytically. Their Help Desk is PHENOMENAL. And I find the upgrade and renewal price to be a good deal.
I was impressed a couple years ago when two heads of market research at Fortune 500 companies told me about them, and I've been even more impressed with the advancements I've seen in the last year. I like where the company is headed, and I look forward to using them again in a future role.
SPSS is beginner friendly and user-friendly for beginner analysts and simple statistical tests. It's "click and go" interface does take some learning, but overall this is much easier than other programs I have used and seen. Compared to SAS software, SPSS takes a great deal less familiarizing and it not a matter of learning a coding language like SAS and RStudio.
All the menus are very user friendly and intuitive. I can always find exactly what I'm looking for and can change anything I need to with ease. All the elements of the survey are adjustable with very little effort and without confusion.
I have not contacted IBM SPSS for support myself. However, our IT staff has for trying to get SPSS Text Analytics Module to work. The issue was never resolved, but I'm not sure if it was on the IT's end or on SPSS's end
Whenever we have had an issue with trying to figure out how to do something (even though the documentation is incredibly well put together) we have asked Qualtrics support and have always received our answer nearly immediately (I think in maybe 10 times, only once did a support person need to call us back). Qualtrics support is dedicated to solving customer issues right, and in the first contact, if at all possible
I still use it. It does everything you need an online survey to do. From heat mapping to complex skip logic and display logic. I use it weekly and it never disappoints
Have a plan for managing the yearly upgrade cycle. Most users work in the desktop version, so there needs to be a mechanism for either pushing out new versions of the software or a key manager to deal with updated licensing keys. If you have a lot of users this needs to be planned for in advance.
If you have made it this far, you should have a very good idea of how SPSS stacks up the competition (data processing and analytics tools). Even the free ones, such as r Studio or Stata, are leaps and bounds ahead of SPSS. IBM is resting on a reputation developed nearly 30 years ago and has shown no desire to improve.
My institution at the time was using the free version of Qualtrics. We use UserTesting at work currently since we have licenses paid for. Qualtrics isn't bad at with the institution level of license but it could be better. Overall, the interface is not as exciting or eye catching but it does the job.
I found SPSS easier to use than SAS as it's more intuitive to me.
The learning curve to use SPSS is less compared to SAS.
I used SAS, to a much lesser extent than SPSS. However, it seems that SAS may be more suitable for users who understand programming. With SPSS, users can perform many statistical tests without the need to know programming.