Hotjar is a conversion rate optimization tool for digital marketers. Features include heatmapping, visual session recording, conversion funnel analytics, form analytics, feedback polls and surveys, and usability testing.
The tool is used by digital analysts, UX designers, web developers and product marketers. Hotjar was acquired by Contentsquare September 2021, and is now a Contentsquare brand.
$39
per month 100 daily sessions
Webtrends Analytics
Score 4.4 out of 10
N/A
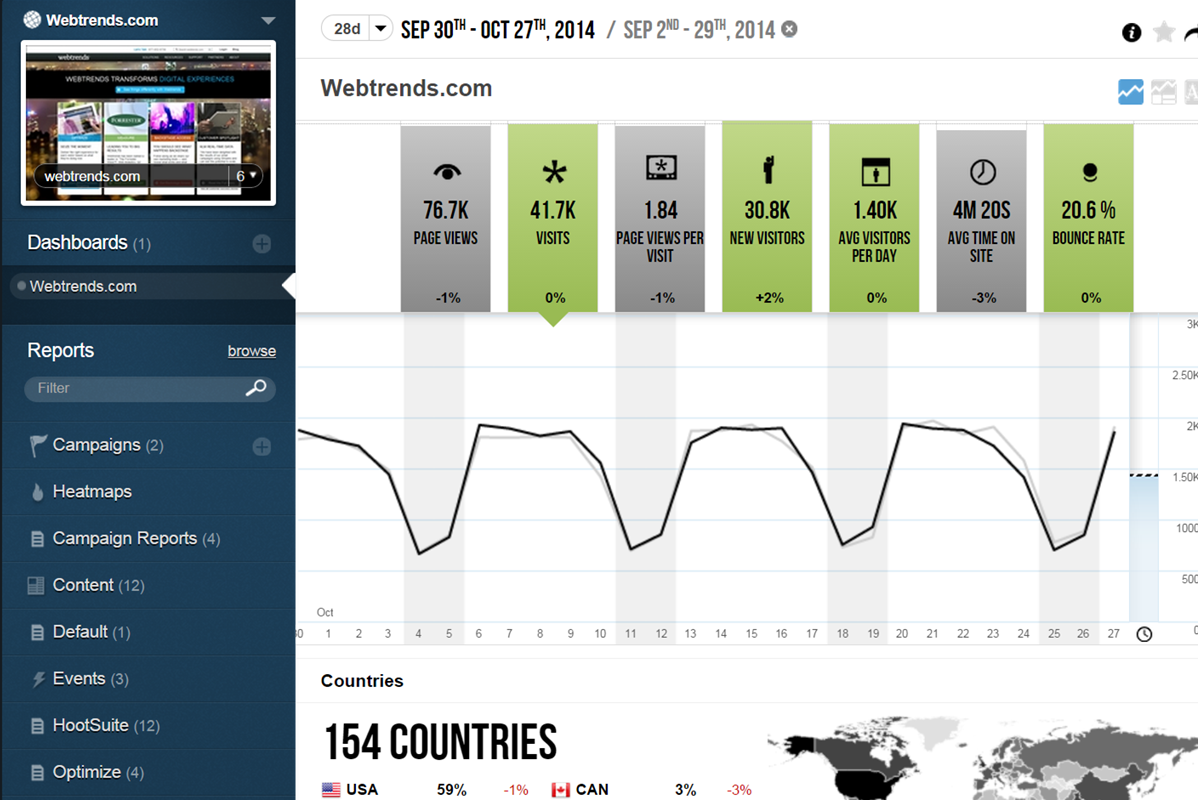
WebTrends provides an enterprise web analytics platform and, according to Forrester, has a strong focus on support for mobile and social channels and a very open platform. Webtrends competes directly with Adobe Site Catalyst, IBM Coremetrics. and comScore DigitalAnalytix.
Hotjar is well suite for organizations that want to get a good glimpse into user behavior on their websites. The tool is easily installed through Google Tag Manager, and then users simply select which pages or paths they want the tool to analyze. After a few days, users can start seeing patterns develop, helping them understand what areas of the user journey flow they need to test out and improve. Hotjar is primarily for web-based experiences, not for mobile applications and other non-web digital applications.
Scenarios 1. If you want to use web server log files as input to your web analytics, then Webtrends will provides a good product, with great ease of implementation. Don't even think about being cheap on hardware, and make sure Webtrends runs on real servers, not in a VM environment. 2. If you want to use Data Tagging, similar to Google Analytics or Site Catalyst, Webtrends has a powerful product, just be prepared to pay. 3. If you are new to Web Analytics, but it is the strategic direction, start with Webtrends on Premises. Questions to Ask 1. What are you trying to accomplish? 2. Can you place a dollar value on the benefit that you expect/need from Webtrends? 3.Can you live with Webtrends running SaaS?
Heat mapping is great on Hotjar. It is a good place to start when you are looking at the UX & CRO on your website. You can see the % of people clicking on elements on a page, how far they scroll, and mouse movements.
Hotjar is great for session recordings. These record the mouse movements, clicks, pages and scrolls of a user in video format. You can watch these to investigate what works well on a site and identify potential roadblocks and bugs.
Hotjar is great as it ensures that users details are anonymous; for instance, if you are watching a session recording, you cannot see what a user types in a form field, as Hotjar blanks this out.
Hotjar has a poll function, so you can have polls on your website.
Webtrends Analytics makes complex situations understandable to a non-technical audience. The vast capabilities and ways to slice data is both a great tool, but can also cause a user/users many hours of frustration.
Visual data display is clean, to the point, and not overly convoluted with unneeded variables and standard (defualt) settings. Everything the end user sees is customizeable.
Exports of raw data collections was easy and accurate. Once the parameters of data collection are finally set up and working, its easy to get what you want from the UI and is delievered in a variety of options.
The video recording feature is very slow to use. I know there is a very powerful process going on (saving your CSS and the DOM movements you make) but anyway it's slow to use.
Hotjar itself is heavy and has effects on your load times. This is a very important issue and I hope they're working on that.
Adding more segmentation would be nice. For example, being able to connect your API or more information to show relevant polls or feedback buttons to certain users. Aggregated info is hard to process.
Webtrends is not great at providing statistical data for analysis. You need to enable Log File Delivery or create an analysis export to perform this. This could theoretically be done with Streams.
Webtrends has difficulty identifying multi-visit users due to the inherent fragility of cookie-based tracking.
Webtrends Analytics does not provide Pathing capabilities for segments, only for the aggregate. However, this can be worked around with Scenario functionality selectively fired by a tag management system.
Segmentation by high-cardinality parameters tends to cause issues with table limits. Even after scrubbing and scrutinizing data, we commonly see up of 10K rows per dimension. Due to this, we use Webtrends Analytics to roll up data into larger segments and export all of our log data into our database for heavy duty number crunching.
Even though the heat maps and user recordings were useful, our website was significantly slowed down after we installed Hotjar, so much so, that it took over a minute for our blog to load. The data that we gathered was not worth the length that it took our website to load.
The obstacles to renewing are 1) finding people to manage it who know it well and 2) frustration because of the lack of on-the-fly analysis. Usually, renewal prices are reasonable and the cost of switching to something else when you have a somewhat complicated setup far outweigh the renewal costs, especially if your implementation is sound and your reports are humming along. A lot of renewal decisions are going to hinge on the new product that will start to roll out this month.
So easy and simple to use! Straightforward anyone in the team is able to easily go in and set up anything in Hotjar. The UI is really simple. Whenever you give feedback to Hotjar they continously take on board the feedback and improve the tool.
If I could give it a 0, I would. Not having an intuitive user interface made it impossible to convince non-analytic business users to use the tool on their own. Even as a seasoned analyst, frequent calls were needed to get what should be simple tasks done. Account managers don't understand the tool either, and have to refer you to technical support
The v9 admin interface and v10 reporting interface work as well as expected, but have a tendency to be pokey, especially for bulky reports and whenever you're connected to wifi. I much prefer using the REST API for all reporting for this reason, which simply dumps out the data and doesn't bother with the user interface.
Hotjar is a SaaS-based company, and as such has a good support service. Users can quickly submit support tickets through Hotjar's online portal. Enterprise customers get access to additional support members and have SLAs to support their larger, more complex needs. Overall, Hotjar is extremely reliable and I've never had to reach out to customer support.
The Webtrends Support Engineers are expert at what they do, and we get to speak to someone on the support team quickly. They provide great solutions when available, and when there is no solution, which can happen, they describe work-arounds.
The in-person training was comprehensive enough to get you started, but I strongly recommend having a more experienced person when beginning with the tool.
Webtrends provides several free webinars over the course of the year, many of which I would expect to pay for. The people providing the webinars seem to have a good feel for real-world application of the product.
Careful planning and patience. Use a non-public test site to fine tune tags and reporting. Despite best laid plans, there will be surprises when you collect the data, run the analysis and begin generating reports using the tool. Perform a tag audit to ensure tags fire as desired.
Compared to Sprig and Usabilla, Hotjar has robust functionality. Again, as stated earlier, the ability to summarize rage clicks, trigger recordings for a/b experiments, and run intercept surveys on mobile is very useful. Hotjar is also noticeably more intuitive to use than Usabilla, with a cleaner interface and navigation.
Webtrends has its work cut out for itself considering you have the behemoth Google Analytics and Google Analytics Premium having a strong offering and brand recognition for the price of free. After reviewing the paid service I'd suggest you start off with GA as a cheaper alternative that is just as robust, if not much more flexible in regards to the reporting and goal tracking needs for our company.
Our UX team can now use hard data to back up and validate design decisions that we make. Our role as usability experts is becoming more respected and integral to business objectives because we now have data that can back up our field of study and prove that our roles are demonstrably useful and necessary.
HotJar allows our small team of 3 UX designers to get research data as if we were a much larger team. Instead of painstakingly using our time to do guerrilla research, endless user observations, and other types of manual testing, we can now get a significant portion of our data from HotJar.
Using HotJar is actually giving our team a sense of excitement and enjoyment in our day-to-day usability work. Instead of seeing UX as a chore, HotJar is making data gathering and analyzing more fun, because we can see tangible results from a much larger pool of user/user-data than we could in the past.
Webtrends has had a positive impact on site visitation because it allowed us to understand the sources by domain for site traffic and find out ways to increase visits from those domains.
Webtrends has also allowed us to understand areas of optimization on the site, which has had a positive impact on the overall user journey on the site, likely leading to longer site duration and engagement.