GoodData vs. Jama Analyze (Discontinued)

Overview
ProductRatingMost Used ByProduct SummaryStarting Price
GoodData
Score 8.6 out of 10
N/A
GoodData is an analytics platform used by organizations to deliver real-time, governed insights, embedded into products, customized for users, and integrated into any data environment. At the heart of GoodData is a universal semantic layer: a shared, code-defined model that maps raw data into consistent business concepts, metrics, and logic. Metrics are authored once and reused across every dashboard, app, or API, to ensure accuracy, governance, and trust wherever analytics are…N/A
Jama Analyze (Discontinued)
Score 8.0 out of 10
Mid-Size Companies (51-1,000 employees)
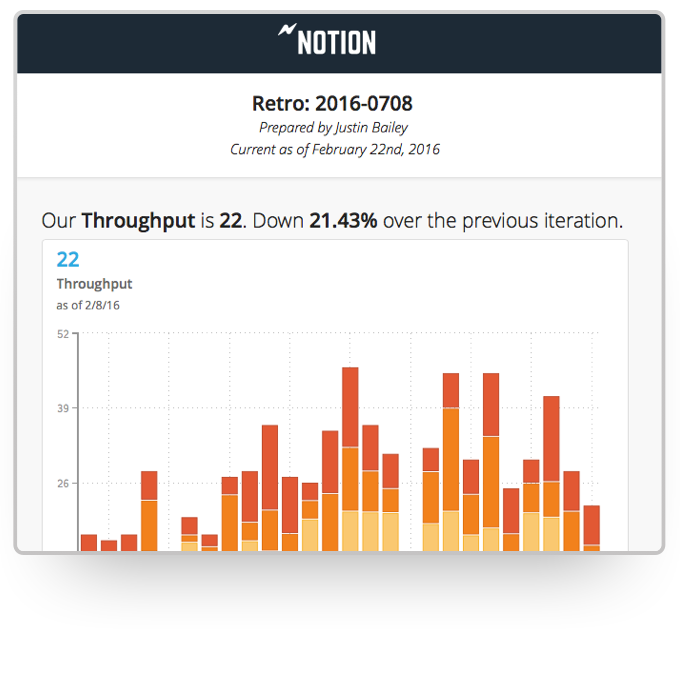
Jama Analyze (formerly called Notion) was a solution for quickly creating shareable, custom dashboards. However, the product is no longer available. Jama Software sunset the Analyze product in 2019. Some of the benefits of Jama Analyze included the ability to: Create custom metrics across all teams with data from any source with the intuitive metric builder. Experience self-serve BI with no coding and no IT to get started making custom dashboards.…
$23
per month
Pricing
GoodDataJama Analyze (Discontinued)
Editions & Modules
No answers on this topic
Starter Teams - 2 users
$23
per month
Small Teams - 5 users
$89
per month
Growing Teams - 10 users
$179
per month
Growing Teams - 15 users
$259
per month
Growing Teams - 20 users
$339
per month
Offerings
Pricing Offerings
GoodDataJama Analyze (Discontinued)
Free Trial
YesYes
Free/Freemium Version
NoNo
Premium Consulting/Integration Services
NoNo
Entry-level Setup FeeOptionalNo setup fee
Additional Details
More Pricing Information
Community Pulse
GoodDataJama Analyze (Discontinued)
Features
GoodDataJama Analyze (Discontinued)
BI Standard Reporting
Comparison of BI Standard Reporting features of Product A and Product B
GoodData
7.9
Ratings
12% above category average
Jama Analyze (Discontinued)
9.3
Ratings
13% above category average
Pixel Perfect reports7.90 Ratings9.00 Ratings
Customizable dashboards8.70 Ratings10.00 Ratings
Report Formatting Templates7.00 Ratings9.00 Ratings
Ad-hoc Reporting
Comparison of Ad-hoc Reporting features of Product A and Product B
GoodData
7.7
Ratings
0% below category average
Jama Analyze (Discontinued)
8.0
Ratings
1% below category average
Drill-down analysis7.40 Ratings00 Ratings
Formatting capabilities7.00 Ratings00 Ratings
Report sharing and collaboration7.30 Ratings8.00 Ratings
Data Discovery and Visualization
Comparison of Data Discovery and Visualization features of Product A and Product B
GoodData
7.2
Ratings
4% below category average
Jama Analyze (Discontinued)
10.0
Ratings
23% above category average
Pre-built visualization formats (heatmaps, scatter plots etc.)8.10 Ratings10.00 Ratings
Location Analytics / Geographic Visualization6.90 Ratings00 Ratings
Predictive Analytics6.60 Ratings00 Ratings
Pattern Recognition and Data Mining7.10 Ratings00 Ratings
Access Control and Security
Comparison of Access Control and Security features of Product A and Product B
GoodData
8.0
Ratings
6% above category average
Jama Analyze (Discontinued)
7.7
Ratings
10% below category average
Multi-User Support (named login)8.30 Ratings8.00 Ratings
Role-Based Security Model7.90 Ratings7.00 Ratings
Multiple Access Permission Levels (Create, Read, Delete)8.00 Ratings8.00 Ratings
Single Sign-On (SSO)7.70 Ratings00 Ratings
Application Program Interfaces (APIs) / Embedding
Comparison of Application Program Interfaces (APIs) / Embedding features of Product A and Product B
GoodData
8.1
Ratings
8% above category average
Jama Analyze (Discontinued)
6.0
Ratings
26% below category average
REST API8.30 Ratings6.00 Ratings
Javascript API8.00 Ratings00 Ratings
iFrames8.00 Ratings00 Ratings
Report Output and Scheduling
Comparison of Report Output and Scheduling features of Product A and Product B
GoodData
-
Ratings
Jama Analyze (Discontinued)
7.0
Ratings
17% below category average
Publish to Web00 Ratings7.00 Ratings
Report Versioning00 Ratings7.00 Ratings
Mobile Capabilities
Comparison of Mobile Capabilities features of Product A and Product B
GoodData
-
Ratings
Jama Analyze (Discontinued)
6.5
Ratings
18% below category average
Responsive Design for Web Access00 Ratings7.00 Ratings
Dashboard / Report / Visualization Interactivity on Mobile00 Ratings6.00 Ratings
Best Alternatives
GoodDataJama Analyze (Discontinued)
Small Businesses
BrightGauge
BrightGauge
Score 9.1 out of 10
BrightGauge
BrightGauge
Score 9.1 out of 10
Medium-sized Companies
Reveal
Reveal
Score 10.0 out of 10
Reveal
Reveal
Score 10.0 out of 10
Enterprises
Infor Birst
Infor Birst
Score 5.3 out of 10
Kyvos Semantic Intelligence Layer
Score 9.9 out of 10
All AlternativesView all alternativesView all alternatives
User Ratings
GoodDataJama Analyze (Discontinued)
Likelihood to Recommend
8.4
(0 ratings)
8.0
(0 ratings)
Likelihood to Renew
9.1
(0 ratings)
-
(0 ratings)
Usability
7.9
(0 ratings)
-
(0 ratings)
Availability
7.0
(0 ratings)
-
(0 ratings)
Performance
8.0
(0 ratings)
-
(0 ratings)
Support Rating
8.7
(0 ratings)
-
(0 ratings)
In-Person Training
9.0
(0 ratings)
-
(0 ratings)
Online Training
8.0
(0 ratings)
-
(0 ratings)
Implementation Rating
9.0
(0 ratings)
-
(0 ratings)
Ease of integration
7.2
(0 ratings)
-
(0 ratings)
User Testimonials
GoodDataJama Analyze (Discontinued)
Likelihood to Recommend
If you have consistently formatted data, that you want regular reports on, plus flexibility to let end users build their own reports, GoodData is perfect. Especially if your end users are less technical. If you want to be able to embed your reporting into your app, GoodData excels, though the start up process can be involved. If your data structure varies, it could be more challenging to integrate. It may also not be worth the integration if you have people who can already run their own SQL queries.
Read full review
The integration with JIRA is quite a handy tool to have. It allows for team progress to be easily tracked and visualized using the software while key metrics are brought to the forefront through the software's business intelligence. It makes presenting data and milestones achieved to non-technical management quite simple and can be extremely useful.
Read full review
Pros
  • GoodData helps in simplifying complex data into easy-to-understand visuals. We can create personalized dashboards & tailor them as per requirements. This data can be used from an executive level employee to a team lead employee in the business
  • GoodData is a very user friendly platform. The collaborative features simplify sharing and discussing reports among team members which promotes a culture of data-driven decision-making.
  • GoodData connects with various data sources and consolidate information from multiple platforms. This flexibility proves invaluable for businesses dealing with data spread across different systems as they can access large amount of data on a single platform.
Read full review
  • This allows us to keep track of our team's work by integrating with our product boards on JIRA.
  • It allows us to create visualized reports for our team's progress.
  • It allows us to gain insights about things that are going well in our product pipeline as well as potential areas of concern based on the data that is collected.
Read full review
Cons
  • would be nice to be able to add the same filter to a multi-tab dashboard once instead of having to do it for each tab; tedious and time consuming
  • Variable use is kind of clunky and would like to be able to hide/show easier
  • The newer insight based dashboard method does not have the flexibility classic does
Read full review
  • The service tends to be slow at times and working offline can be a pain.
  • It has a bit of a learning curve when you start out.
  • The price is quite high for the features it offers.
Read full review
Likelihood to Renew
Each client I have worked with and spoken too has renewed their GoodData subscription. I know of not one to date that has cancelled. The GoodData platform has a very high rate of renewal from the discussions I have had with their internal teams as well
Read full review
No answers on this topic
Usability
GoodData provided us with strong overall usability and provided us a platform for various business analytics. Its user-friendly and insightful reports and also the dashboards. Me and my team really appreciate the platform's ability to streamline decision-making processes. However, there is a learning curve during initial setup as I mentioned before. Continuous improvements in the onboarding could further enhance GoodData's usability as well.
Read full review
No answers on this topic
Reliability and Availability
We are approximately one month since go-live. There has been one short outage.
Read full review
No answers on this topic
Performance
Performance on refreshing metrics works well.
Read full review
No answers on this topic
Support Rating
The fast and comprehensive responses we got from GoodData regarding the doubts we had experienced while starting to use the products and metrics were of great help in ensuring the metrics we were obtaining were accurate to what we wanted to know about our customers' experience and our product areas of opportunity.
Read full review
No answers on this topic
In-Person Training
Petr was a rock star - patient, knowledgeable, clear and easy to work with.
Read full review
No answers on this topic
Online Training
GoodData implementation team was professional and courteous
Read full review
No answers on this topic
Implementation Rating
Thorough, professional and on time.
Read full review
No answers on this topic
Alternatives Considered
GoodData comparing to other platform is very easy to use, customer support and on-boarding support. Set of features, speed of integration in our platform. Also great benefit for us was very competetive pricing.
Read full review
Jama Analyze, as well as Asana, connect with JIRA to visualize milestone tracking and team progress. While Asana is cheaper, Jama Analyze provides better reports and visual data. Google Data Studio, through a bit of tinkering from your software development team, can achieve similar results, however, the charts and graphs leave a bit to be desired in terms of design. In all, Jama Analyze is great if you have few users and don't need to go for the licensing option. Otherwise, there are definitely cheaper options available but you may have to sacrifice on performance and look-and-feel.
Read full review
Return on Investment
  • I personally pushed our management to get GoodData implemented, and there on we have been making much more profits than we ever did!
  • Last month we made a decision using the platform and withing a short span of time our ROI gets 7X.
  • We also made a marketing spend of $100,000 every quater using the insights and metrics, and we are really happy with the returs.
Read full review
No answers on this topic
ScreenShots

GoodData Screenshots

Screenshot of Screenshot of Screenshot of Screenshot of Screenshot of Screenshot of

Jama Analyze (Discontinued) Screenshots

Screenshot of An example of a Notion dashboard with custom team metrics, a variety of visualizations, and summaries of the data at the top of each card.Screenshot of The Notion directory is where metrics from all your data sources live, making it easy to compare and combine. Give your team a single source of truth for the metrics that matter most.Screenshot of You can also assign metric ownership to members of your team. They'll got automatic reminders to report the data.Screenshot of Build custom metrics and quickly change how they're visualized or the reporting interval.Screenshot of Every metric has built-in commenting to help you capture context around the data.Screenshot of One click reporting means it's easy to share important team or product performance data with key stakeholders.