Entrinsik Informer vs. Flexmonster Pivot Table & Charts Component

Overview
ProductRatingMost Used ByProduct SummaryStarting Price
Entrinsik Informer
Score 10.0 out of 10
N/A
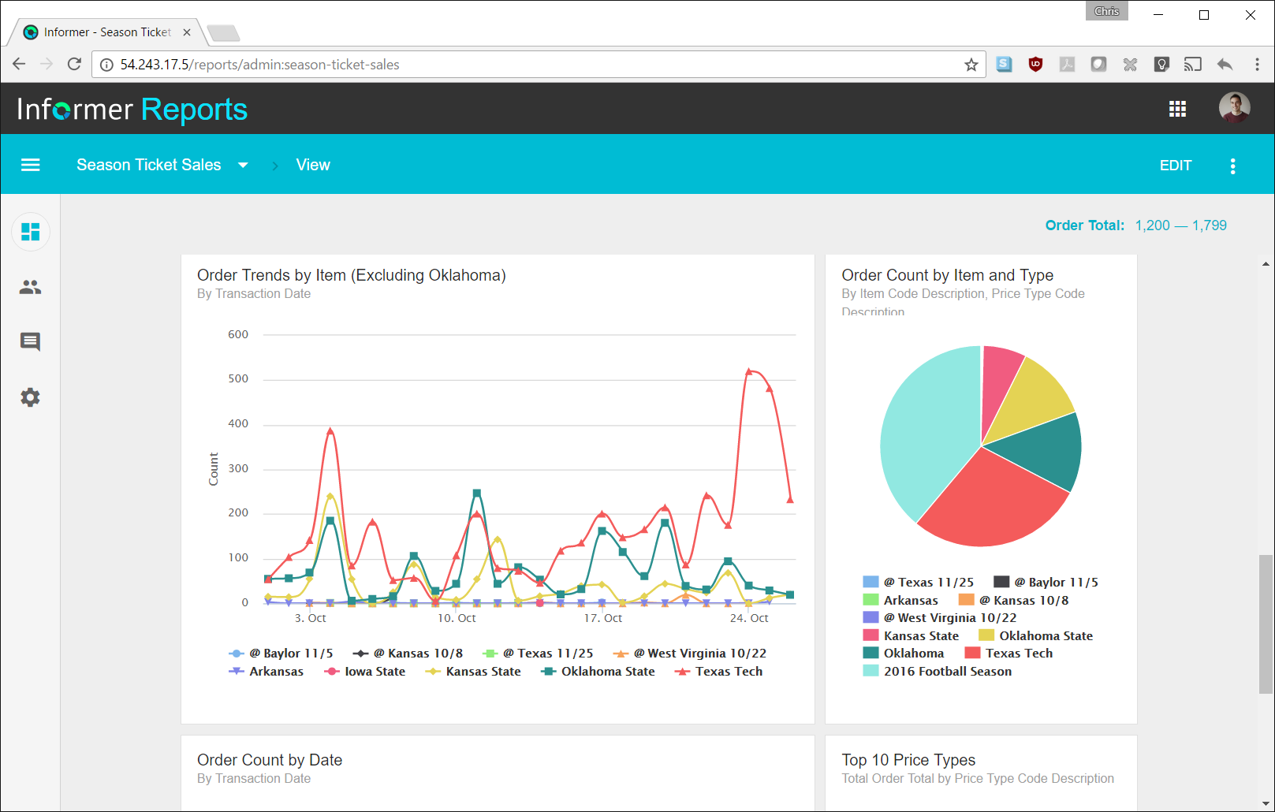
Entrinsik Informer is a web-based reporting and business intelligence application popular in the higher education vertical market. It helps organizations transform real-time data into actionable information by delivering ad-hoc reporting, data analysis, and interactive dashboards.N/A
Flexmonster Pivot Table & Charts Component
Score 10.0 out of 10
Mid-Size Companies (51-1,000 employees)
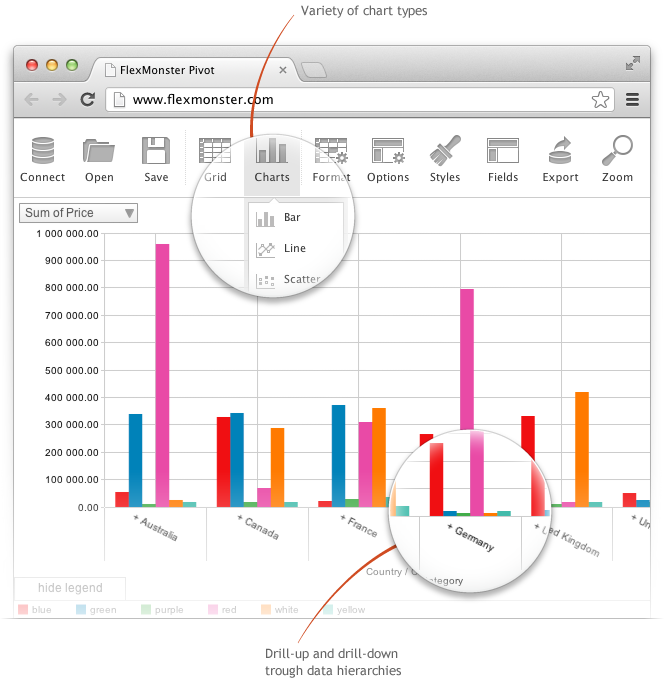
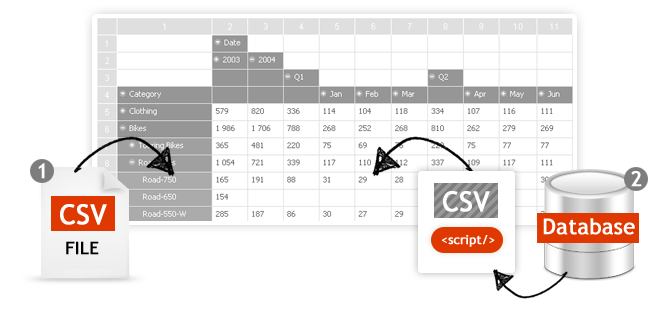
Flexmonster Pivot Table & Charts is a component for interactive pivot reports that can be inserted into a web page or a web application. It’s a JavaScript tool that enables a user to visualize their business data. This solution supports Microsoft Analysis Services OLAP cubes, Mondrian, icCube, JSON, SQL (MS SQL, MySQL and others) databases or static JSON or CSV files. According to the vendor, this solution allows users to work extremely quickly with really large data…
$0
Annual SaaS Subscription
Pricing
Entrinsik InformerFlexmonster Pivot Table & Charts Component
Editions & Modules
No answers on this topic
Pivot Table for SQL/CSV/JSON Unlimited
$0
Annual SaaS Subscription
Pivot Table for Pentaho Mondrian
$0
Annual SaaS Subscription
Pivot Table for MS Analysis Services
$0
Annual SaaS Subscription
Pivot Table for SQL/CSV/JSON Basic
$299
Annual subscription
Pivot Table for Pentaho Mondrian
$799
Annual subscription
Pivot Table for SQL/CSV/JSON Unlimited
$799
Annual subscription
Pivot Table for MS Analysis Services
$799
Annual subscription
Offerings
Pricing Offerings
Entrinsik InformerFlexmonster Pivot Table & Charts Component
Free Trial
YesYes
Free/Freemium Version
NoNo
Premium Consulting/Integration Services
NoNo
Entry-level Setup FeeNo setup feeNo setup fee
Additional Details
More Pricing Information
Community Pulse
Entrinsik InformerFlexmonster Pivot Table & Charts Component
Features
Entrinsik InformerFlexmonster Pivot Table & Charts Component
BI Standard Reporting
Comparison of BI Standard Reporting features of Product A and Product B
Entrinsik Informer
7.3
Ratings
11% below category average
Flexmonster Pivot Table & Charts Component
10.0
Ratings
20% above category average
Pixel Perfect reports5.50 Ratings00 Ratings
Customizable dashboards9.10 Ratings00 Ratings
Report Formatting Templates7.50 Ratings10.00 Ratings
Ad-hoc Reporting
Comparison of Ad-hoc Reporting features of Product A and Product B
Entrinsik Informer
8.6
Ratings
7% above category average
Flexmonster Pivot Table & Charts Component
9.5
Ratings
16% above category average
Drill-down analysis9.10 Ratings00 Ratings
Formatting capabilities8.20 Ratings9.00 Ratings
Integration with R or other statistical packages8.20 Ratings00 Ratings
Report sharing and collaboration9.10 Ratings10.00 Ratings
Report Output and Scheduling
Comparison of Report Output and Scheduling features of Product A and Product B
Entrinsik Informer
9.1
Ratings
9% above category average
Flexmonster Pivot Table & Charts Component
10.0
Ratings
18% above category average
Publish to Web9.10 Ratings00 Ratings
Publish to PDF9.10 Ratings10.00 Ratings
Report Versioning9.10 Ratings00 Ratings
Report Delivery Scheduling9.10 Ratings00 Ratings
Delivery to Remote Servers9.10 Ratings00 Ratings
Data Discovery and Visualization
Comparison of Data Discovery and Visualization features of Product A and Product B
Entrinsik Informer
7.3
Ratings
9% below category average
Flexmonster Pivot Table & Charts Component
-
Ratings
Pre-built visualization formats (heatmaps, scatter plots etc.)7.30 Ratings00 Ratings
Location Analytics / Geographic Visualization7.30 Ratings00 Ratings
Access Control and Security
Comparison of Access Control and Security features of Product A and Product B
Entrinsik Informer
9.1
Ratings
7% above category average
Flexmonster Pivot Table & Charts Component
-
Ratings
Multi-User Support (named login)9.10 Ratings00 Ratings
Role-Based Security Model9.10 Ratings00 Ratings
Multiple Access Permission Levels (Create, Read, Delete)9.10 Ratings00 Ratings
Report-Level Access Control9.10 Ratings00 Ratings
Mobile Capabilities
Comparison of Mobile Capabilities features of Product A and Product B
Entrinsik Informer
9.1
Ratings
15% above category average
Flexmonster Pivot Table & Charts Component
10.0
Ratings
24% above category average
Responsive Design for Web Access9.10 Ratings10.00 Ratings
Dashboard / Report / Visualization Interactivity on Mobile9.10 Ratings00 Ratings
Application Program Interfaces (APIs) / Embedding
Comparison of Application Program Interfaces (APIs) / Embedding features of Product A and Product B
Entrinsik Informer
8.2
Ratings
5% above category average
Flexmonster Pivot Table & Charts Component
-
Ratings
REST API8.20 Ratings00 Ratings
Best Alternatives
Entrinsik InformerFlexmonster Pivot Table & Charts Component
Small Businesses
BrightGauge
BrightGauge
Score 9.1 out of 10
BrightGauge
BrightGauge
Score 9.1 out of 10
Medium-sized Companies
Reveal
Reveal
Score 10.0 out of 10
Reveal
Reveal
Score 10.0 out of 10
Enterprises
Kyvos Semantic Intelligence Layer
Score 9.9 out of 10
Kyvos Semantic Intelligence Layer
Score 9.9 out of 10
All AlternativesView all alternativesView all alternatives
User Ratings
Entrinsik InformerFlexmonster Pivot Table & Charts Component
Likelihood to Recommend
10.0
(0 ratings)
10.0
(0 ratings)
Likelihood to Renew
8.7
(0 ratings)
-
(0 ratings)
Usability
9.1
(0 ratings)
9.0
(0 ratings)
Availability
9.1
(0 ratings)
-
(0 ratings)
Performance
8.3
(0 ratings)
-
(0 ratings)
Support Rating
10.0
(0 ratings)
10.0
(0 ratings)
Online Training
7.3
(0 ratings)
-
(0 ratings)
Implementation Rating
9.0
(0 ratings)
-
(0 ratings)
Product Scalability
7.1
(0 ratings)
-
(0 ratings)
User Testimonials
Entrinsik InformerFlexmonster Pivot Table & Charts Component
Likelihood to Recommend
Most schools that use Colleague (the Student Information System) have either UniData or SQL Server as the back-end database. If a school is currently a UniData school but has plans to move to SQL Server in the relatively near future then I'd advise against moving forward with Informer until after the conversion to SQL Server. There is a tool that will convert some reports, but there are many instances where the tool won't successfully convert the report and it will need to be re-written.
Read full review
Fantastic product to embed in any SaaS solution for reporting and data exports. Excellent performance, ability to customize fields and tons of other features out of the box that makes it a well-rounded tool that is easy to use. To top it off their support is amazing for answering technical questions quickly and they provide great examples to learn how to interact with the code. We are very happy with our choice to use Flexmonster!
Read full review
Pros
  • Informer is pretty user-friendly. When teaching other employees how to use Informer, I typically don't have to repeat any steps or further explain how to do certain tasks because of how user-friendly it is.
  • Reports in Informer are kept in a list that can be filtered by user, specific tags, or even by how recent the report was made or run. This makes it very quick and easy to find and run a specific report.
  • Informer has many options for downloading the report output, including text (txt), comma separated values (csv), and even PDF.
Read full review
No answers on this topic
Cons
  • Informer needs more predefined date formats in its Column Display Editor. The existing 5 do not meet everyone's needs.
  • It's a minor UI issue, but Informer's Edit Columns view stutters and displays empty space when scrolling left or right. It may be because I'm using Safari on Mac OS X, and Informer isn't designed for input devices that scroll with "momentum" (as Apple calls it).
  • The Reports Listing takes longer to load reports than I believe it should. At least a progress bar displays to tell you when it's complete.
Read full review
No answers on this topic
Likelihood to Renew
Informer has been handily meeting most of our reporting needs, and we've created a library of hundreds of reports that are used every day. They have a terrific support service to help when you have questions, and I've found them to be great at listening to what customers would like and adding new features. They are a small company that really listens and really cares, and I've been very pleased over the past few years getting to know them.
Read full review
No answers on this topic
Usability
Since I don't know code, there are sometimes calculations that are beyond my knowledge to create. It would also be great to be able to format multiple columns at once (center, for instance), rather than having to format them individually.
Read full review
Checks all the boxes! Easy to use, great out of the box feature set and fantastic support team
Read full review
Reliability and Availability
We have 10 concurrent licenses and we average between 6-8 at any given time during the day; and we host the application.
Read full review
No answers on this topic
Support Rating
Always able to get acceptable solutions in reasonable time from friendly support staff. Initial contact is always with knowledgeable person - not someone reading from a script trying to screen calls. Thanks Entrinsik for being in tune with my needs.
Read full review
Quick response to questions and feedback, excellent documentation for learning about the product and tons of examples to leverage.
Read full review
Implementation Rating
We bought the product on a Thursday morning, and we were writing reports on Friday afternoon. We did take about a month to manage the Mapping, Linking and Security to allow us to open it up across campus. We are now mapping from as many third-party vendors as we can to enable the creation of more ad-hoc reporting.
Read full review
No answers on this topic
Alternatives Considered
Our organization used to use the built in reporting tool for Datatel, but it required more knowledge about SQL so only a handful of users could actually use it. There was no customization of the output or ability to schedule the queries. If you wanted something more complex than what was available, then the programmers needed to write an extraction program to pull the data you needed
Read full review
No answers on this topic
Return on Investment
  • We have definitely improved customer service due to better reporting using Informer. All departments are better empowered to help our students in a more timely and accurate manner.
  • Using Informer has given us the ability to eliminate functionality within our ERP system and offload reporting to a data store instead of the transactional system. This has resulted in successfully upgrading our core systems and improved response times.
Read full review
No answers on this topic
ScreenShots

Entrinsik Informer Screenshots

Screenshot of Screenshot of Screenshot of

Flexmonster Pivot Table & Charts Component Screenshots

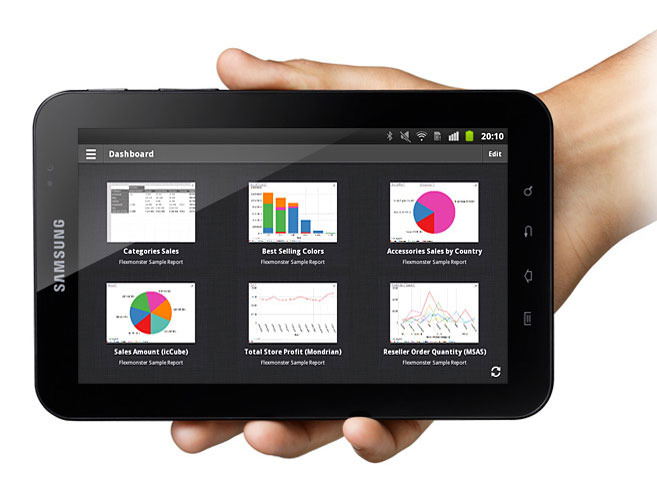
Screenshot of Pivot Component supports the printing of the Pivot view. Additionally users can export the reports into a variety of formats.Screenshot of Pivot Table Component helps you to create interactive pivot tables and charts reports for web and Flex applications. Pivot Component will provide your customers with an extremely intuitive end-user experience while creating and analyzing reports.Screenshot of Pivot Charts provide an alternative, interactive way to visualize data.Screenshot of The component will connect to any database: MS SQL, MySQL, Oracle, PostgreSQL - using simple script generating CSV output to enable real-time business analysis. Pivot Component is full browser-side component, thus you can use any desired server-side to generate CSV data.Screenshot of Pivot Table Component can connect to OLAP cubes via XMLA protocol. XMLA is XML for Analysis - an industry standard for data access in analytical systems, such as OLAP and Data Mining.Screenshot of Start mobile business reporting with the Flexmonster mobile application. It can be downloaded to your tablets from Google Play or Apple App Store.