Dynatrace vs. LogicMonitor

Overview
ProductRatingMost Used ByProduct SummaryStarting Price
Dynatrace
Score 8.0 out of 10
N/A
Dynatrace is an APM scaled for enterprises with cloud, on-premise, and hybrid application and SaaS monitoring. Dynatrace uses AI-supported algorithms to provide continual APM self-learning and predictive alerts for proactive issue resolution.
$0
per synthetic request
LogicMonitor
Score 8.4 out of 10
Mid-Size Companies (51-1,000 employees)
LogicMonitor’s SaaS-based platform, LM Envision, enables observability across on-prem and multi-cloud environments. It provides IT and business teams operational visibility and predictability across their technologies and applications.N/A
Pricing
DynatraceLogicMonitor
Editions & Modules
Synthetic Monitoring
$0.001
per synthetic request
Kubernetes Platform Monitoring
$0.002
per hour for any size pod
Real User Monitoring
$0.00225
per session
Application Security
$0.018
per hour for 8 GIB host
Infrastructure Monitoring
$0.04
per hour for any size host
Full-Stack Monitoring
$0.08
per hour for 8 GIB host
Enterprise
Contact sales team
Website Monitoring
Contact sales team
Offerings
Pricing Offerings
DynatraceLogicMonitor
Free Trial
NoYes
Free/Freemium Version
NoNo
Premium Consulting/Integration Services
NoNo
Entry-level Setup FeeNo setup feeNo setup fee
Additional DetailsOur platform is broken down into Pro and Enterprise Pricing. Pro includes monitoring for all of your cloud, hybrid, and on-premises infrastructure. Our Enterprise package includes all of this, plus our AIOps and Machine Learning functionality that provides dynamic thresholds, root cause analysis, anomaly detection and more! LogicMonitor only charges by the device. What is considered a device? A device is anything with an IP address that you want to monitor, including a physical device or a cloud resource. This means multiple data sources under the same IP address can be monitored for the same price. Unlike some monitoring platforms. we don’t charge per node, interface, or metric.
More Pricing Information
Community Pulse
DynatraceLogicMonitor
Best Alternatives
DynatraceLogicMonitor
Small Businesses
InfluxDB
InfluxDB
Score 8.8 out of 10
Veeam ONE
Veeam ONE
Score 8.2 out of 10
Medium-sized Companies
Sumo Logic
Sumo Logic
Score 9.4 out of 10
Icinga
Icinga
Score 7.8 out of 10
Enterprises
NetBrain Technologies
Score 9.2 out of 10
Zabbix
Zabbix
Score 8.7 out of 10
All AlternativesView all alternativesView all alternatives
User Ratings
DynatraceLogicMonitor
Likelihood to Recommend
8.0
(0 ratings)
9.6
(0 ratings)
Likelihood to Renew
9.0
(0 ratings)
6.7
(0 ratings)
Usability
7.9
(0 ratings)
8.3
(0 ratings)
Availability
8.2
(0 ratings)
9.1
(0 ratings)
Performance
7.3
(0 ratings)
9.1
(0 ratings)
Support Rating
8.2
(0 ratings)
9.3
(0 ratings)
In-Person Training
8.2
(0 ratings)
8.2
(0 ratings)
Online Training
8.2
(0 ratings)
7.3
(0 ratings)
Implementation Rating
7.9
(0 ratings)
9.8
(0 ratings)
Configurability
7.3
(0 ratings)
9.1
(0 ratings)
Ease of integration
7.3
(0 ratings)
7.3
(0 ratings)
Product Scalability
7.3
(0 ratings)
9.1
(0 ratings)
Vendor post-sale
8.2
(0 ratings)
9.1
(0 ratings)
Vendor pre-sale
8.2
(0 ratings)
9.1
(0 ratings)
User Testimonials
DynatraceLogicMonitor
Likelihood to Recommend
Dynatrace is well suited to a number of tasks. It is important to determine who the end users are and gather good information to tailor their experience accordingly. For instance, business/marketing should not have access to some of the more technical data, and business metrics can be a distraction for IT operations personnel.
Read full review
We have several government departments and universities as our clients, and we conduct online examinations for them. Therefore, our servers require additional security to prevent unauthorized access to our systems remotely without our permission. We were performing an examination for one of our clients when someone from outside attempted to access our systems by creating a backdoor to our servers. Our team was busy handling the examination process and ensuring its smoothness. However, thanks to LogicMonitor, we were alerted at the right time, and we were able to save our data and clients' information with its help.
Read full review
Pros
  • We loved Dynatrace's ability to show the data flow - from the front end points through the back end points straight to the database and various API's. It was advanced in its data visualization. This is useful for debugging - showing when/where the errors are. It can even enable non-technical individuals in the corporation to help debug
  • Dynatrace has some great highly customizable integration options as well as monitoring. You can configure your layout & integration options to create custom monitoring alerts for your applications performance. Further you can increase the extensibility of using a REST API on your architecture.
  • Some advanced dev-ops systems are utilizing Kubernetes/docker aswell as Node.JS - Dynatrace was able to log and help understand all of our dev-ops needs. It gave us native alerts based off of deviations from the baseline that we set during initial configuration. These metrics are priceless.
Read full review
  • LogicMonitor is very customizable. We can build whatever modules we need, because it uses standard protocols like HTTPS, SNMP and WMI to gather data and metrics.
  • We like that LogicMonitor is an agentless solution for our use case. Not all customers will allow an agent-based approach to 3rd party tools.
  • LogicMonitor has thousands of out of the box modules, which work on their own and also act as good baselines for the ones that we will end up customizing more. We are rarely starting at zero when we decide to do something new with LogicMonitor.
  • LogicMonitor has great documentation, and support has been helpful in the instances where we've needed them.
Read full review
Cons
  • Dynatrace does not monitor easily on AIX OS.
  • Dynatrace does not monitor easily on a C-based application.
  • The way DPGR is addressed by Dynatrace is not very complete, and not clear. One thing is to mask the IP and request attributes but is not enough, the replay session feature is great but raises serious questions about user tracking.
Read full review
  • Because of the rapid change in technology, maintaining DataSources to the most current level can be time-consuming for staff.
  • The network discovery and mapping capabilities are not as robust when compared to other solutions
  • While it can back-up configuration files on devices, it does not have the ability to push or modify configuration files back to devices.
Read full review
Likelihood to Renew
We have got tremendous support and response from the dynatrace support team as well as the larger community. We still have issues like the lack of role based administration, but we are told that it may be coming in a future release. The team is very supportive and has assisted us in several tough situations.
Read full review
This product has met virtually all of our needs. It was easy to implement and has been simple to support. Customization has been intuitive with many options available. They keep adding features and expanding available options. The future of LogicMonitor looks even better than it is today which is very promising. The management and support teams at LogicMonitor are always helpful
Read full review
Usability
Dynatrace is great to use once you understand how to use it correctly and get used to the layout of it. While I do not actively use it every day, whenever I do use it, I do have to get refamiliarized with it. However, once you have your dashboards setup correctly with the data that you want to see when you first login to Dynatrace, it's amazing.
Read full review
Set up is super easy. Just stand up a small Linux or Windows server to act as a collector. There are no agents to install on monitored devices and all you need is SNMP or WMI access. When creating dashboards, all you have to do is find the widget on the device you want to show up and choose the menu option to add it.
Read full review
Reliability and Availability
Our environment, it never goes down therefore is always available.
Read full review
No answers on this topic
Performance
We have not seen where it does slow down an application.
Read full review
No answers on this topic
Support Rating
I wish I could have given the ten points but based on my experience in past I am reducing by two points as the penalty. But I am sure that it will have improved in the past few months. They need some improvement on ticket handling. Overall I appreciate some of the support folks who responded quickly and also were ready to jump on the Webex and get the problem understood to fix it.
Read full review
The sales team support we received was top notch. They worked hand in hand to make sure the product met all expectations. So far we have not really had to work with support that much; we have worked with setup team after purchase to deploy product fully. No issues so far and we are four weeks in.
Read full review
In-Person Training
We did both online and in house training - they used our system so it made more sense.
Read full review
Add good training
Read full review
Online Training
The training was done on our time and with our system.
Read full review
The training is good but room to improve
Read full review
Implementation Rating
Using Dynatrace support services to assist (and lead) the implementation was extremely important.
Read full review
I did not truly dedicate myself to implementing LogicMonitor. However, I overheard the IT team members explain that "LogicMonitor is perfect for us as it has made most of the work automated, and implementation and training sessions were perfect for us." Thus, I can state that everything went smoothly with our implementation.
Read full review
Alternatives Considered
Like I mentioned earlier, Dynatrace is a great tool but comes with a heavy price tag. On the other hand, Foglight offers a slightly lower level of expertise in application monitoring but fulfils almost all the requirements you would commonly have. The only major feature lacking in Foglight is the predictive monitoring feature. If you are an SME struggling with budgets, then predictive monitoring is something you can certainly live without.
Read full review
We did not use software like LogicMonitor for the same work before, but I must say that my experience with LogicMonitor has been outstanding so far. It helps me to be free of tension. I can now concentrate on the actual work I was hired to do for my company.
Read full review
Scalability
Dynatrace can be used to monitor may software tools
Read full review
No answers on this topic
Return on Investment
  • Thanks to Dynatrace we have been able to effectively challenge and collaborate with service providers and outsourced IT teams.
  • Thanks to Dynatrace we have reduced MTTR on troubleshooting by a magnitude of four.
  • The performance analyses our team has done with Dynatrace earned us trust among management, business teams, and IT teams.
Read full review
  • We have been able to eliminate multiple tools through LogicMonitor's ability to use collectors to run scripts and collect any numerical data from any reachable endpoint along with the customization and widgets available for dashboards. This has allowed for reduced costs and consolidation to a single point of view.
  • The ability to grant our clients access to see their data in real time has improved both our client satisfaction surveys and attributed to a few point gain in our NPS score. The ease of getting to the data has also reduced the quoting time for our sales teams during renewals to quantify what a client is consuming.
  • The amount of data that LogicMonitor collects affords our technicians a wide area of review when trying to isolate an issue and find a root cause. With the standard out of box data that is collected we have often been able to set a new threshold on something not previously thought of to proactively alert us in the future after identifying those root causes. This has reduced our Major Issues from 3-5 per month to usually 1-2 or less per quarter.
Read full review
ScreenShots

LogicMonitor Screenshots

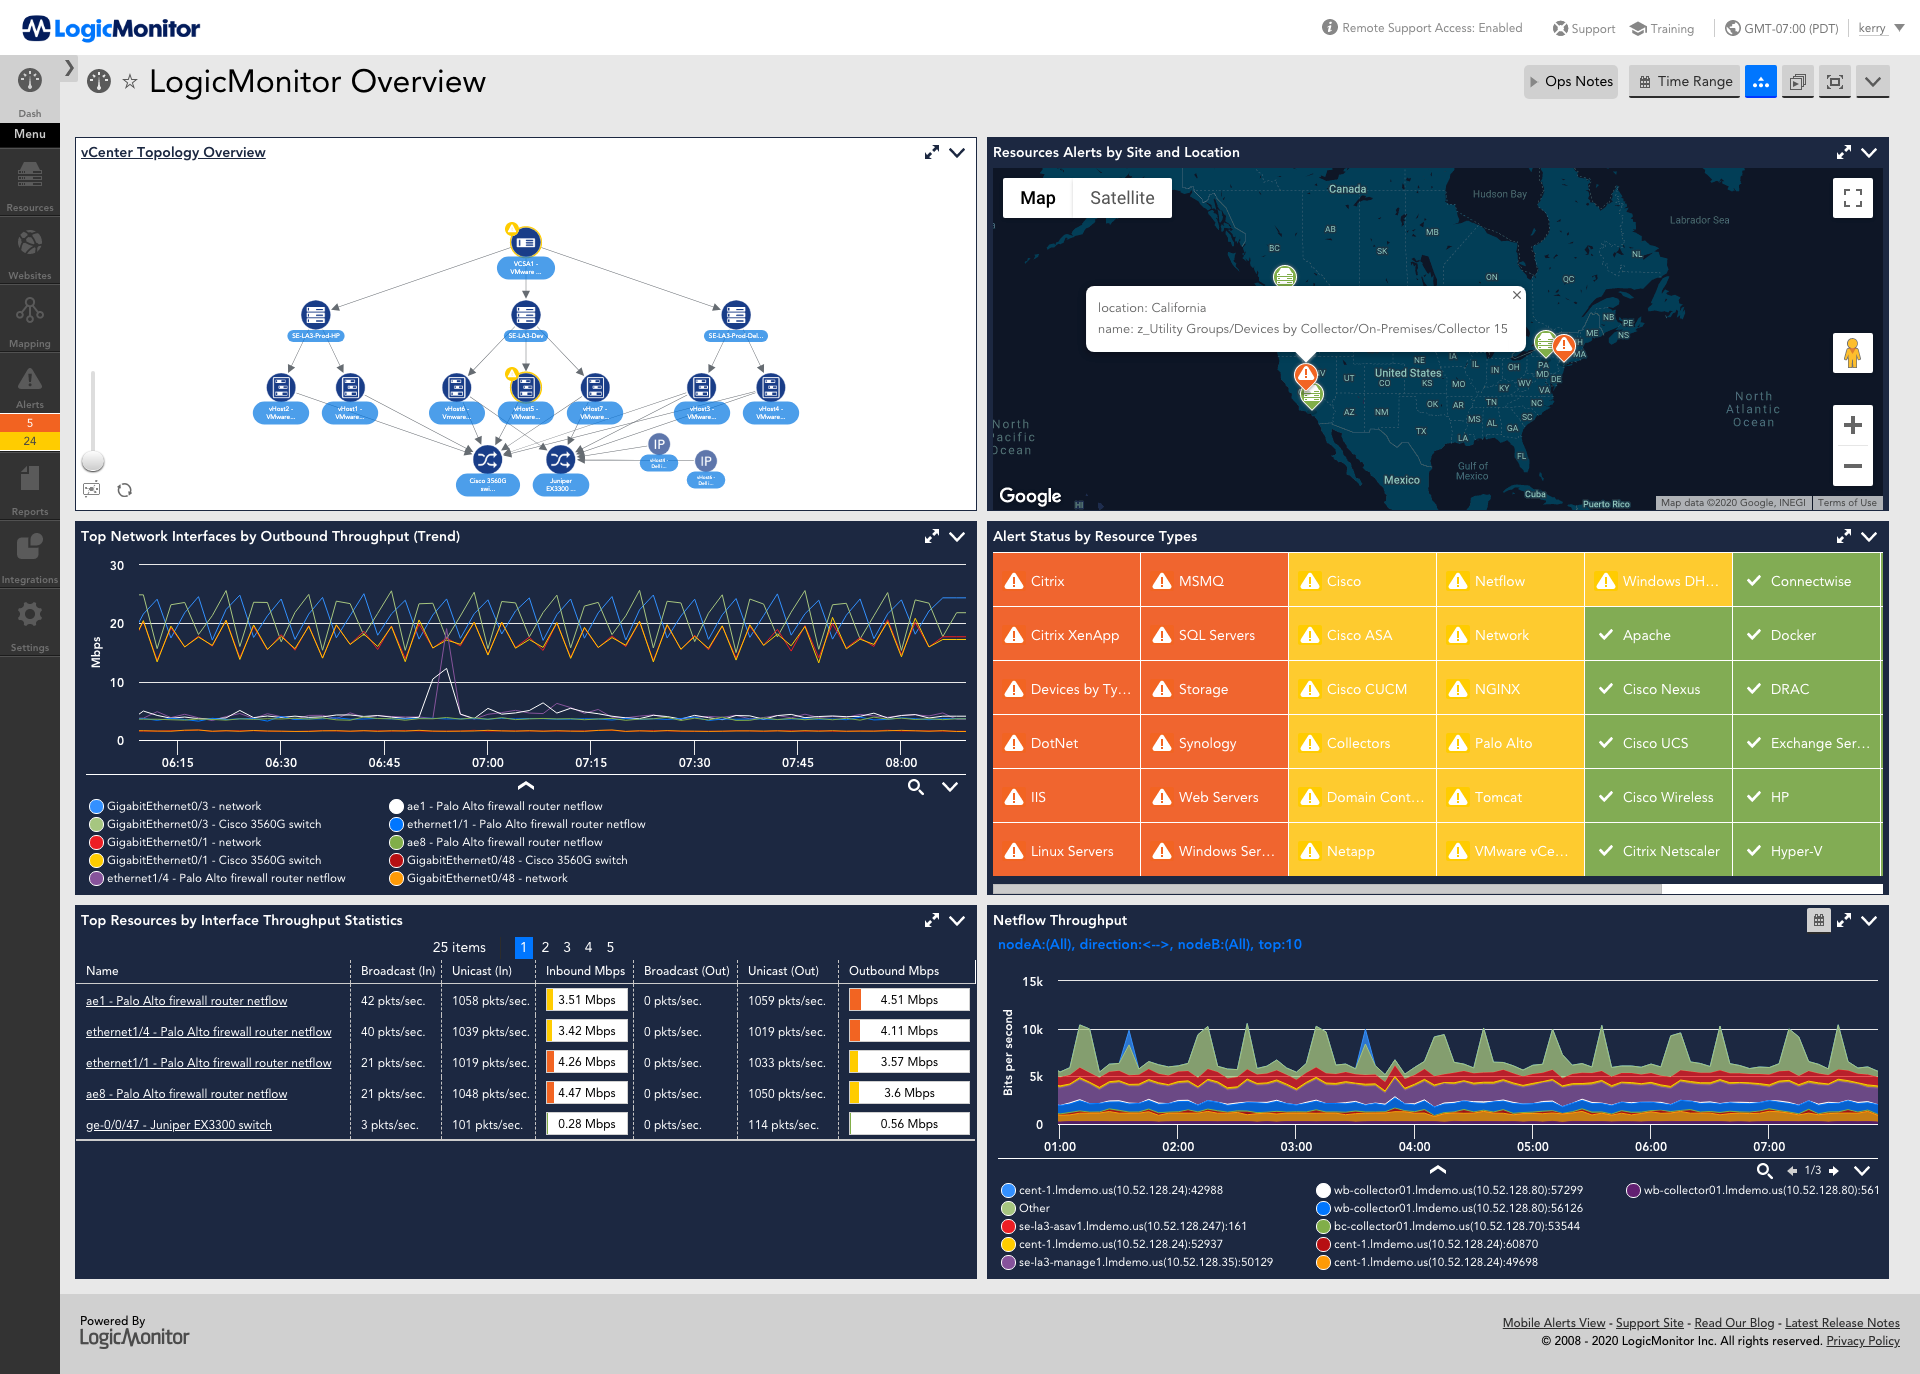
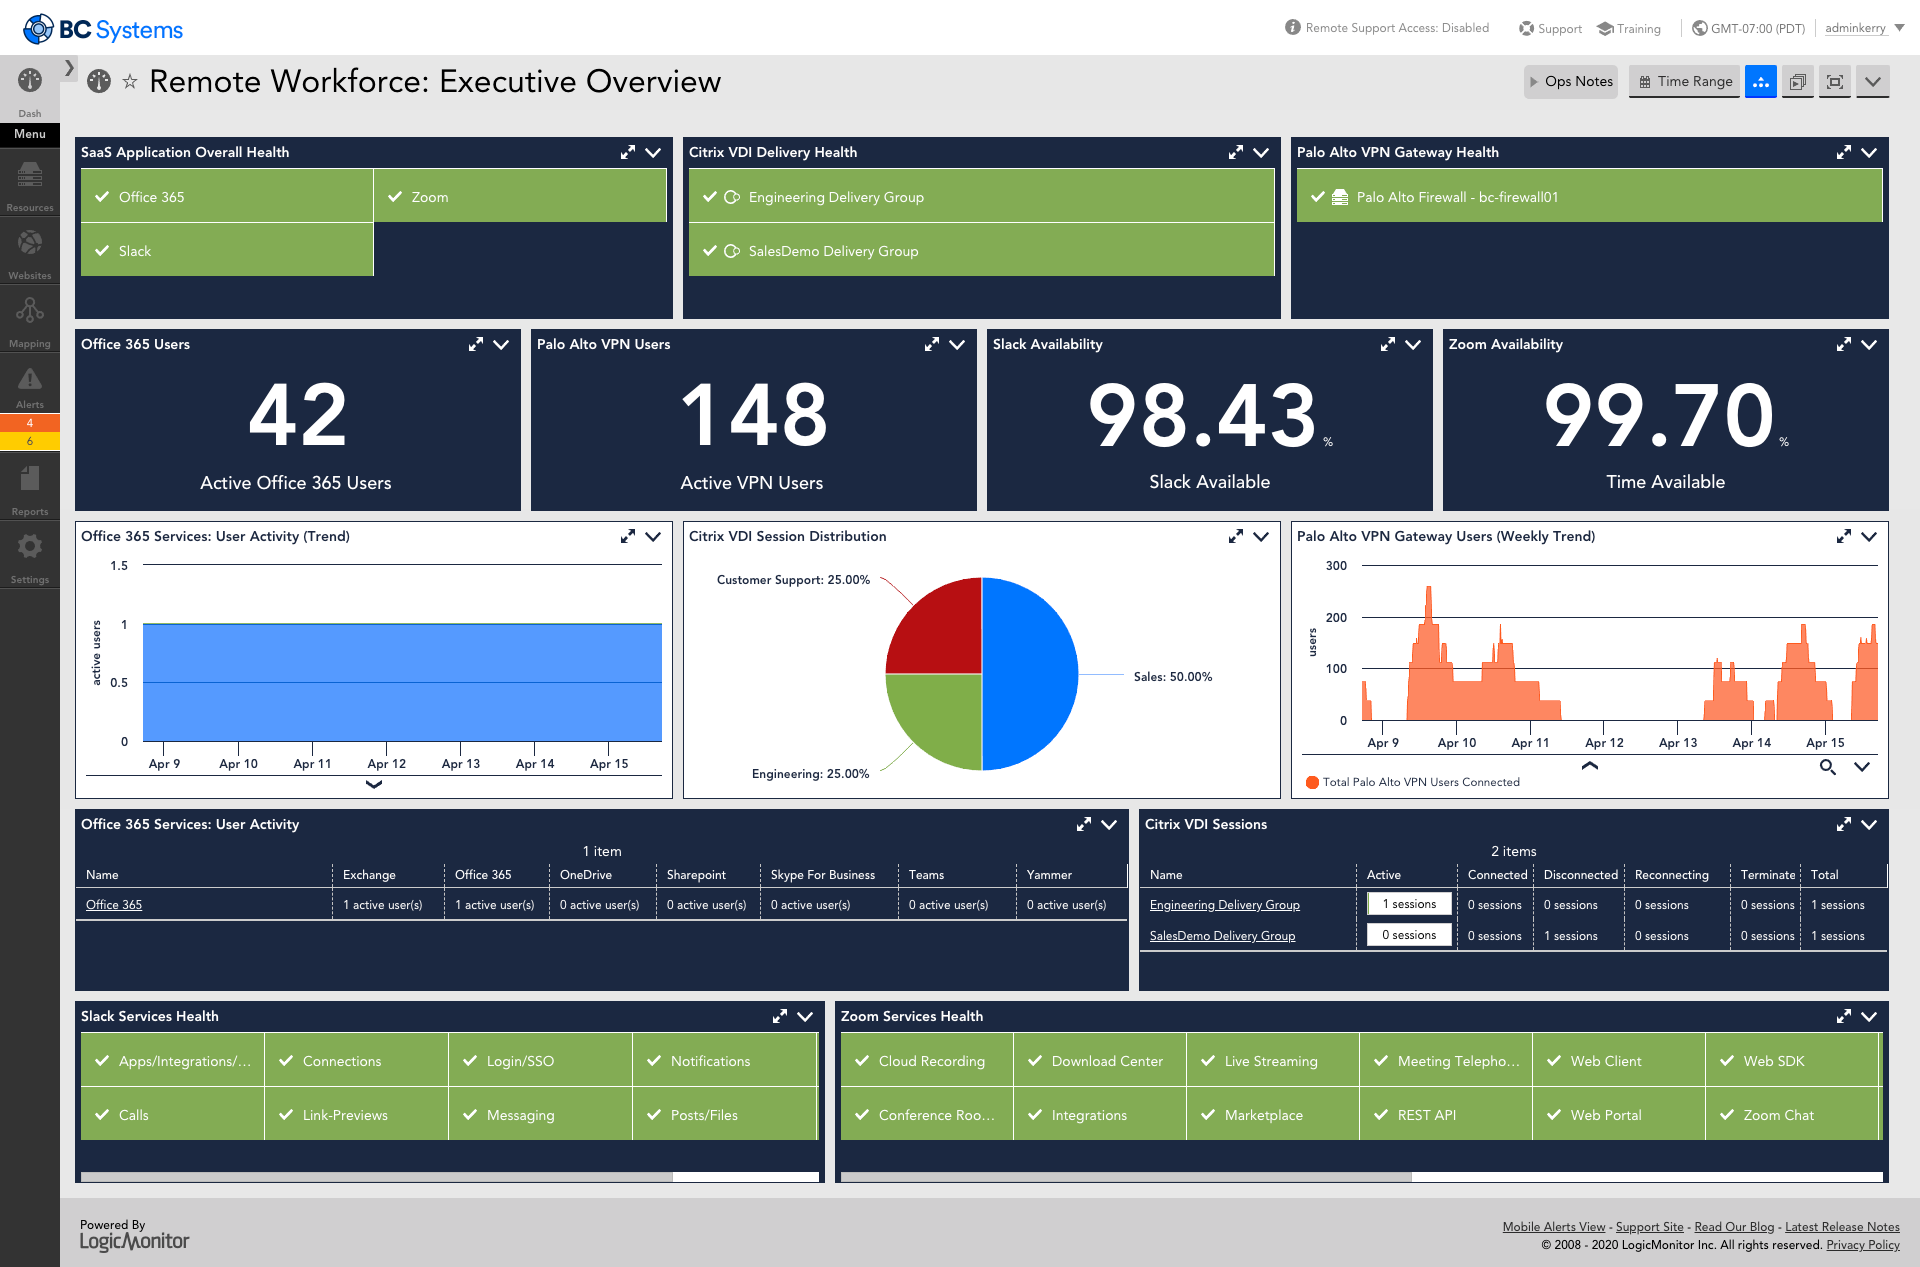
Screenshot of AIOps features for enterprises using technology or hybrid environments with cloud and container resources. LogicMonitor can be used to monitor and improve the performance of complex enterprise networks with dynamic thresholds, topology mapping, anomaly detection, and root cause analysis.Screenshot of LM Envision's comprehensive monitoring and observability capabilities across the IT infrastructure, that help to identify alerts for the most important systems while ensuring the user experience is uninterrupted across the globe.Screenshot of Monitoring that ensures servers and the applications running on top of them are highly available. Helps resolve issues and optimize resource consumption for the server infrastructure.Screenshot of LogicMonitor remote workforce monitoring, which ensures that employees are connected to the systems that keep them productive and provide proactive insight into dispersed systems and third-party outages.Screenshot of Unified cloud monitoring across a hybrid multi-cloud ecosystem.Screenshot of LM Logs delivering log analysis at enterprise scale.