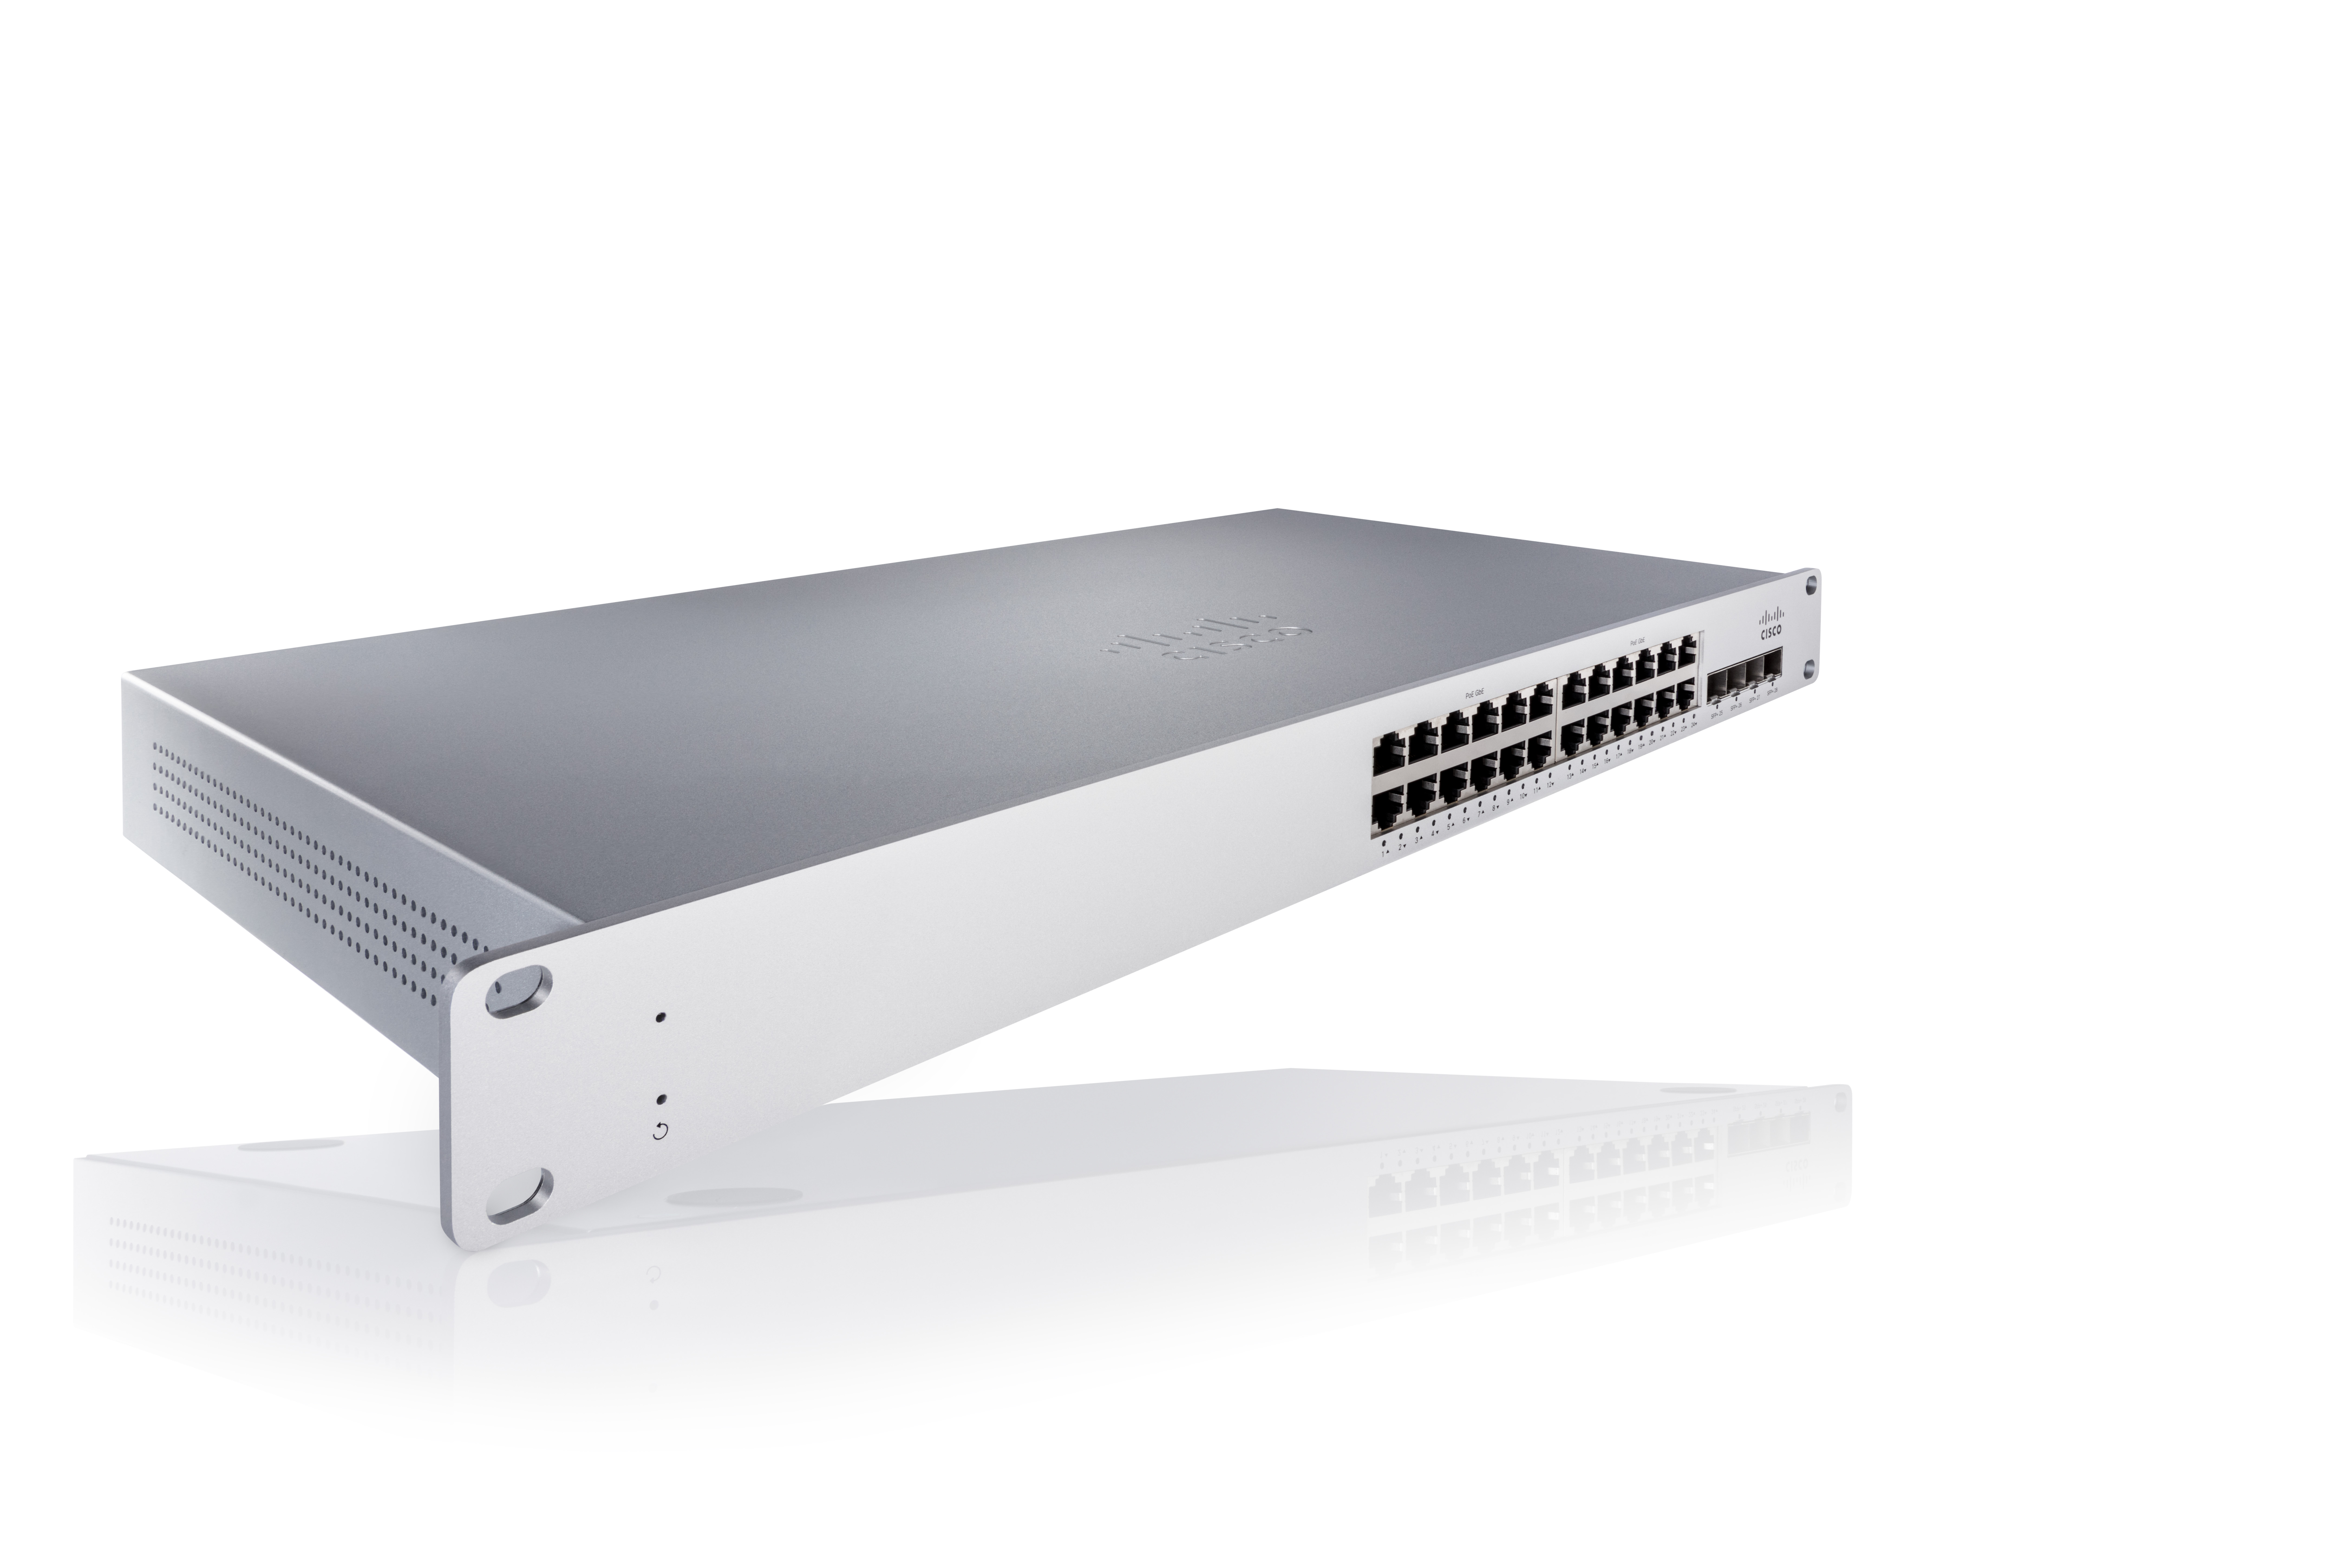
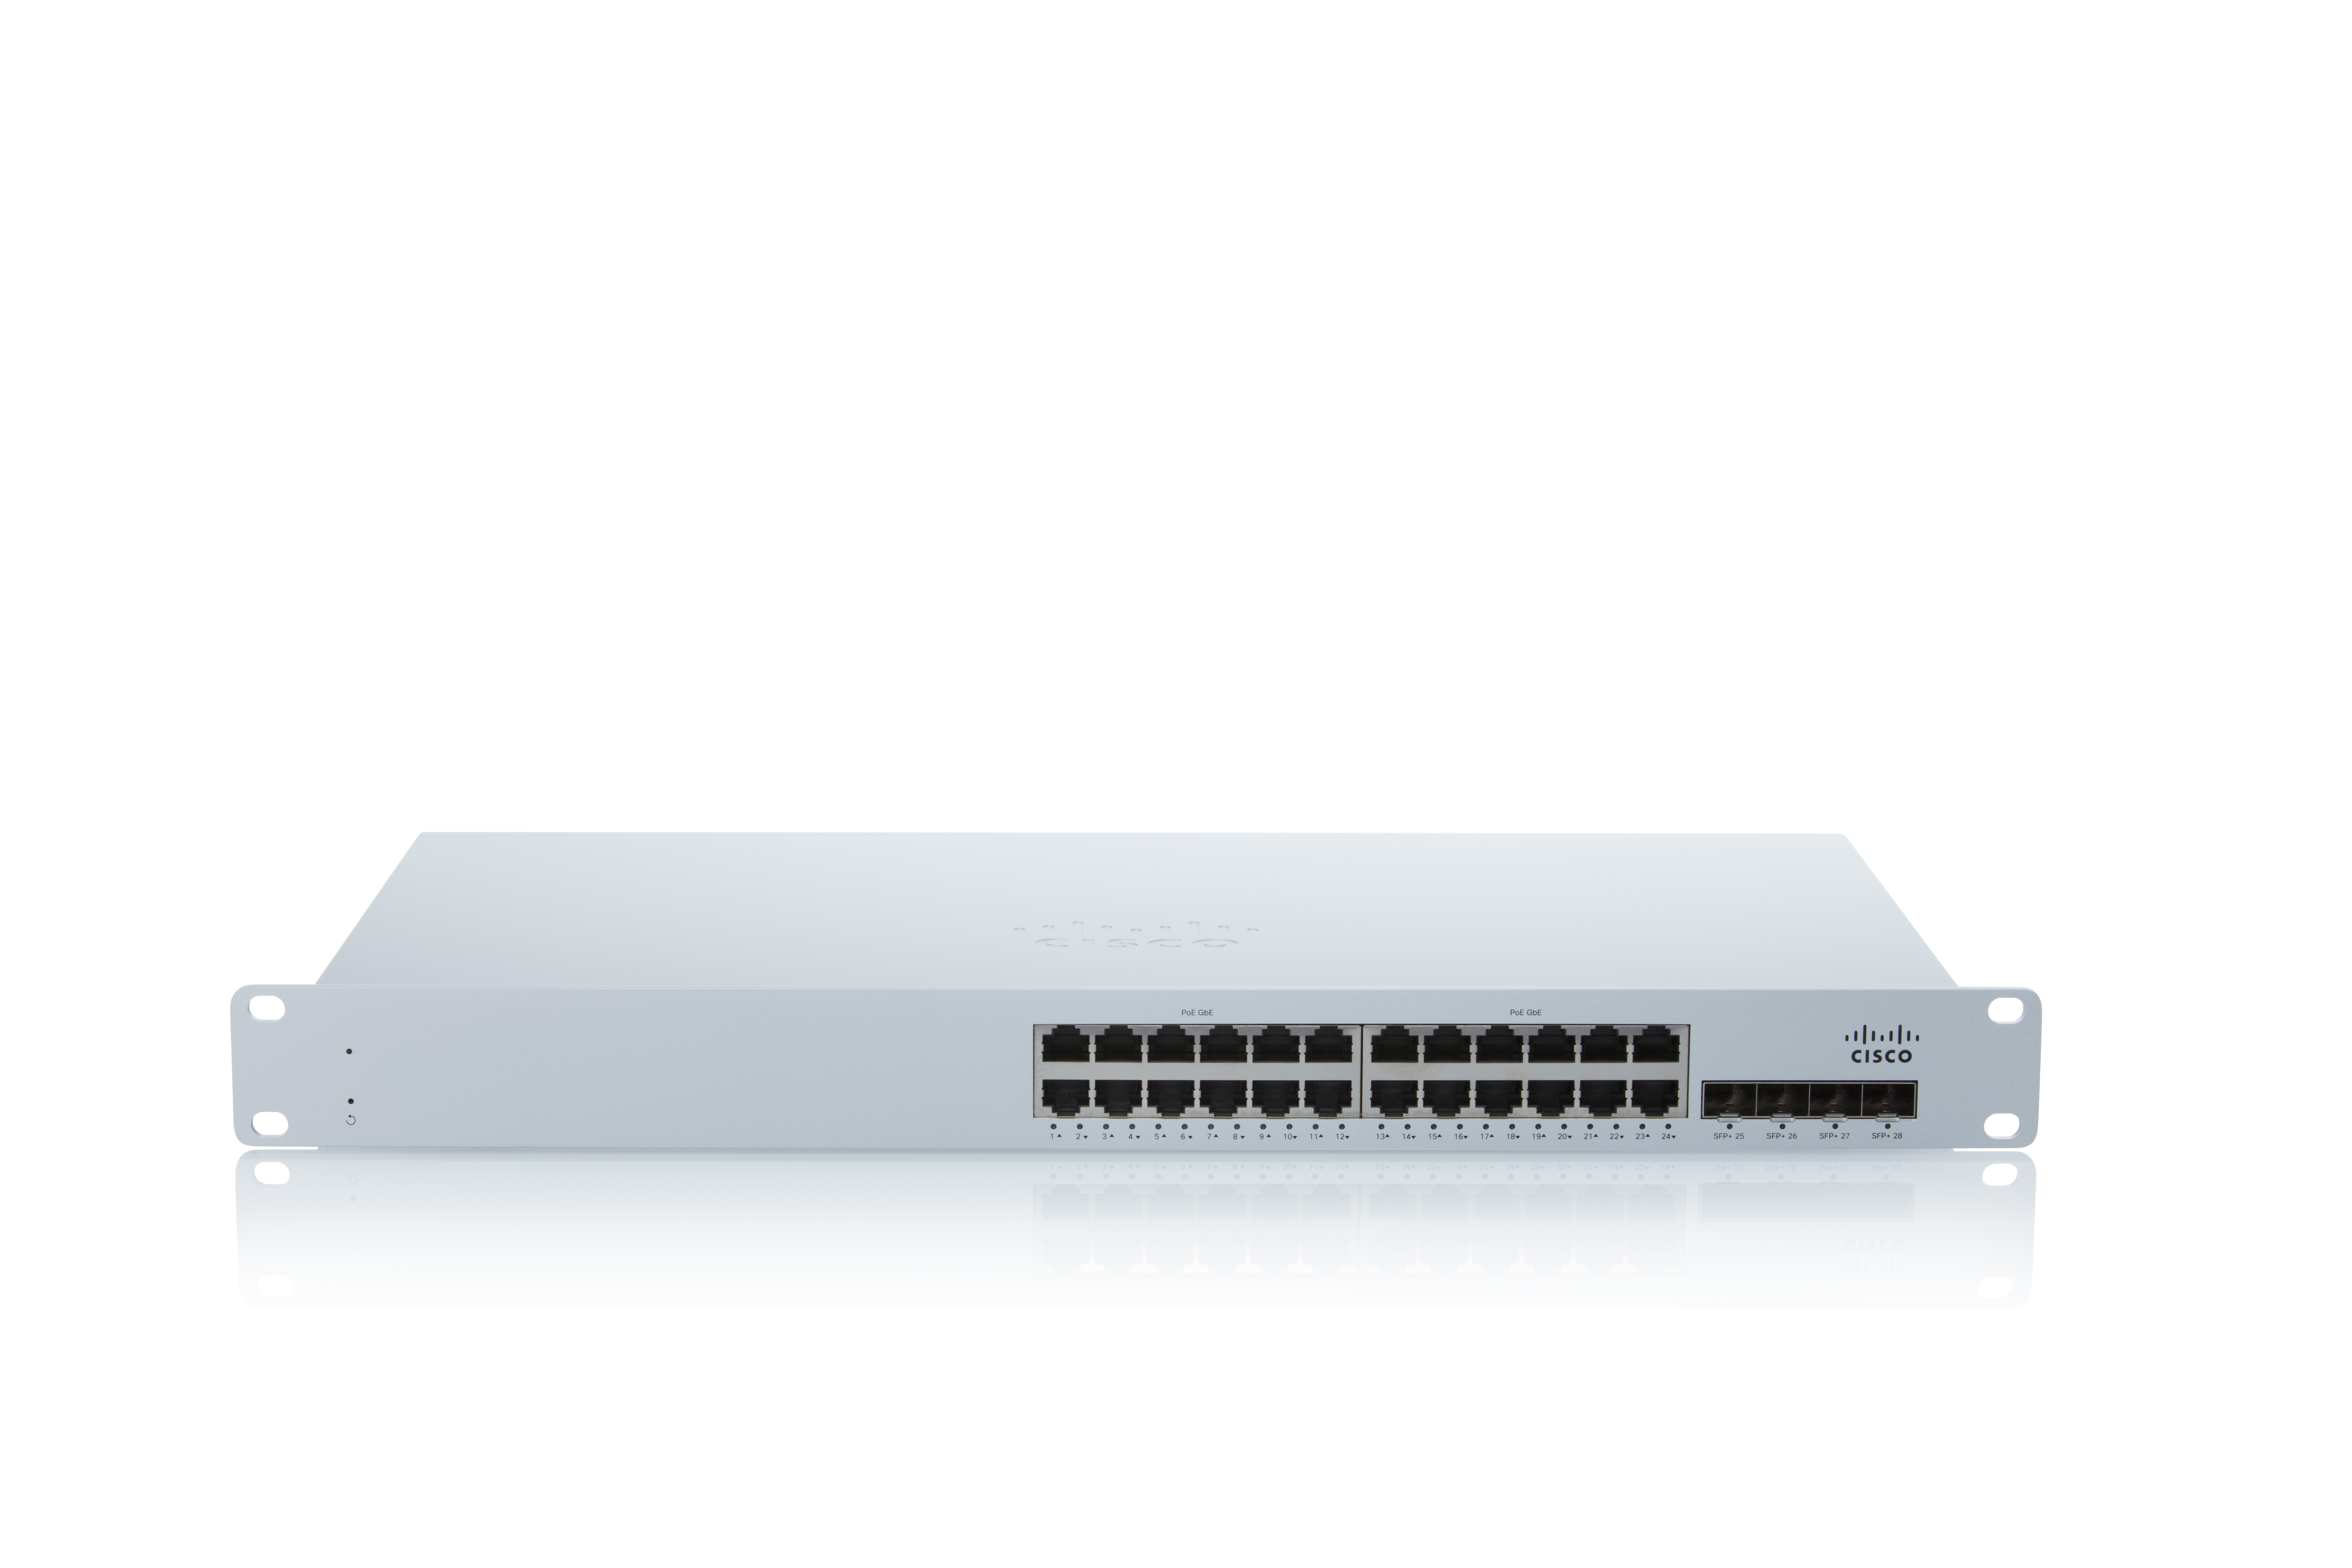
As a cloud-managed network management solution, the Cisco Meraki Dashboard enables users to provision, configure, and troubleshoot global networking and IoT deployments.
N/A
SolarWinds Hybrid Cloud Observability
Score 8.7 out of 10
N/A
SolarWinds® Hybrid Cloud Observability aims to provide a comprehensive, integrated, and full-stack solution designed to optimize performance, improve availability, and reduce remediation time by correlating data from across the IT ecosystem, including networks, servers, applications, databases, and more.
$5
per month per node
Pricing
Cisco Meraki Dashboard
SolarWinds Hybrid Cloud Observability
Editions & Modules
No answers on this topic
Essentials
$5
per month per node
Advanced
$9
per month per node
Offerings
Pricing Offerings
Cisco Meraki Dashboard
SolarWinds Hybrid Cloud Observability
Free Trial
Yes
Yes
Free/Freemium Version
No
No
Premium Consulting/Integration Services
No
No
Entry-level Setup Fee
No setup fee
No setup fee
Additional Details
—
Pricing is set per node, per month, and billing is annual. The prices listed are base prices that could increase depending on your environment. Please speak to a representative to get a quote.
Cisco Meraki Dashboard is great for NOC teams with little network experience at helping give them all the tools they need to do the job and become more efficient with networks. From easy RMA processes to metric gathering the Cisco Meraki Dashboard does it all very well. The licenses are a problem for a lot of companies since there are no guarantees the product stays online and certain integrations like ThousandEyes are overlooked due to the additional cost despite it being a great product.
For mid-market and larger, HCO provides a highly available single pane of glass. The user and group management provides a granular ability to deploy to the various areas of the support and engineering teams. Integration to ITSM platforms ensures that information from the platform flows in real time to the right people.
More granular controls over devices. It definitely feels like, especially when you come from a CLI environment and you're working in a command line interface and then going into the dashboard, you can feel restricted sometimes because if they don't have the button you can't press it. So more buttons.
Please fix the time zones issue. Events are in UTC, Charts in the user's Local Time, Alerts come in through with Main Server timestamp - it's all over the place & it's been like that for so long. We are a large corp, the teams span time zones and trying to work with teams across the globe is made so difficult by this.
The inability to ingest the tags from AWS Cloud watch and the countless posts / feature requests on thwack complaining about this that just get ignored. It's such a basic feature of Cloud & I don't want to have to own a different product to use such an fundamental part of cloud.
Maintenance Windows - why can we not set a reoccurring window from the web ui in 2022?
SAM - Manage applications, why is there no search bar to filter through applications. When you scale out to enterprise size this is so annoying trying to guess which page to land on to find the application / device I'm looking for.
Half baked features being released - Log Analyzer shipped with no resources for the node details page. The Free version from 2016 had more available in it.
At the time of writing this, it appears that Cisco Meraki Dashboard has finally integrated a Cisco IOS XE output window into the dashboard. This is a massive step in the right direction and something that it was dearly missing. At the moment, we do not have this integration and so a lot of the times, we have to navigate via several tools menus to get the info we need instead of being able to run a quick command.
A number of networks we've taken over were using Ubiquiti Unifi, which is an okay solution, but a lot more cumbersome to manage. We've found the Cisco Meraki Dashboard system much more intuitive and way less time-intensive. Simple things like setting up dedicated DHCP entries or poking holes in VLAN firewalls are way easier in Cisco Meraki Dashboard.
Solarwinds has the best overlap of the two others I've mentioned - the other two tools (Datadog and Dynatrace) are great in their own way but Solarwinds is just good at everything; if I had to pick one tool of the above, it would be Solarwinds for the compatibility and ease of use, the other tools are more focused on being great at certain things while Solarwinds is the jack of all trades.
When there's an issue with communication to the cloud. EX: unable to fetch configs. This due to like new device being installed or if you have to factory reset the device. This has been a negative impact.
Incorrect status. Sometimes the status of the device or network is not reflected as it should be. This has had a negative impact in the past. However, for the most part, the Status is fairly accurate.
Incident response has been very good. Anytime an issue has been reported to Cisco regarding Cisco Meraki Dashboard, the issue is quickly investigated and doesn't take long to resolve.
Customer support and Cisco's technical team has been very helpful and responsive.