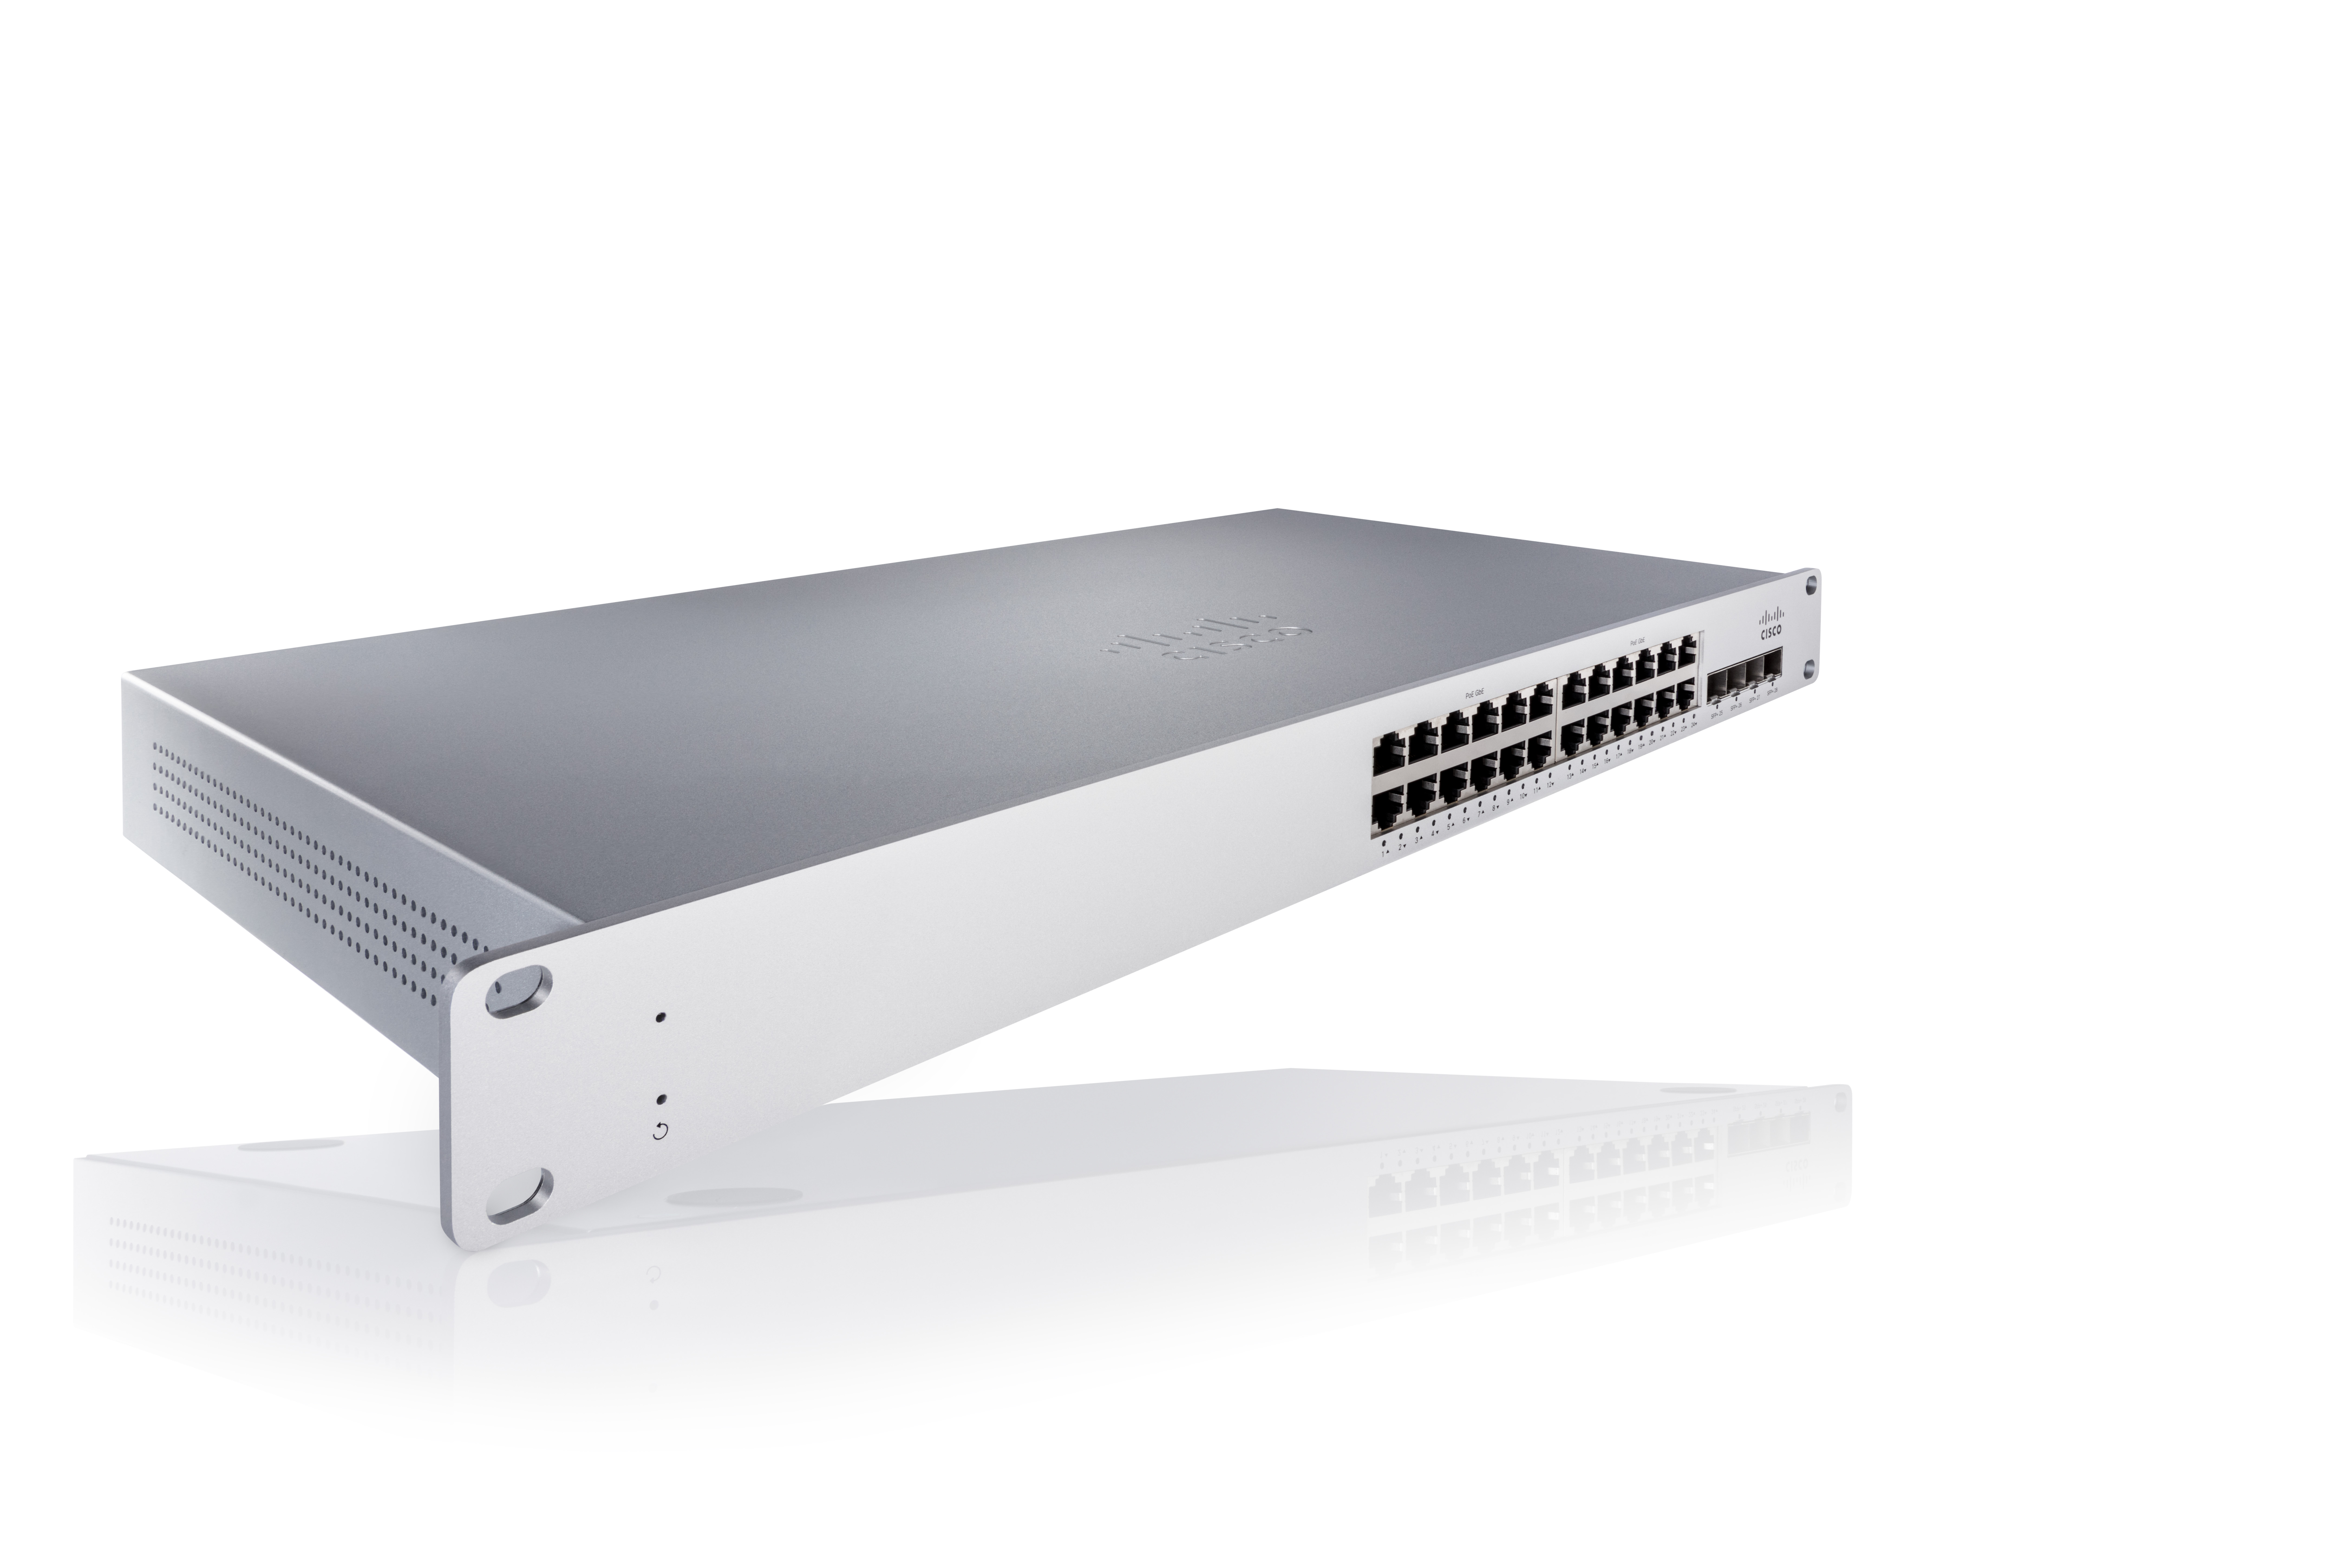
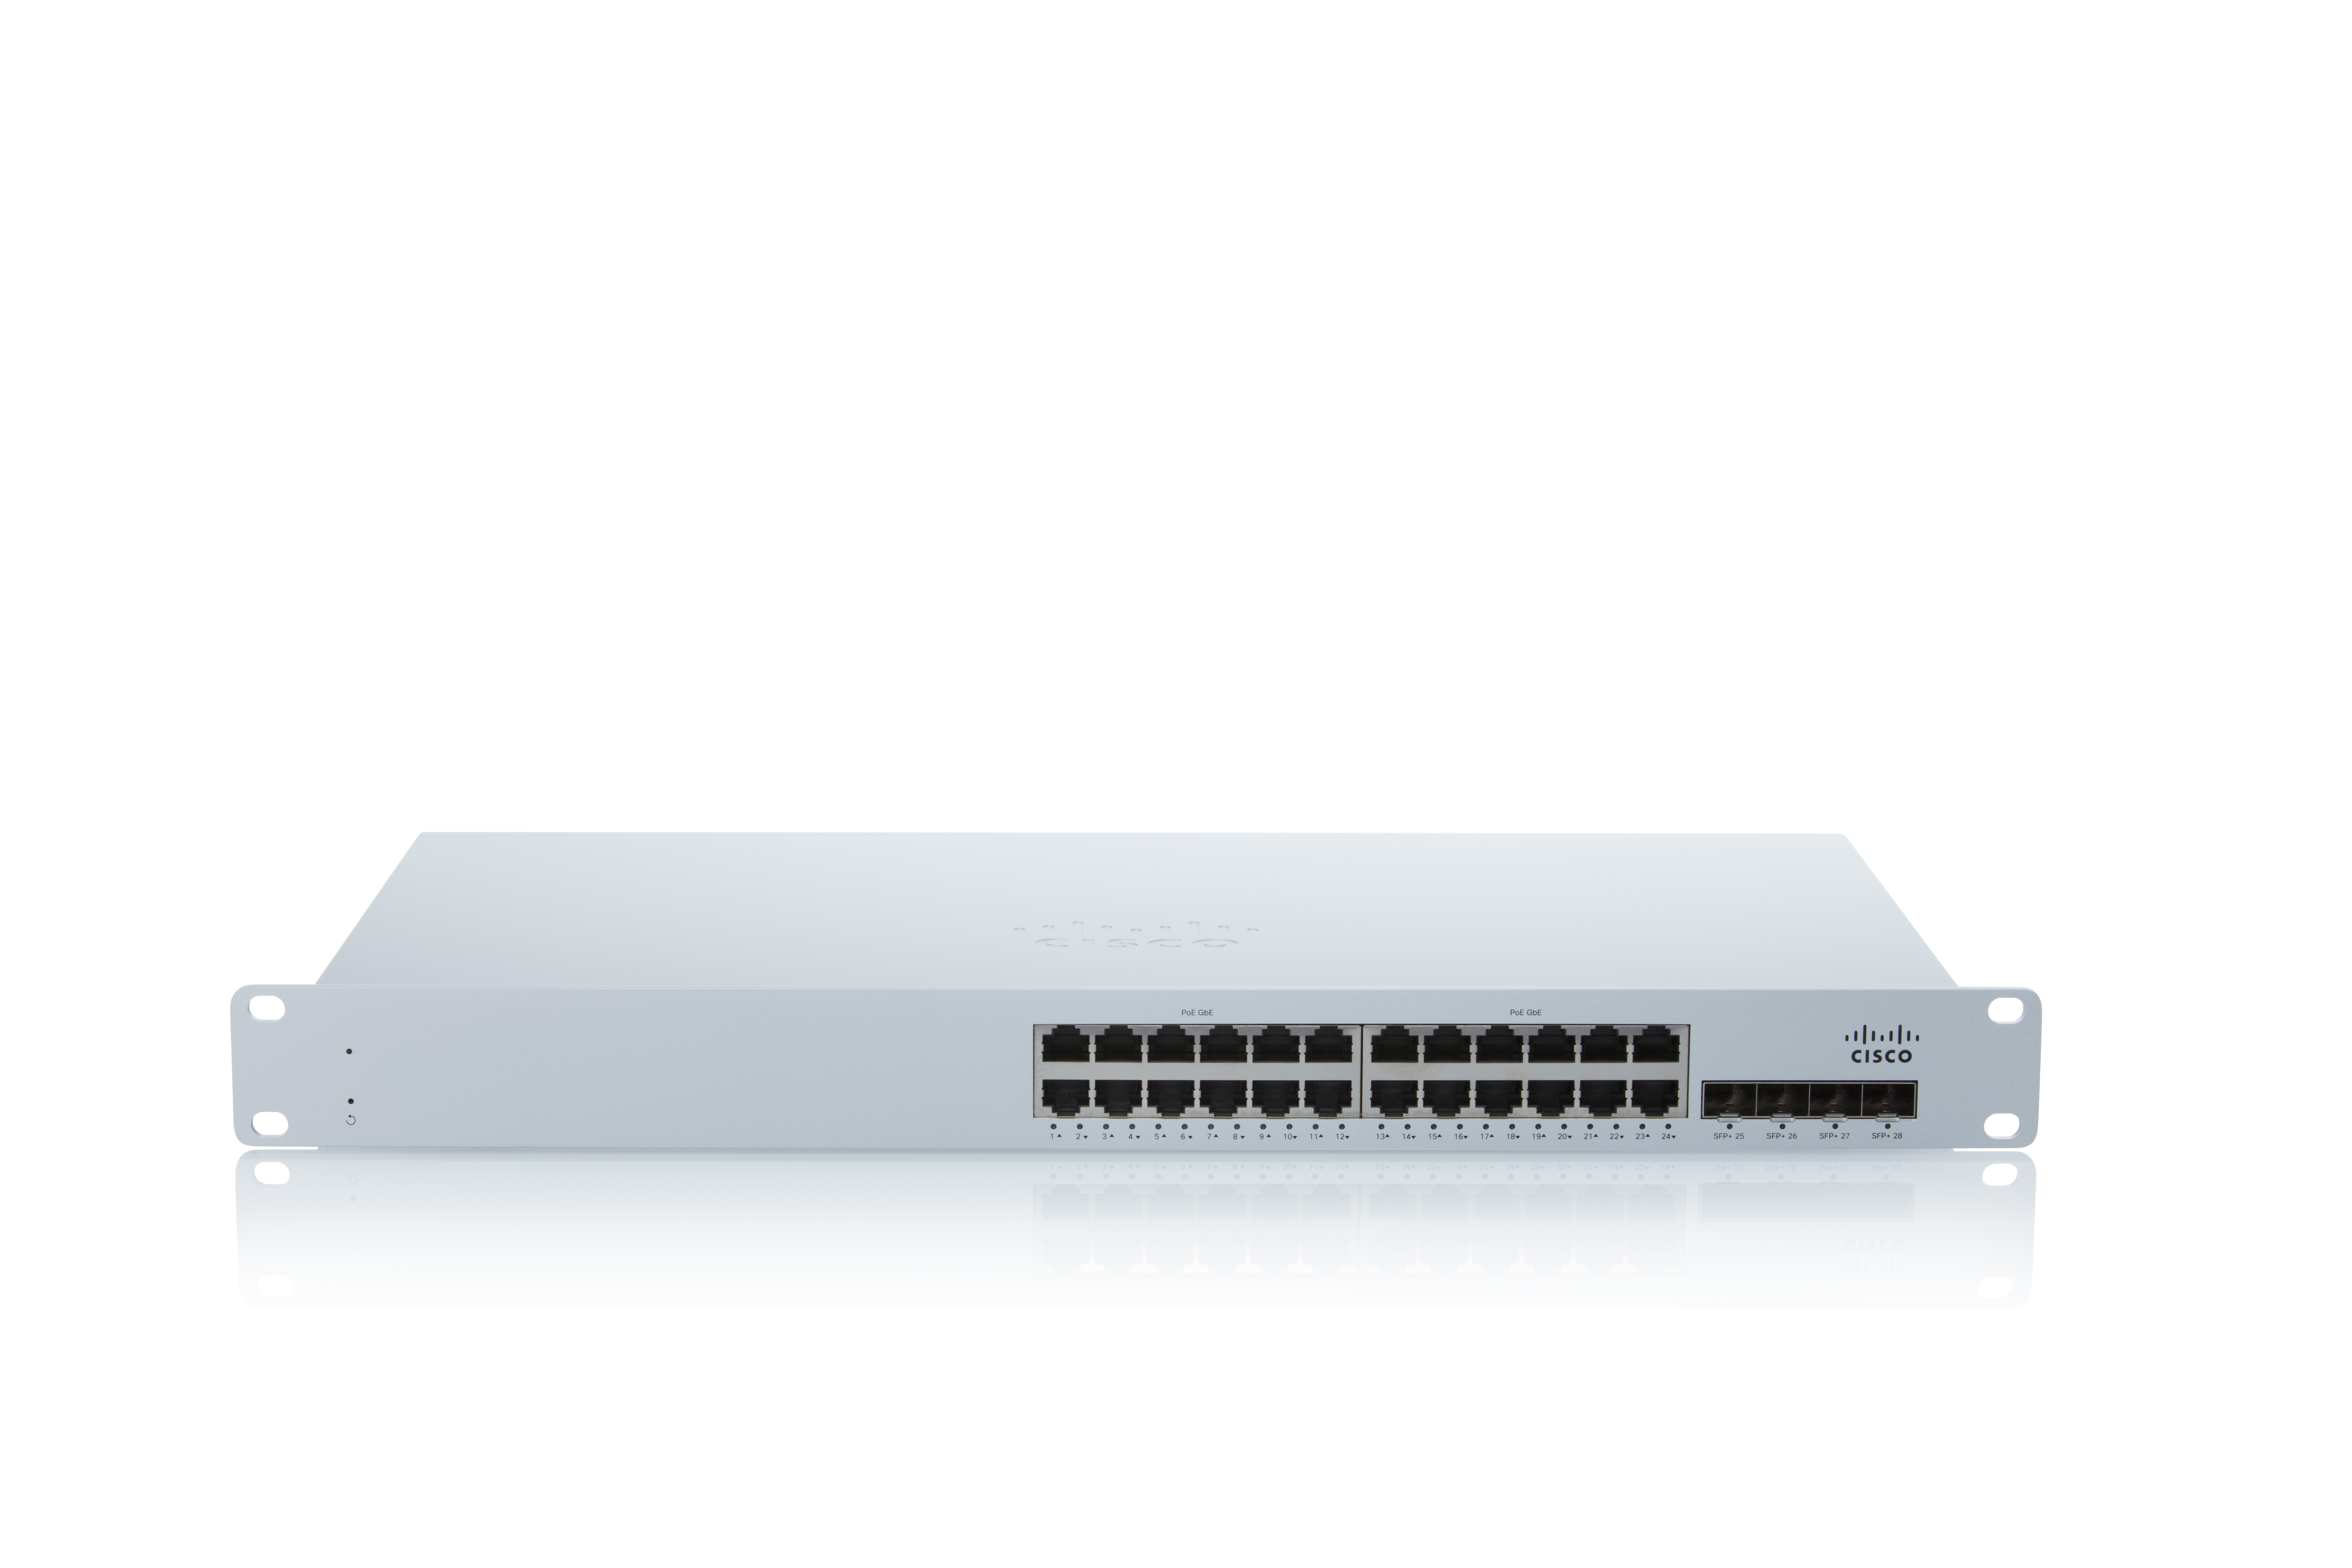
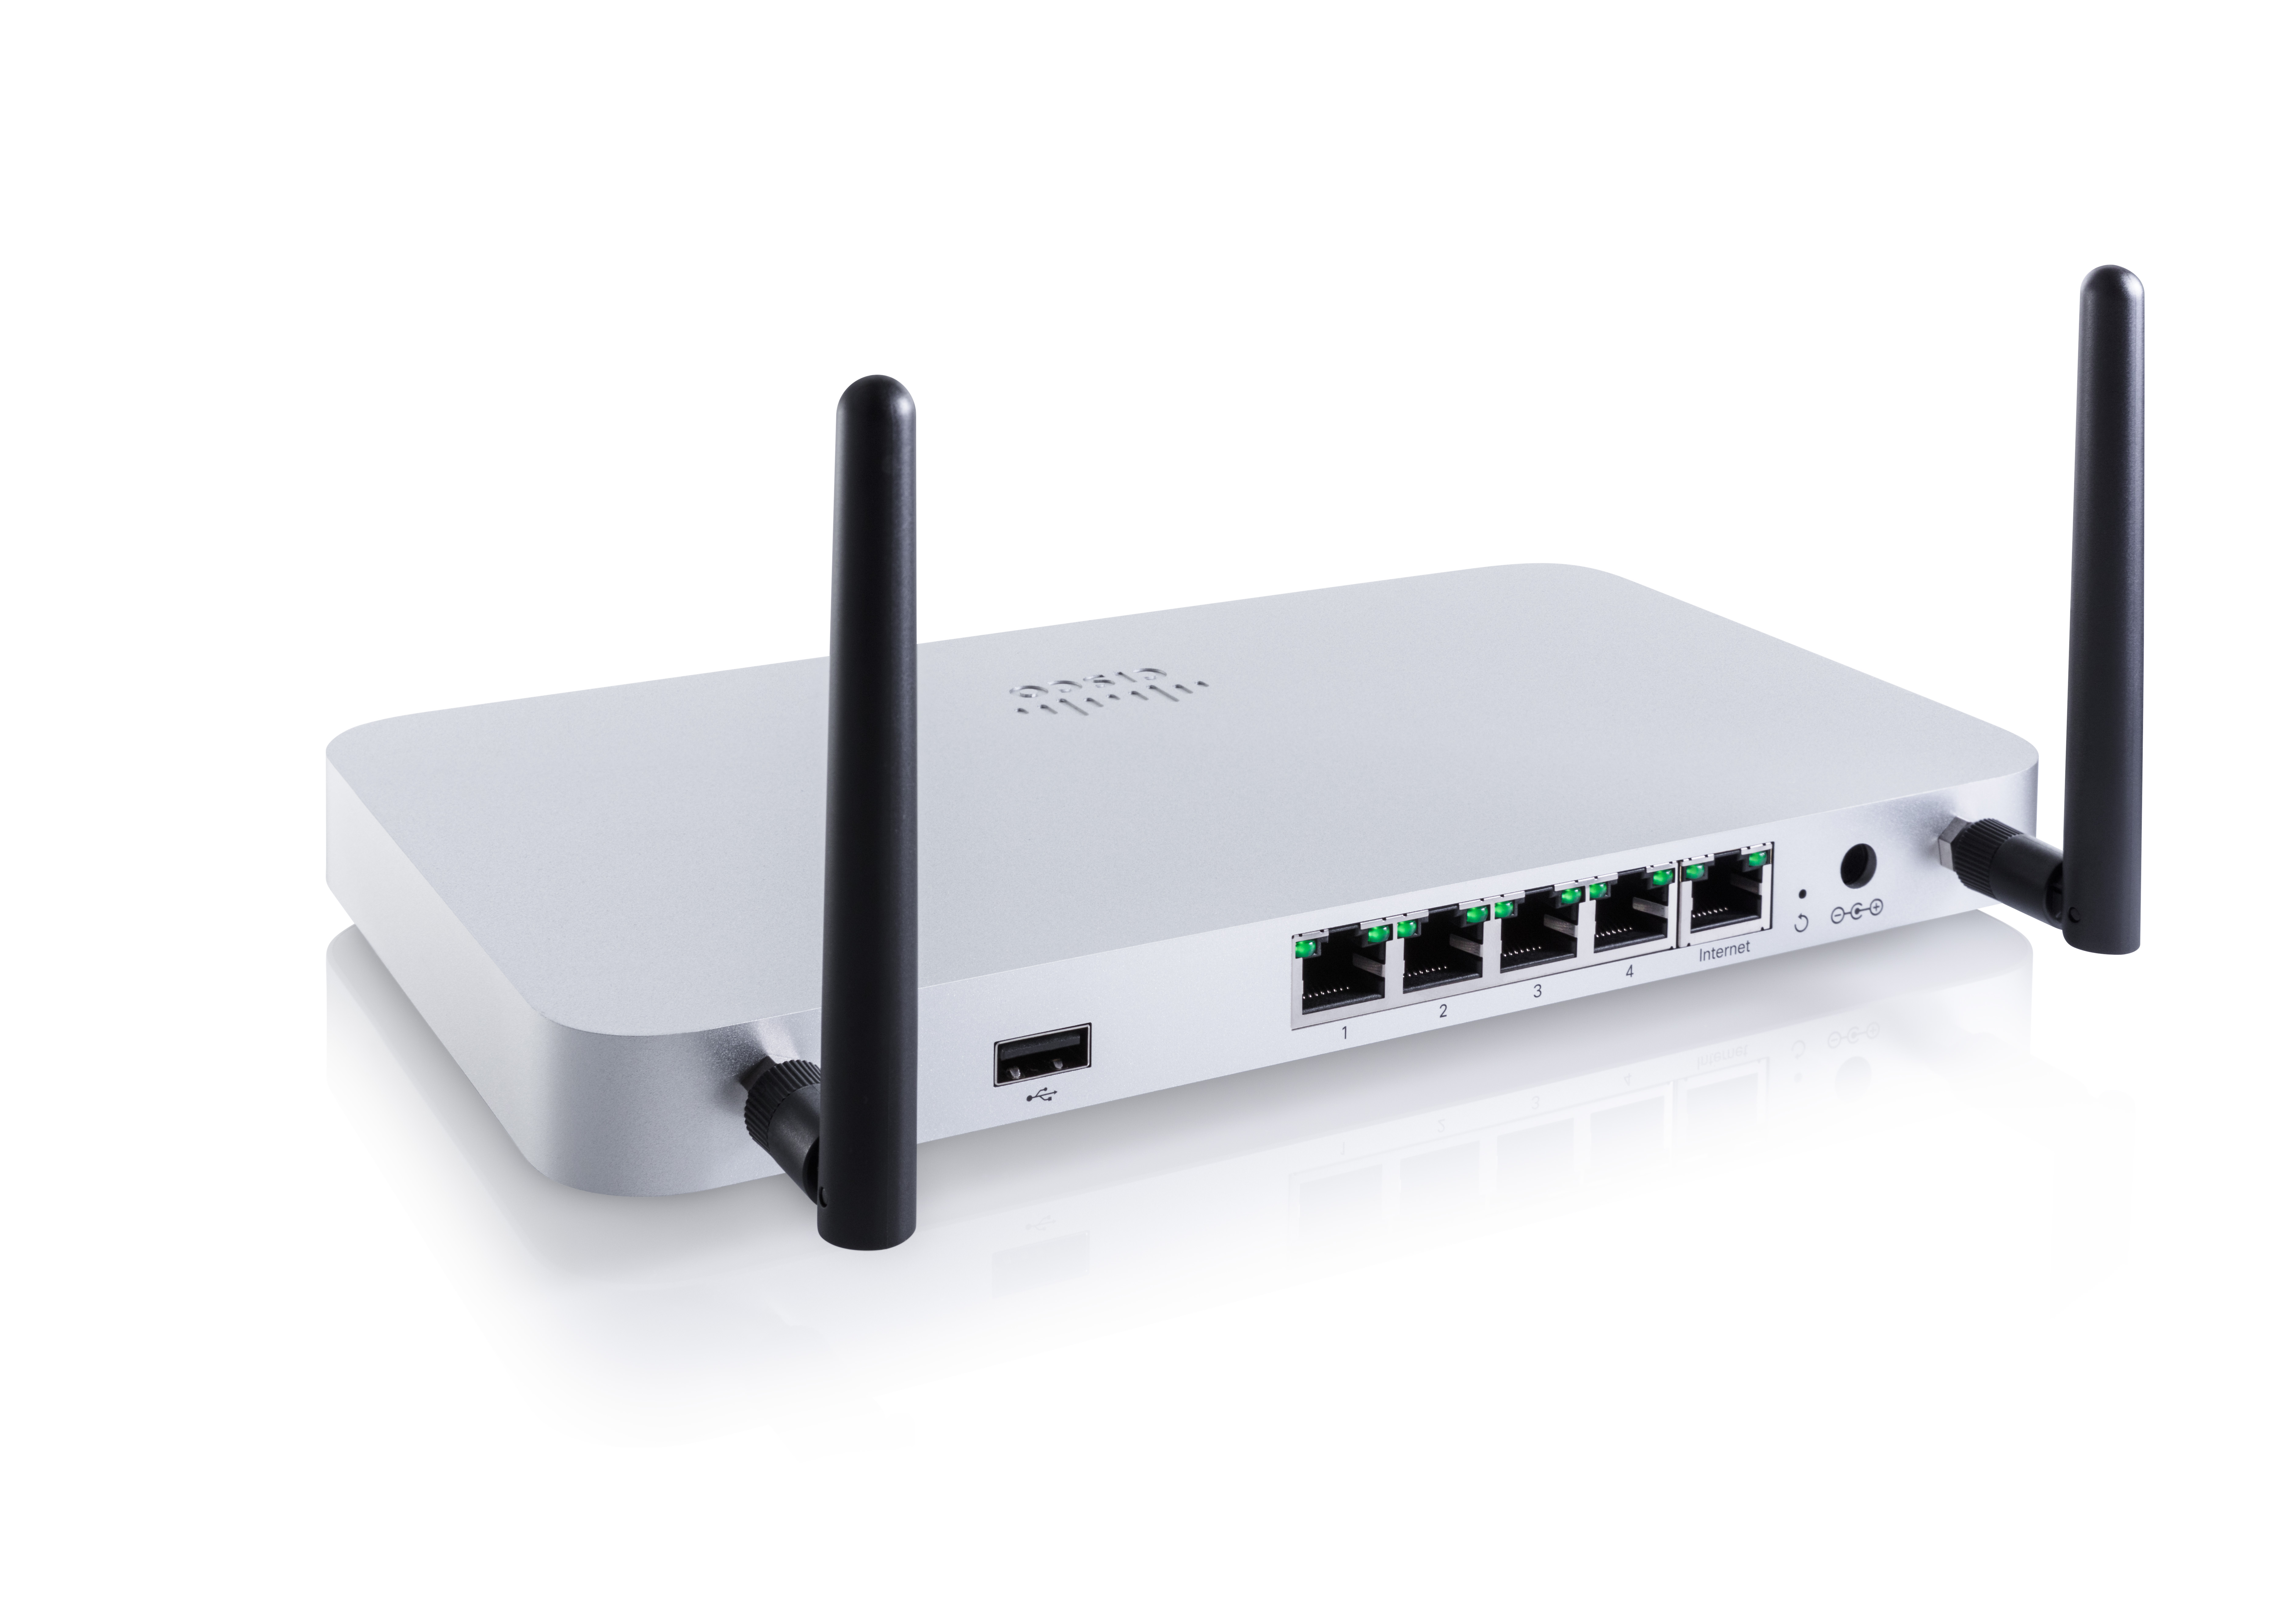
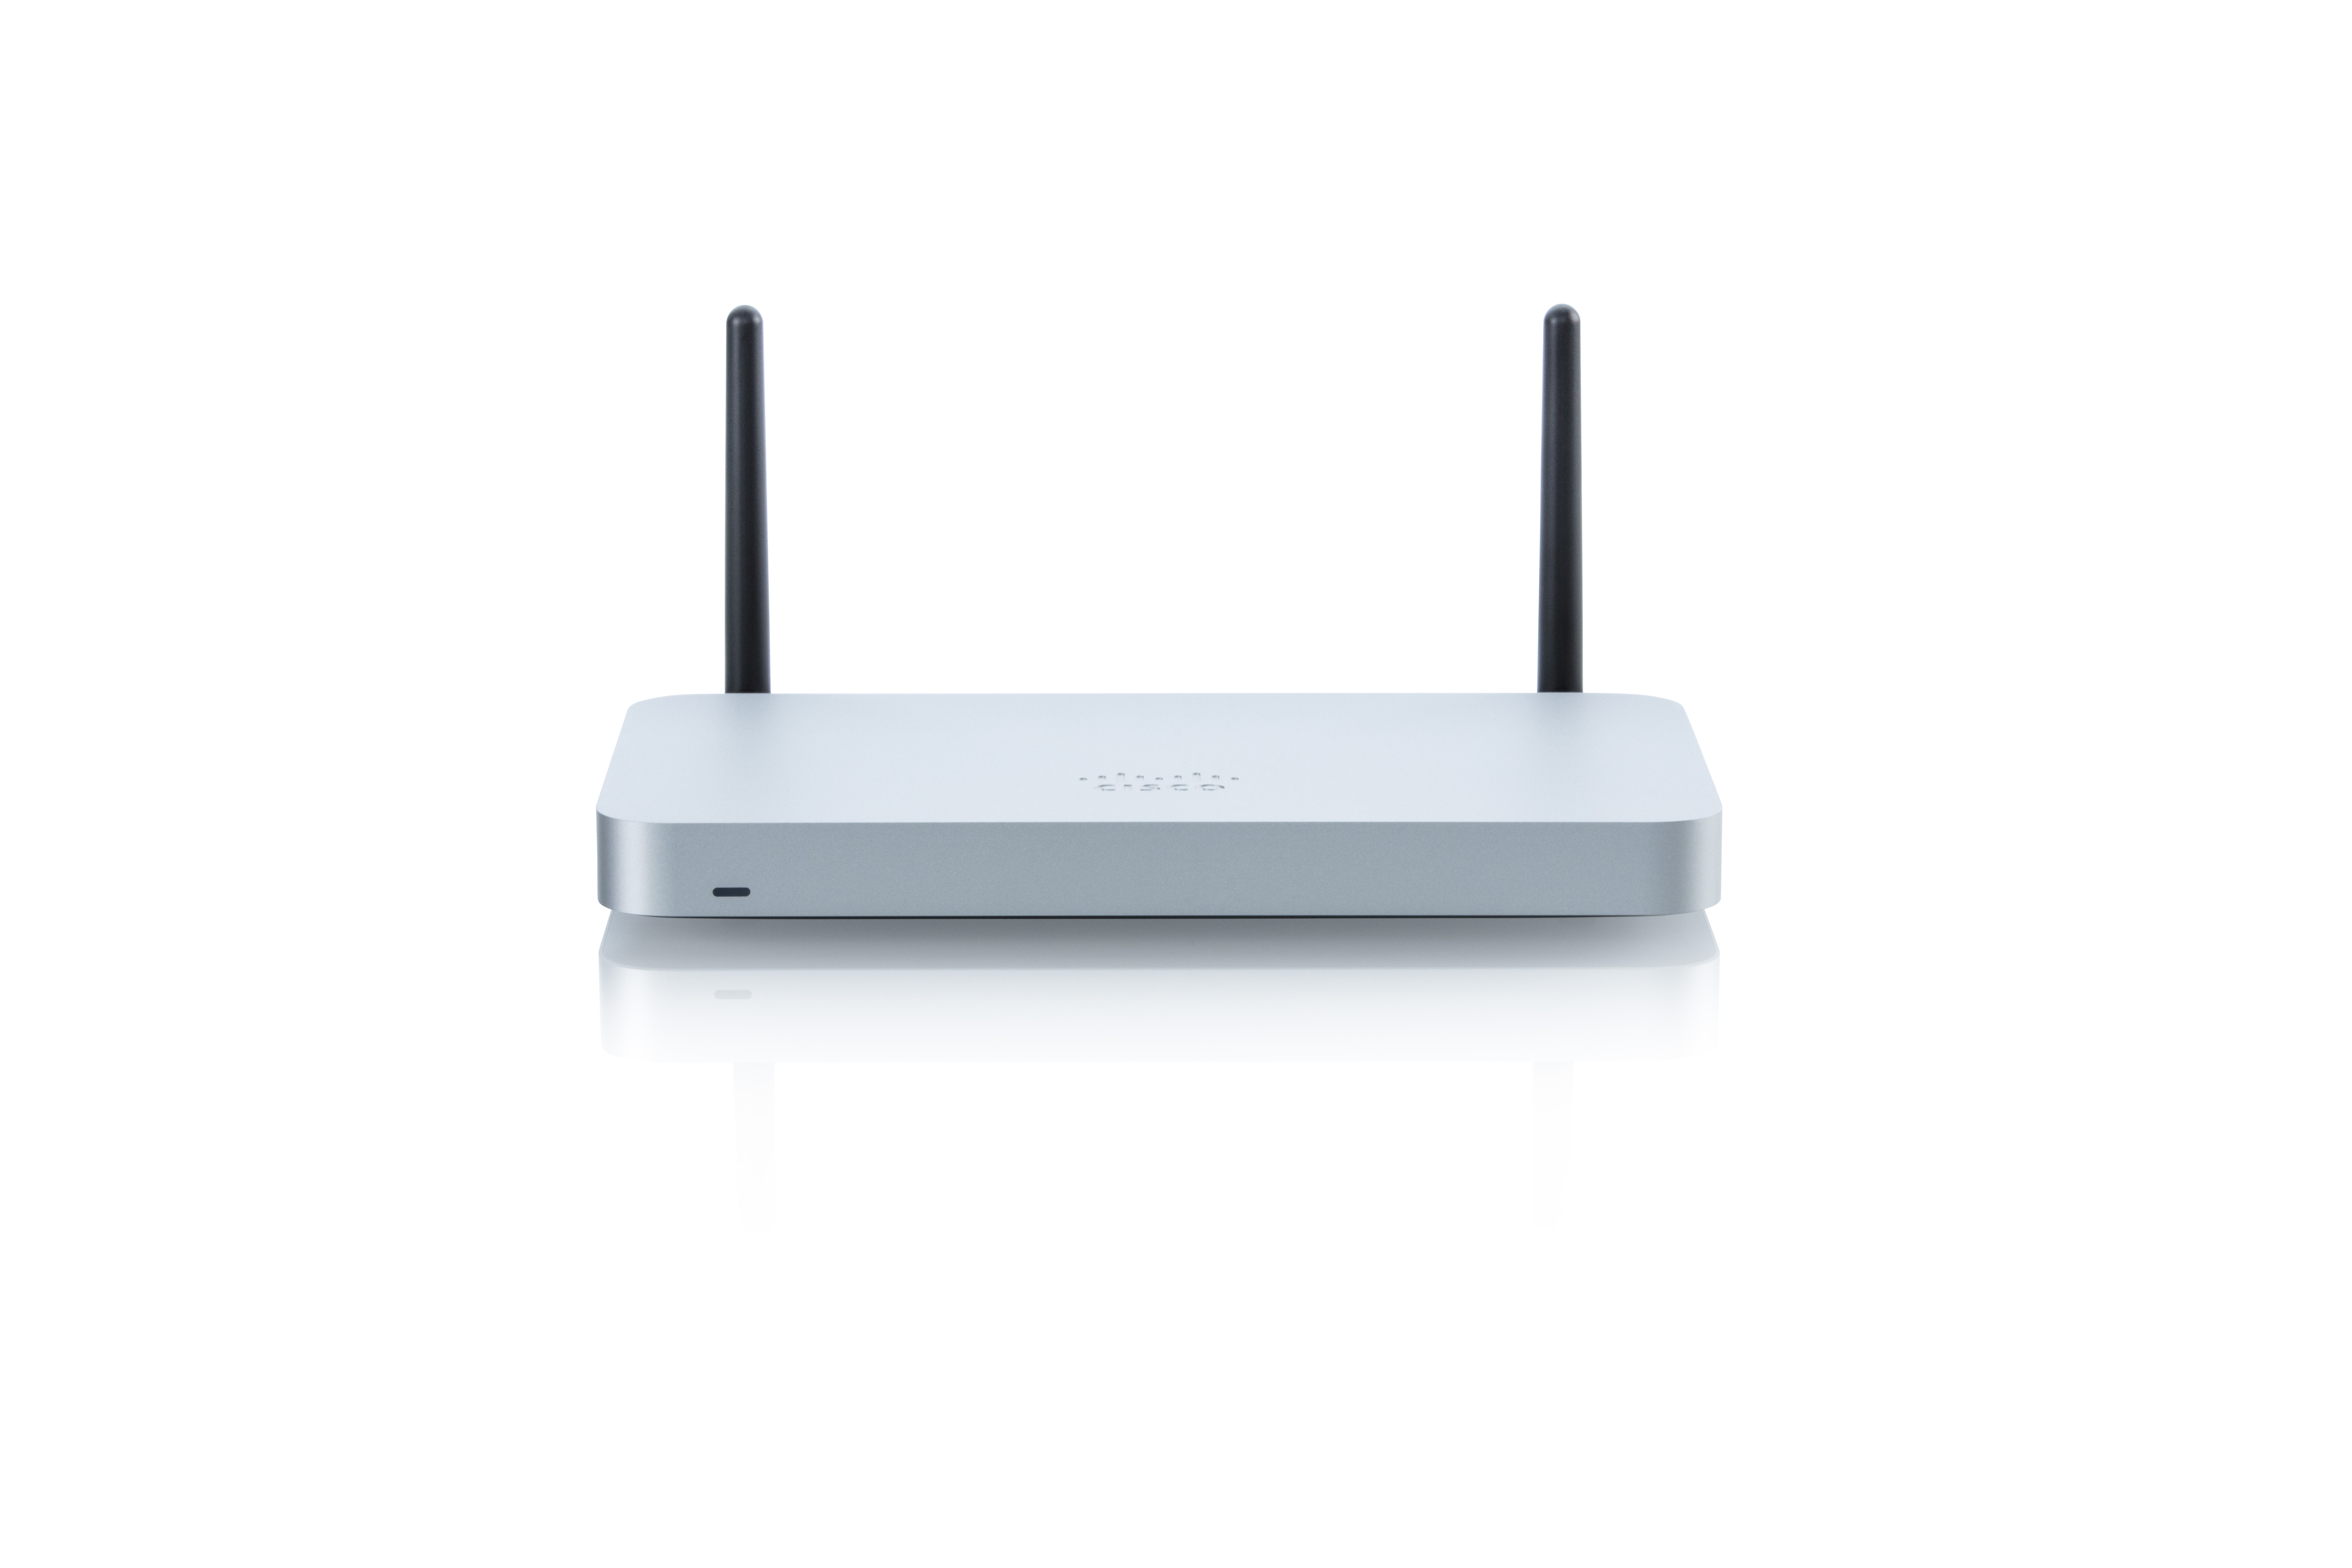
As a cloud-managed network management solution, the Cisco Meraki Dashboard enables users to provision, configure, and troubleshoot global networking and IoT deployments.
N/A
IBM Netcool Network Management
Score 9.0 out of 10
N/A
Netcool Network Management integrates the IBM Tivoli Network Manager IP Edition, Tivoli Netcool/OMNIbus and Netcool Configuration Manager products into a unified solution that consolidates the management of networks.
Cisco Meraki Dashboard is a great solution for managing a large number of networks across a single organization or multiple. For new projects we are able to set up the entire network in the dashboard with all of the needed settings, plug all of the devices in at our office and have them download their settings, so on the date of deployment, the equipment comes online and is ready to go immediately.
This tool was integrated with Control-M, so whenever we receive any job failure, long-running job, job not started yet, etc, we receive an alert against it. This tool is also integrated with Maximo where we receive the incidents as well for it. Alert's color was as per the criticality of the job and that makes it very easy for an associate to act on it to resolve. We have the SLAs for the jobs as per the urgency of the jobs.
The dashboard is easy to navigate and offers many pages that are loaded with information. Cisco Meraki adds new features to the dashboard based on customer feedback and I have seen so many updates and changes that have improved upon the previous version. Most recently they have added Cisco's AI and are looking at an Automation option that will only further improve usability.
The Cisco Meraki Dashboard is of course the most user friendly and the NDFC is being modified to look similar to the Cisco Meraki Dashboard as of today.
This is one of the essential tools for monitoring. This tool was integrated with Maximo and Control-M in my organization. So whenever any job failed in Control-M, we receive an alert against it in the IBM Netcool/OMNIbus. We receive the alerts in different colors as per the criticality. Black for critical ones(Sev1), red for urgent (Sev2), yellow for major(Sev3), and orange for minor(Sev4). So it makes an easy to operate and act on the alerts as per the severity. This tool is very user-friendly and easy to use. No additional training is required for the tool to operate, just a simple KT is enough.
It's definitely allowed us to operate with a smaller team and allowed us to troubleshoot issues quicker. The Meraki dashboard with Meraki APs has helped us identify issues on our wireless network, monitor the health, and really help our remote locations out with troubleshooting and getting devices online quicker.