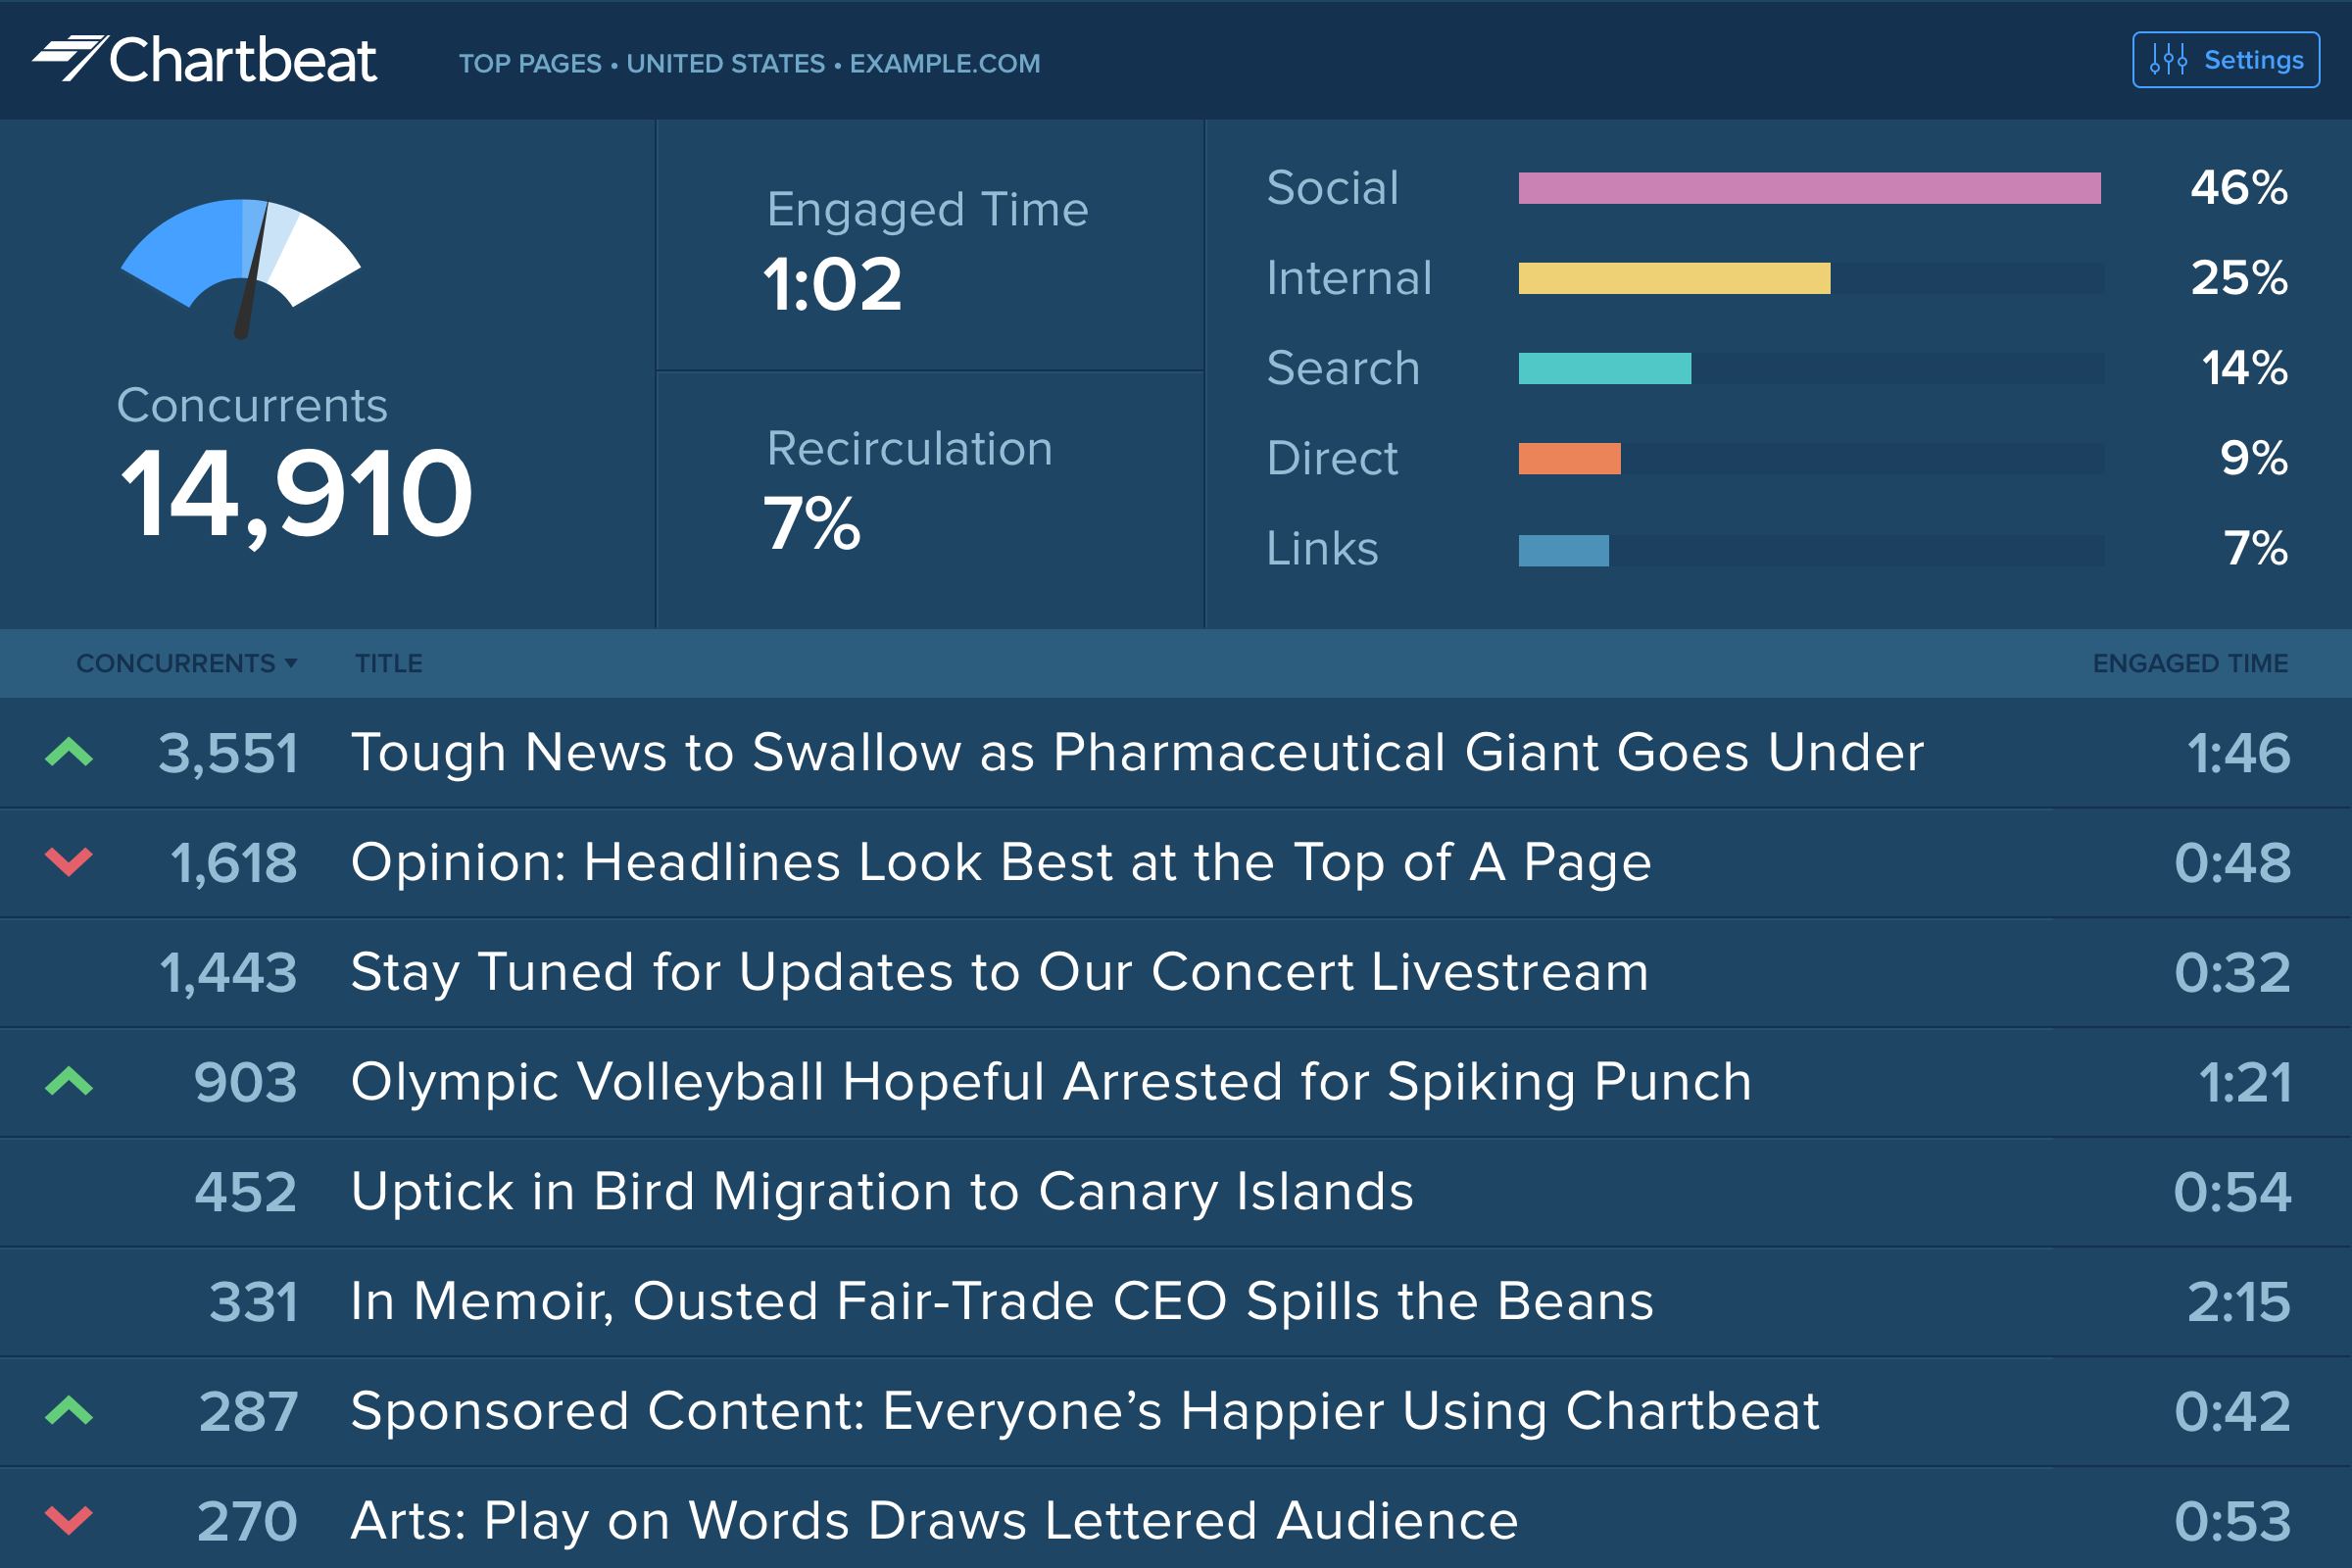
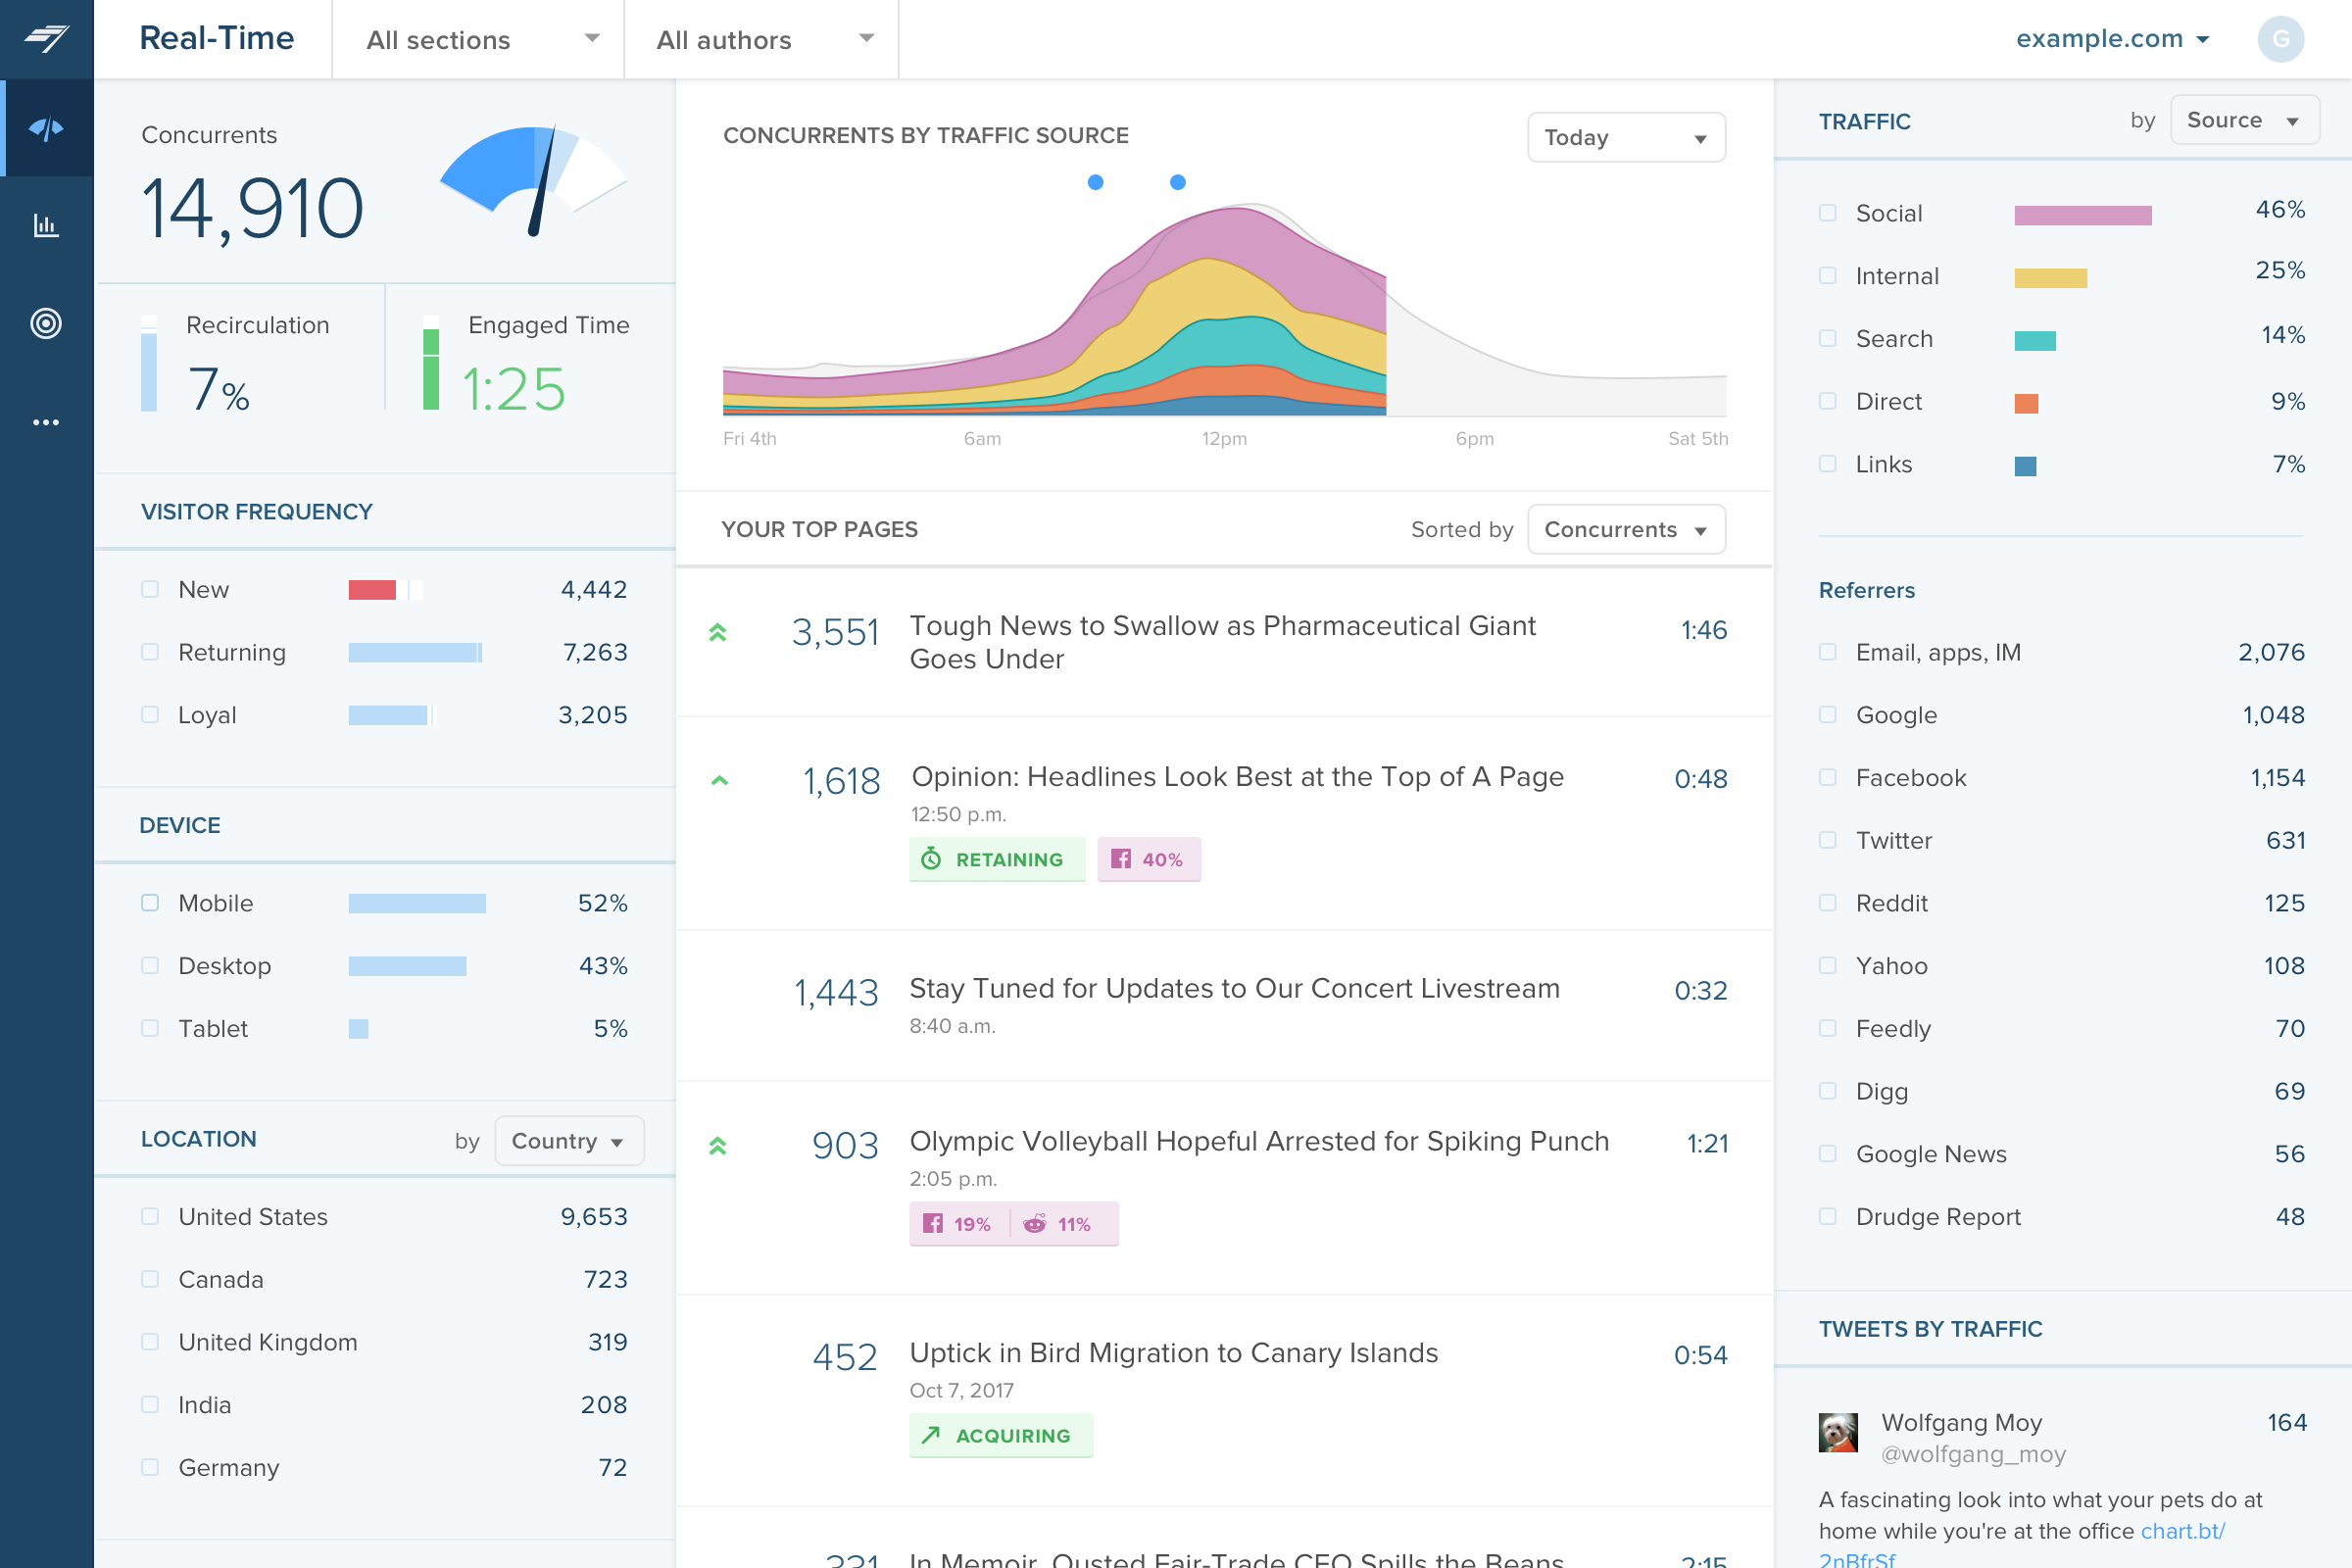
Chartbeat delivers real-time analytics, insights, and transformative tools for content teams around the world, to help improve audience engagement, inform editorial decisions, and increase loyalty.
N/A
Google Analytics
Score7.9 out of 10
N/A
Google Analytics is perhaps the best-known web analytics product and, as a free product, it has massive adoption. Although it lacks some enterprise-level features compared to its competitors in the space, the launch of the paid Google Analytics Premium edition seems likely to close the gap.
$0
per month
Pricing
Chartbeat
Google Analytics
Editions & Modules
No answers on this topic
Google Analytics 360
150,000
per year
Google Analytics
Free
Offerings
Pricing Offerings
Chartbeat
Google Analytics
Free Trial
Yes
No
Free/Freemium Version
No
Yes
Premium Consulting/Integration Services
Yes
No
Entry-level Setup Fee
No setup fee
No setup fee
Additional Details
Chartbeat pricing is based on monthly site page views. Discounts are applied to multi-year contracts. The Basic Plan includes the Real-time Dashboard, Historical Dashboard, Heads Up Display, Reports, Big Board, iOS and Android app, and Real-time API endpoints.
The Plus Plan includes all of the Basic Plan features, plus ONE of the following Premium features: Headline Testing, Advanced Queries, or Multi-Site View.
The Premium Plan includes all of the Basic Plan features, plus ALL Premium features: Headline Testing, Advanced Queries, Multi-Site View, and enterprise-level support and custom trainings.
—
More Pricing Information
Community Pulse
Chartbeat
Google Analytics
Considered Both Products
Chartbeat
Verified User
Chose Chartbeat
Google Analytics 360 had problems, but after it was discontinued, Google Analytics became a shell of its former self. An added benefit of Chartbeat is that it's more "live" (looking at live concurrents rather than in the past however many minutes) and tells you how that number …
A de minimis incentive was given to thank the reviewer for their time. The incentive was not used to bias or drive a particular response, nor was the incentive contingent on a positive endorsement. More Info
Verified User
Chose Chartbeat
Google Analytics has gradually become much more difficult to use, and much slower in its realtime reporting. It was the changes that came in with Google Analytics 4 that gave us the final push to work with Chartbeat - a product some of us were already familiar with from …
A de minimis incentive was given to thank the reviewer for their time. The incentive was not used to bias or drive a particular response, nor was the incentive contingent on a positive endorsement. More Info
Verified User
Chose Chartbeat
Chartbeat stands out in terms of real-time tracking and information from which to manage homepages, I found this better than Smart Octo's equivalent. However, the ability to quickly explore past data does not go as deep as Google Analytics.
A de minimis incentive was given to thank the reviewer for their time. The incentive was not used to bias or drive a particular response, nor was the incentive contingent on a positive endorsement. More Info
A de minimis incentive was given to thank the reviewer for their time. The incentive was not used to bias or drive a particular response, nor was the incentive contingent on a positive endorsement. More Info
A de minimis incentive was given to thank the reviewer for their time. The incentive was not used to bias or drive a particular response, nor was the incentive contingent on a positive endorsement. TR verified that a representative sample of customers was invited. More Info
Verified User
Chose Chartbeat
In my opinion, Chartbeat should be paired with Google Analytics. Chartbeat is perfect for real-time results, an area GA lacks, and GA is best for long-term outlook.
A de minimis incentive was given to thank the reviewer for their time. The incentive was not used to bias or drive a particular response, nor was the incentive contingent on a positive endorsement. TR verified that a representative sample of customers was invited. More Info
A de minimis incentive was given to thank the reviewer for their time. The incentive was not used to bias or drive a particular response, nor was the incentive contingent on a positive endorsement. More Info
Digital Content Producer, NewsNation, WGN America in Social Media at WGN America/Nexstar Media Group (Broadcast Media, 5001-10,000 employees)
Chose Chartbeat
Google Analytics gives me a better overview of my site's performance, I think; however, when it comes to real-time insights, I always turn to Chartbeat.
A de minimis incentive was given to thank the reviewer for their time. The incentive was not used to bias or drive a particular response, nor was the incentive contingent on a positive endorsement. More Info
Verified User
Chose Chartbeat
Larger analytics suites like Google Analytics and Omniture simply do not provide the kind of real-time data that Chartbeat does. I have used Parse.ly which has some interesting real-time features as well; I would say Parse.ly is similar in terms of ease of use, though Chartbeat …
A de minimis incentive was given to thank the reviewer for their time. The incentive was not used to bias or drive a particular response, nor was the incentive contingent on a positive endorsement. More Info
A de minimis incentive was given to thank the reviewer for their time. The incentive was not used to bias or drive a particular response, nor was the incentive contingent on a positive endorsement. More Info
Verified User
Chose Chartbeat
Much easier to use and understand than GA4. We tested Marfeel, but felt Chartbeat was so good there was no reason to change.
I still feel like our audit is still based on GA4 so we do have to still pay attention to that.
A de minimis incentive was given to thank the reviewer for their time. The incentive was not used to bias or drive a particular response, nor was the incentive contingent on a positive endorsement. More Info
A de minimis incentive was given to thank the reviewer for their time. The incentive was not used to bias or drive a particular response, nor was the incentive contingent on a positive endorsement. More Info
Verified User
Chose Chartbeat
Chartbeat's heads up display feature allows the newsroom to see key data right from our site.
A de minimis incentive was given to thank the reviewer for their time. The incentive was not used to bias or drive a particular response, nor was the incentive contingent on a positive endorsement. More Info
A de minimis incentive was given to thank the reviewer for their time. The incentive was not used to bias or drive a particular response, nor was the incentive contingent on a positive endorsement. More Info
A de minimis incentive was given to thank the reviewer for their time. The incentive was not used to bias or drive a particular response, nor was the incentive contingent on a positive endorsement. More Info
Verified User
Chose Chartbeat
Chartbeat is better than GA when it comes to ease of use and immediacy. The homepage layover that Chartbeat offers is unique from what I've seen and gives me an instant knowledge of what's working on my site and how to best arrange it.
A de minimis incentive was given to thank the reviewer for their time. The incentive was not used to bias or drive a particular response, nor was the incentive contingent on a positive endorsement. More Info
Verified User
Chose Chartbeat
Other products like Chartbeat that I've used are Parse.ly, GA, and Omniture. Parse.ly is the only tool, in my opinion, that offers more real-time data, but the interface is lacking and isn't as intuitive as Chartbeat.
A de minimis incentive was given to thank the reviewer for their time. The incentive was not used to bias or drive a particular response, nor was the incentive contingent on a positive endorsement. TR verified that a representative sample of customers was invited. More Info
A de minimis incentive was given to thank the reviewer for their time. The incentive was not used to bias or drive a particular response, nor was the incentive contingent on a positive endorsement. TR verified that a representative sample of customers was invited. More Info
A de minimis incentive was given to thank the reviewer for their time. The incentive was not used to bias or drive a particular response, nor was the incentive contingent on a positive endorsement. TR verified that a representative sample of customers was invited. More Info
Verified User
Chose Chartbeat
Chartbeat is better for live metrics than either Adobe or Google, but Adobe Omniture especially is much better for tracking historic numbers.
A de minimis incentive was given to thank the reviewer for their time. The incentive was not used to bias or drive a particular response, nor was the incentive contingent on a positive endorsement. TR verified that a representative sample of customers was invited. More Info
Verified User
Chose Chartbeat
Chartbeat is certainly better at visualizing content and segmenting the data all on one screen. We can filter by section, author, channel and more without leaving the main dashboard page. Combining properties together in roll up groups is another key feature. We're able to …
A de minimis incentive was given to thank the reviewer for their time. The incentive was not used to bias or drive a particular response, nor was the incentive contingent on a positive endorsement. TR verified that a representative sample of customers was invited. More Info
Coordinador BI & Big Data in Information Technology at Radio Mitre (Broadcast Media, 201-500 employees)
Chose Chartbeat
Chartbeat's realtime its superior to all tools we have. It really makes the difference. We are in calls with Chartbeat for raw data, this is a new product and it will be open a lot of interesting information with raw data in real-time.
A de minimis incentive was given to thank the reviewer for their time. The incentive was not used to bias or drive a particular response, nor was the incentive contingent on a positive endorsement. More Info
A de minimis incentive was given to thank the reviewer for their time. The incentive was not used to bias or drive a particular response, nor was the incentive contingent on a positive endorsement. More Info
Director at Tribune Publishing (Newspapers, 1001-5000 employees)
Chose Chartbeat
Chartbeat really remains the gold standard in the tracking, measurement and display of realtime engagement metrics. If your site has sufficient audience benefit from immediate changes in content programming, display and design, it's a great tool with a highly refined and …
A de minimis incentive was given to thank the reviewer for their time. The incentive was not used to bias or drive a particular response, nor was the incentive contingent on a positive endorsement. More Info
A de minimis incentive was given to thank the reviewer for their time. The incentive was not used to bias or drive a particular response, nor was the incentive contingent on a positive endorsement. More Info
Google
Verified User
Chose Google Analytics
Google Analytics has its advantages over its competitors. It is well suited to smaller companies.
A de minimis incentive was given to thank the reviewer for their time. The incentive was not used to bias or drive a particular response, nor was the incentive contingent on a positive endorsement. More Info
Digital Marketing Strategist, Founder in Professional Services at California SEO Professionals (Marketing and Advertising, 1-10 employees)
Chose Google Analytics
It's free, nothing beats that! It is easier to use than most other platforms I have used. You can create customized reports on the fly and they are high quality too. Despite the fact that there are so many other other analytics management platforms, Google Analytics remains a …
A de minimis incentive was given to thank the reviewer for their time. The incentive was not used to bias or drive a particular response, nor was the incentive contingent on a positive endorsement. More Info
Verified User
Chose Google Analytics
I like Google Analytics better than Adobe Analytics because it has a much better user interface. It is easier to use and is easier to set up reports. While these two can be used hand-in-hand I would prefer only using Google Analytics because I find that it is easier to find the …
A de minimis incentive was given to thank the reviewer for their time. The incentive was not used to bias or drive a particular response, nor was the incentive contingent on a positive endorsement. More Info
Verified User
Chose Google Analytics
If it was my choice I would have used IBM Digital Analytics (DA) for everything. DA has it quirks but it really gives some deep analysis on the data and with a bit of development work you can really get all the data you could possibly want. If every website and newsletter was …
A de minimis incentive was given to thank the reviewer for their time. The incentive was not used to bias or drive a particular response, nor was the incentive contingent on a positive endorsement. More Info
The main point of benefit is the realtime data. This is vital to our team as we are publishing a lot of content per day, so we have a busy homepage to manage and it's important to know which content is performing well. We also like to get an understanding as quickly as possible - which Chartbeat offers - of where traffic is coming from. Often we will see an example where a page is getting high traffic from Google, for example, and we know that might not need to be placed so prominently on the homepage because the traffic is arriving to us externally anyway. Without that depth of understanding what is performing best and why - updated immediately, unlike in Google Analytics now - our homepage would not be as well optimised for users coming to us direct
A de minimis incentive was given to thank the reviewer for their time. The incentive was not used to bias or drive a particular response, nor was the incentive contingent on a positive endorsement. More Info
Google Analytics is particularly well suited for tracking and analyzing customer behavior on a grocery e-commerce platform. It provides a wealth of information about customer behavior, including what products are most popular, what pages are visited the most, and where customers are coming from. This information can help the platform optimize its website for better customer engagement and conversion rates. However, Google Analytics may not be the best tool for more advanced, granular analysis of customer behavior, such as tracking individual customer journeys or understanding customer motivations. In these cases, it may be more appropriate to use additional tools or solutions that provide deeper insights into customer behavior.
A de minimis incentive was given to thank the reviewer for their time. The incentive was not used to bias or drive a particular response, nor was the incentive contingent on a positive endorsement. More Info
Source of traffic needs improvement. Search and social make sense, but "internal" and "links" is a grey area. It would be helpful to define those with an organization and provide an information icon so users can easily remember what each of those buckets is tracking.
More ways to customize the real-time board. For example, with video content, that's great that I can see a user has started a video, but what is the completion rate, was that only on O&O or can that track Facebook, too?
Would like to see demo (age) information included as a way to slice the data so I can see what's working with my older and younger demo.
A de minimis incentive was given to thank the reviewer for their time. The incentive was not used to bias or drive a particular response, nor was the incentive contingent on a positive endorsement. TR verified that a representative sample of customers was invited. More Info
A de minimis incentive was given to thank the reviewer for their time. The incentive was not used to bias or drive a particular response, nor was the incentive contingent on a positive endorsement. More Info
I gave Chartbeat a 5 for a renewal rating, because, while it delivers clear and understandable content, Google Analytics also provides many of the same features for free. For a small to medium website, I believe it would be more cost effective to use Google Analytics. A website with a high amount of traffic, however, could merit spending the money on Chartbeat to maximize their potential.
We will continue to use Google Analytics for several reasons. It is free, which is a huge selling point. It houses all of our ecommerce stores' data, and though it can't account for refunds or fraud orders, gives us and our clients directional, real time information on individual and group store performance.
A de minimis incentive was given to thank the reviewer for their time. The incentive was not used to bias or drive a particular response, nor was the incentive contingent on a positive endorsement. More Info
I am able to "set it and forget it," keeping it up on my monitor for either constant checking or just keeping an eye on the numbers during the day. I'm also able to keep track of what times are perfect to post a story and which stories rack up the most traffic.
A de minimis incentive was given to thank the reviewer for their time. The incentive was not used to bias or drive a particular response, nor was the incentive contingent on a positive endorsement. More Info
Google Analytics provides a wealth of data, down to minute levels. That is it's greatest detriment: find the right information when you need it can be a cumbersome task. You are able to create shortcuts, however, so it can mitigate some of this problem. Google is continually refining Analytics, so I do not doubt there will be improvements
We all know Google is at top when it comes to availability. We have never faced any such instances where I can suggest otherwise. All you need is a Google account, a device and internet connection to use this super powerful tool for reporting and visualising your site data, traffic, events, etc. that too in real time.
This has been a catalyst for improving our site's traffic handling capabilities. We were able to identify exit% from our sites through it and we used recommendations to handle and implement the same in our sites. We have been increasing the usage of Google Analytics in our sites and never had any performance related issues if we used Analytics
I have had limited experience of support for Chartbeat but whenever I have needed help it has been there. Recently there was an issue of seeing different forms of data in real time - app and otherwise effectively, and the issue was being clearly dealt with and communicated back to us.
A de minimis incentive was given to thank the reviewer for their time. The incentive was not used to bias or drive a particular response, nor was the incentive contingent on a positive endorsement. More Info
The Google reps respond very quickly. However, sometimes they can overly call you to set up an apportionment. I'm very proficient and sometimes when I talk to reps, they give beginner tutorials and insights that are a waste of time. I wish Google would understand my level of expertise and assign me to a rep (long-term) that doesn't have to walk me through the basics.
A de minimis incentive was given to thank the reviewer for their time. The incentive was not used to bias or drive a particular response, nor was the incentive contingent on a positive endorsement. More Info
love the product and training they provide for businesses of all sizes. The following list of links will help you get started with Google Analytics from setup to understanding what data is being presented by Google Analytics.
I think my biggest take away from the Google Analytics implementation was that there needs to be a clear understanding of what you want to achieve and how you want to achieve it before you start. Originally the analytics were added to track visitors, but as we became more savvy with the product, we began adding more and more functionality, and defining guidelines as we went along. While not detrimental to our success, this lack of an overarching goal resulted in some minor setbacks in implementation and the collection of some messy data that is unusable.
Omnilytics is more robust, detailed, and catered for an intermediate media user, while I think Chartbeat is a more user-friendly and beginner-oriented piece of technology. That being said, there is an impressive amount of lift for Chartbeat, and it's evident that simplicity is the key to using a software daily (which is absolutely the point in the content world).
A de minimis incentive was given to thank the reviewer for their time. The incentive was not used to bias or drive a particular response, nor was the incentive contingent on a positive endorsement. More Info
I have not used Adobe Analytics as much, but I know they offer something called customer journey analytics, which we are evaluating now. I have used Semrush, and I find them much better than Google Analytics. I feel a fairly nontechnical person could learn Semrush in about a month. They also offer features like competitive analysis (on content, keywords, traffic, etc.), which is very useful. If you have to choose one among Semrush and Google Analytics, I would say go for Semrush.
A de minimis incentive was given to thank the reviewer for their time. The incentive was not used to bias or drive a particular response, nor was the incentive contingent on a positive endorsement. More Info
Google Analytics is currently handling the reporting and tracking of near about 80 sites in our project. And I am not talking about the sites from different projects. They may have way more accounts than that. Never ever felt a performance issue from Google's end while generating or customising reports or tracking custom events or creating custom dimensions
A de minimis incentive was given to thank the reviewer for their time. The incentive was not used to bias or drive a particular response, nor was the incentive contingent on a positive endorsement. More Info
A de minimis incentive was given to thank the reviewer for their time. The incentive was not used to bias or drive a particular response, nor was the incentive contingent on a positive endorsement. More Info