TrustRadius: an HG Insights company

Chaos Genius vs. SolarWinds Database Performance Monitor

Save this comparison

Save this comparison

Add Product

Recommended Comparisons

    Overview
    ProductRatingMost Used ByProduct SummaryStarting Price

    Chaos Genius

    N/AN/AChaos Genius is presented as a DataOps observability platform, available for Snowflake and with an option for Databricks currently in development, that provides workload optimization, query improvement and cost governance.

    $500

    per month Upto $25000 in monthly tracked costs

    SolarWinds Database Performance Monitor

    Score9.2 out of 10
    N/AVividCortex, acquired by SolarWinds in December 2019, provides database performance monitoring designed to increase system performance, team efficiency, and infrastructure cost savings. The GDPR- and SOC 2-compliant platform offers visibility into major open-source databases—MySQL, PostgreSQL, Amazon Aurora, MongoDB, and Redis—for the engineering team at scale. Industry leaders like Etsy, GitHub, SendGrid, and Yelp rely on Database Performance Monitor for all-query monitoring and drill…N/A
    Pricing
    Chaos GeniusSolarWinds Database Performance Monitor
    Editions & Modules
    Pro
    $500
    per month Upto $25000 in monthly tracked costs
    Enterprise
    Contact Sales
    >$25000 in monthly tracked costs
    No answers on this topic
    Offerings
    Pricing Offerings
    Chaos GeniusSolarWinds Database Performance Monitor
    Free Trial
    NoYes
    Free/Freemium Version
    NoNo
    Premium Consulting/Integration Services
    NoYes
    Entry-level Setup FeeNo setup feeNo setup fee
    Additional Details
    More Pricing Information
    Best Alternatives
    Chaos GeniusSolarWinds Database Performance Monitor
    Small Businesses
    No answers on this topic
    No answers on this topic
    Medium-sized Companies
    SolarWinds Database Performance Analyzer
    Score5.5 out of 10
    SolarWinds Database Performance Analyzer
    Score5.5 out of 10
    Enterprises
    Foglight
    Score10 out of 10
    Foglight
    Score10 out of 10
    All AlternativesView all alternativesView all alternatives
    User Ratings
    Chaos GeniusSolarWinds Database Performance Monitor
    Likelihood to Recommend
    -
    (0 ratings)
    8.0
    (1 ratings)
    User Testimonials
    Chaos GeniusSolarWinds Database Performance Monitor
    Likelihood to Recommend
    Chaos Genius
    No answers on this topic
    SolarWinds
    Computing resources consumed by the DB instance, DPA queries & wait time, deadlock conditions, virtual infrastructure resources. The addition of NPM & DPA integration as well as cross-correlation in the identification of issues with the network or server or DB is all stupid-proof. Monitoring is more than just health and resource consumption, it's also performance. DB performance analysis is key to maintaining healthy DB instances.
    Incentivized
    Read full review
    Pros
    Chaos Genius
    No answers on this topic
    SolarWinds
    • Simple to use and very easy to learn.
    • The execution engines run in parallel, can execute any syntax or query.
    • DPN can run all queries for both Oracle and SQL with no additional support.
    Incentivized
    Read full review
    Cons
    Chaos Genius
    No answers on this topic
    SolarWinds
    • The Reporting feature currently doesn't allow customization.
    Incentivized
    Read full review
    Alternatives Considered
    Chaos Genius
    No answers on this topic
    SolarWinds
    DPM is less expensive and more feature-rich. Also, Oracle tech support is garbage, unless you can afford to spend a day getting assistance.
    Incentivized
    Read full review
    Return on Investment
    Chaos Genius
    No answers on this topic
    SolarWinds
    • What is the cost of a downed DB instance? That's your ROI. DPM lets you see issues before they become critical.
    Incentivized
    Read full review
    ScreenShots

    SolarWinds Database Performance Monitor Screenshots

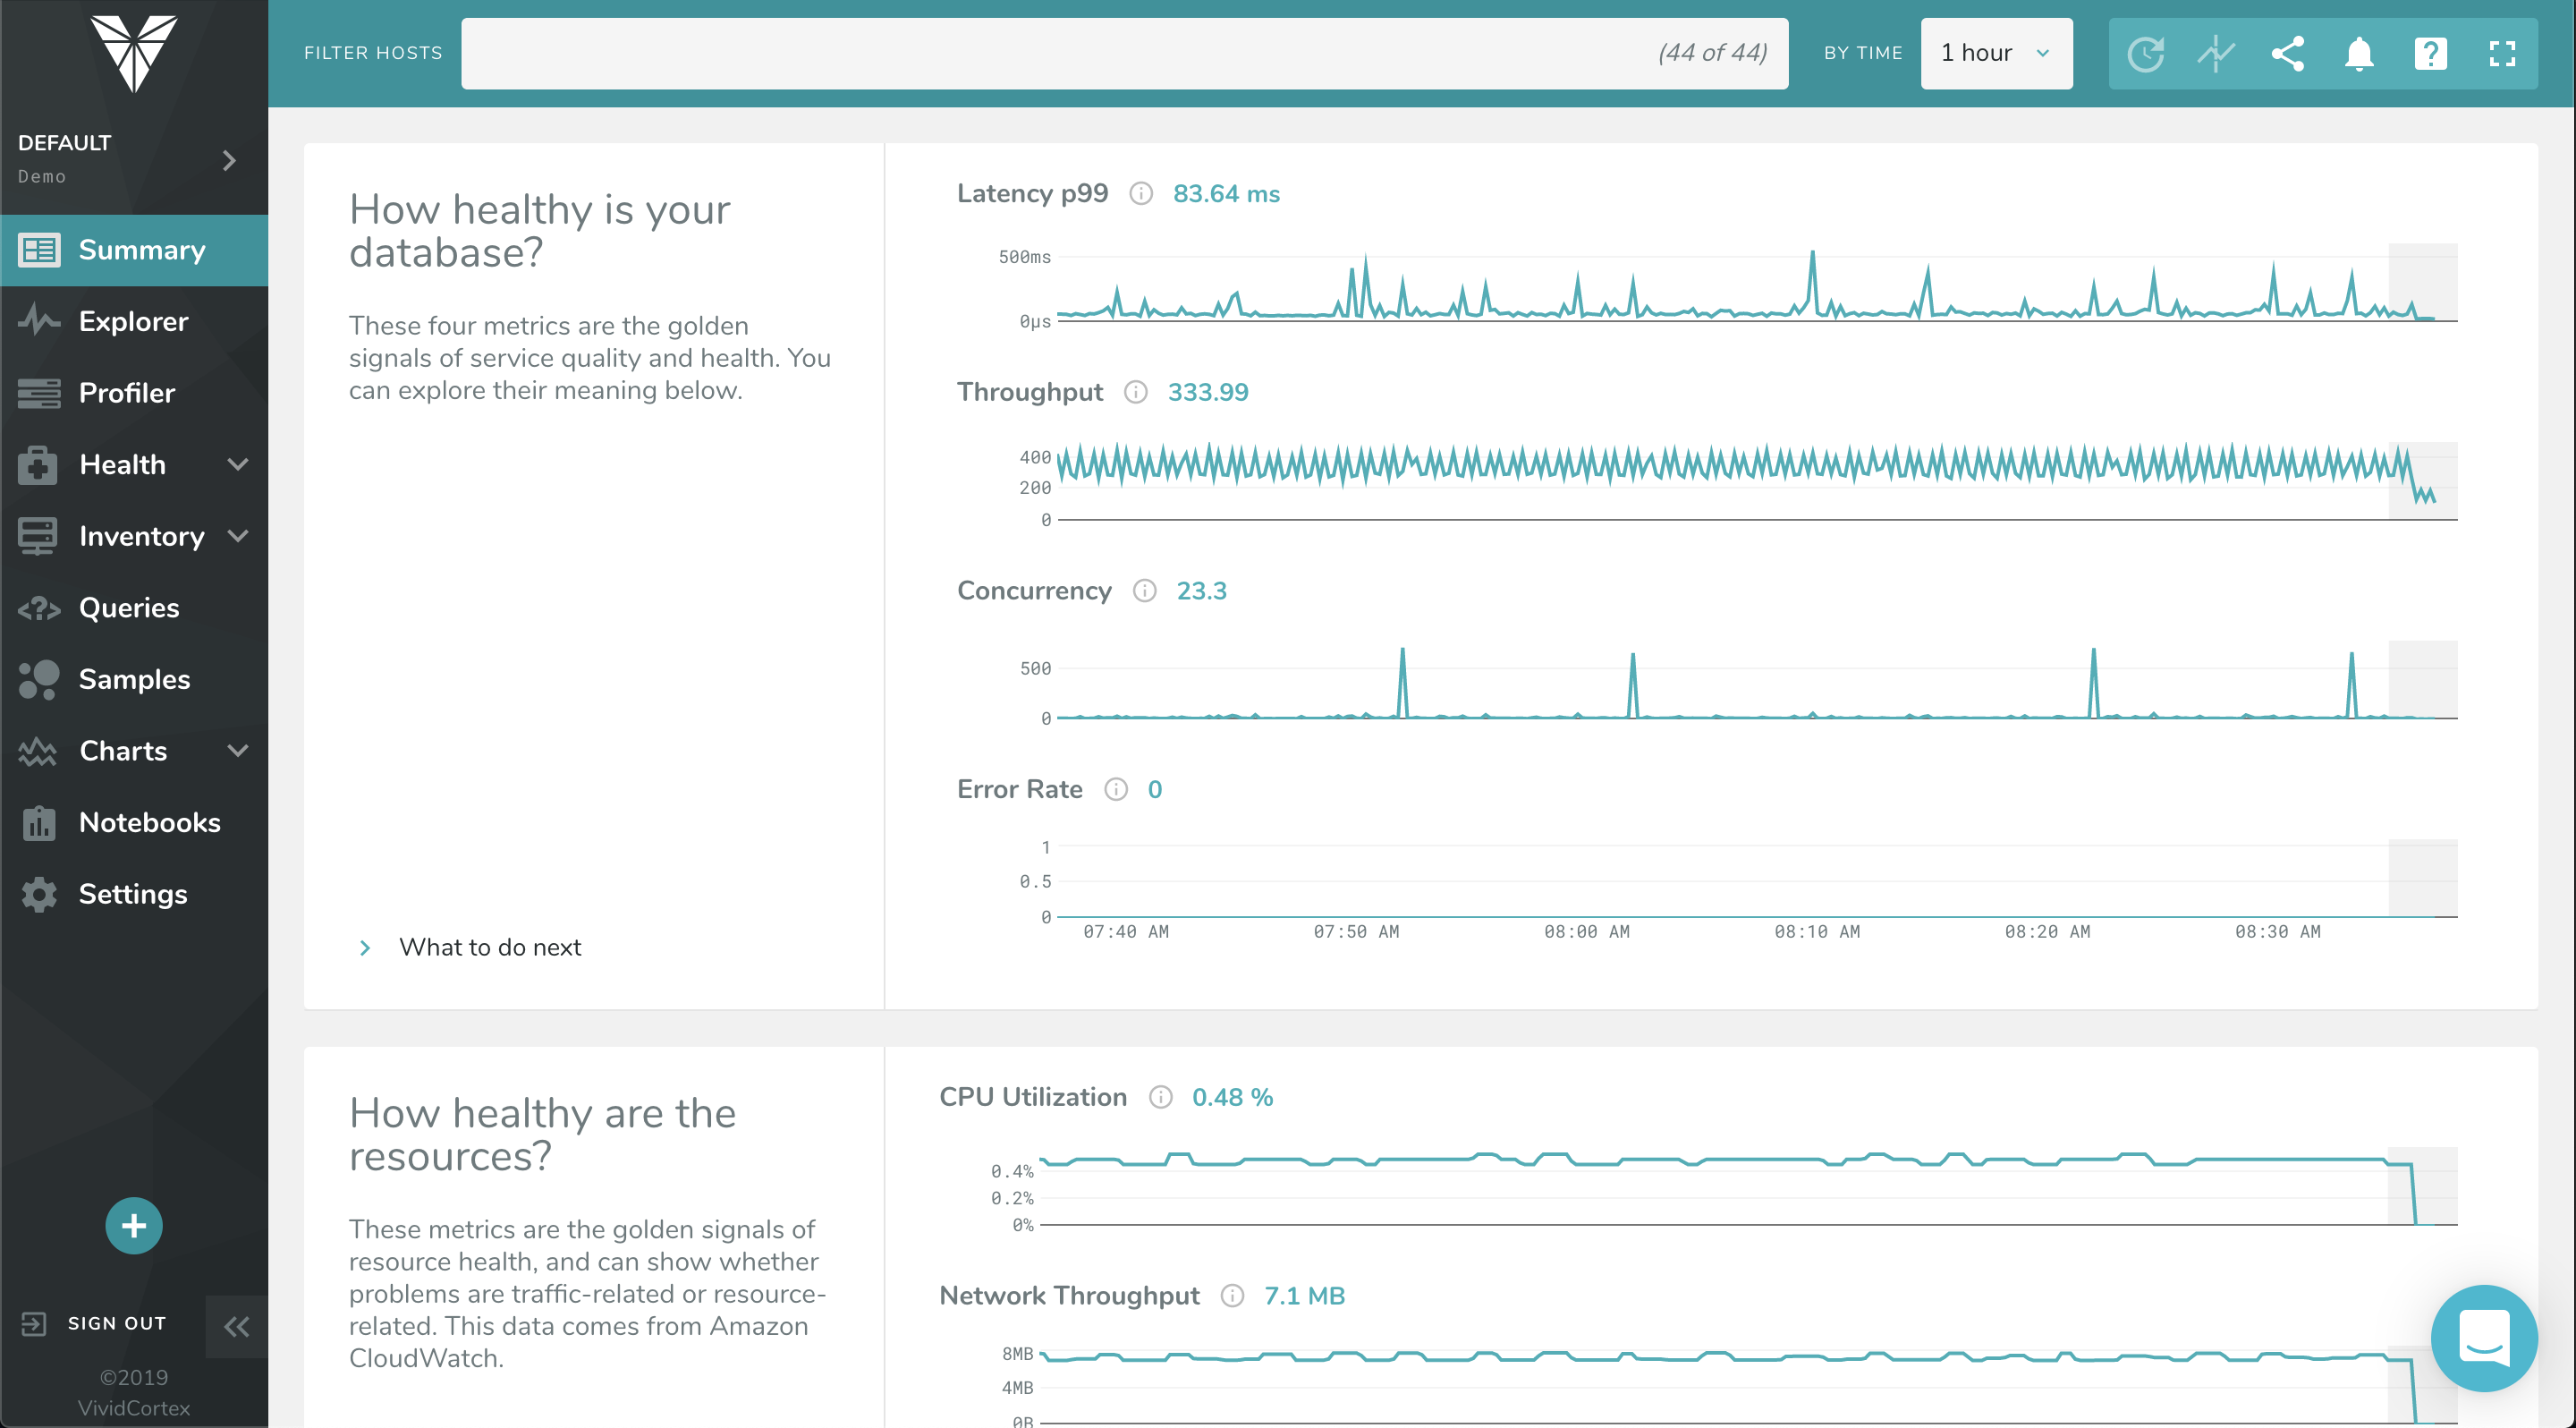
    Screenshot of The Profiler Dashboard is a powerful, dynamic dashboard for ranking and filtering activity on your servers: It can instantly show you what needs attention and it provides a unified view of all your database types that VividCortex monitors. It enables you to view and understand your system by profiling it according to its most significant attributes—customized and selected by you.Screenshot of This dashboard displays a list of queries and allows you to filter them with powerful specificity. Filters can be set according to query text, host, and timeframe when the query was first seen / last active.Screenshot of VividCortex captures an enormous amount of data, and the Summary Dashboard helps users make sense of it, reducing their time-to-insight. It features widgets with automatic displays for Top 5 Queries by Total Time, Top 5 Queries by User CPU, Application Overview, Critical Events, and more.Screenshot of VividCortex monitors thousands of metrics in your system, and the Charts and Dashboard’s navigation pane allows you to toggle, customize, and enable various categories of generated charts. You can then easily navigate and examine the charts’ metrics with mouseover and zoom capabilities.