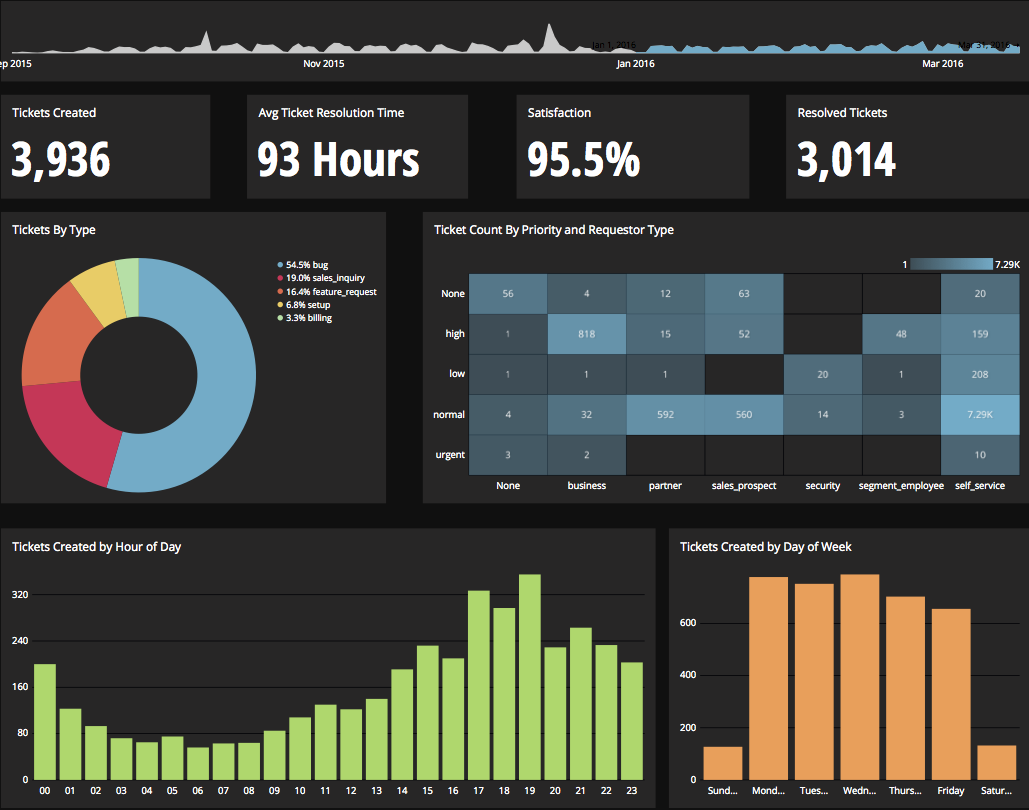
Chartio is a visualization tool designed to enable anyone to explore, transform and visualize data on the fly through a drag-and-drop interface. Chartio was acquired by Atlassian in February 2021 so that it's capabilities could be integrated into the Atlassian product portfolio's capabilities. Chartio is no longer available to new customers, standalone. Existing customers must migrate to alternatives by March 2022, when the service will be retired.
$40
per user/per month
Domo
Score 8.4 out of 10
N/A
Domo is a full self-service business intelligence software that combines several data analysis and reporting tools into one platform. It helps users connect to multiple data sources, create robust visual reports, manage their data, send messages in real-time, manage projects, and develop new apps.
N/A
Pricing
Chartio (discontinued)
Domo
Editions & Modules
Starter
$40
per user/per month
Professional
$60
per user/per month
Organization
Contact sales team
No answers on this topic
Offerings
Pricing Offerings
Chartio (discontinued)
Domo
Free Trial
Yes
Yes
Free/Freemium Version
No
No
Premium Consulting/Integration Services
No
No
Entry-level Setup Fee
No setup fee
No setup fee
Additional Details
—
—
More Pricing Information
Community Pulse
Chartio (discontinued)
Domo
Features
Chartio (discontinued)
Domo
BI Standard Reporting
Comparison of BI Standard Reporting features of Product A and Product B
Chartio (discontinued)
6.0
Ratings
33% below category average
Domo
8.8
Ratings
8% above category average
Pixel Perfect reports
3.60 Ratings
8.50 Ratings
Customizable dashboards
7.70 Ratings
9.40 Ratings
Report Formatting Templates
6.70 Ratings
8.50 Ratings
Ad-hoc Reporting
Comparison of Ad-hoc Reporting features of Product A and Product B
Chartio (discontinued)
5.7
Ratings
33% below category average
Domo
8.6
Ratings
7% above category average
Drill-down analysis
6.90 Ratings
8.00 Ratings
Formatting capabilities
6.10 Ratings
8.00 Ratings
Integration with R or other statistical packages
3.10 Ratings
9.00 Ratings
Report sharing and collaboration
6.50 Ratings
9.40 Ratings
Report Output and Scheduling
Comparison of Report Output and Scheduling features of Product A and Product B
Chartio (discontinued)
3.4
Ratings
85% below category average
Domo
8.2
Ratings
1% below category average
Publish to Web
2.70 Ratings
9.40 Ratings
Publish to PDF
6.10 Ratings
8.00 Ratings
Report Versioning
2.00 Ratings
7.00 Ratings
Report Delivery Scheduling
2.70 Ratings
8.50 Ratings
Data Discovery and Visualization
Comparison of Data Discovery and Visualization features of Product A and Product B
This product is well suited for end users that don't want to get too in depth with reporting. The interface is simple and the default filter options are sufficient for a general report. Example: Total Sum of Net Sales for all products sold in X State between dates X and X. If the need is for a more complex query, then there is the Custom Query option. This would be something that an administrator would have to police as having users writing their own queries could get really messy really fast. I suppose the key questions to ask would be: Do you need a product that will... display all relevant charts/reports in one consistent place? ... be simple for an end user to navigate? ...be web-based and remotely accessed?
Domo is great when you want to see lots of values historically or see data you can see natively in a platform. As I mentioned earlier, Domo is the only way our Marketing and Sales teams can see when their emails were opened and compare the send time - this is an example of data I can't see natively.
Constantly updating: many of the BI tools we looked at were slow to iterate on their product. This was a main selling point for us.
Ease of Use: We have many users that are new to BIs tools and database management in general. BI software as a whole has a pretty steep learning curve for most people, but Chartio does a good job of making things easier all around.
Database Support: It seems as though every department insists on storing their information using different databases. Chartio had support for everyone one we needed which was very helpful.
Provides data acquisition, transformation and visualization all administered from one cloud-based tool. No switching between tools or cobbling different products together.
Provides GUI and MySQL interfaces for data manipulation for both entry-level and advanced users.
Huge amount of data connectors out of the box, plus you can easily create your own custom connectors.
When changing cards from one dataset to another any beast modes are not carried over, it would often make life easier if there was an easier way to copy beast mode calculations from one dataset to another.
Domo documentation, university and Dojo are extremely helpful when we run into problems. However, when support beyond that is needed their help desk seems to have a hefty backlog - the amount of time to resolve tickets is frustrating sometimes.
It has become a core part of the business in terms of identifying the health of our network. If we grow and there are certain things that might not fit well with Chartio (e.g. we'd want to store snapshots of every single day's dash instead of seeing realtime data), it might make sense to move some of the data analysis tool in-house if resources are available.
Domo is a great up-and-coming product. There are many fantastic features that are extremely compelling to our end users, which makes Domo a great fit for our organization. As with many BI tools, there are items on the wish list that could make implementation, administration and usage easier, but I believe these will be addressed over time as the product matures and evolves. The overall concept and approach of this solution has definitely raised the bar in this area of expertise and I would like to see things advance in giving the enterprise tools that will make decision making easier and more robust in the future.
I really like using Chartio. I use it on a daily basis for pulling data from different sources and combining data (the explore tab was a great idea for this use). I think I would give it 8/10 because there needs to be more documentation or maybe blog posts about things people are doing with it. I only have my own ideas about what to do /how to graph things. I know there are some articles, but it would be awesome to have a section on the neat dashboards people are building or how they show data in different ways. Another complaint is how much time it takes to load. I know our databases aren't set up precisely for Chartio and I have been creating data stores. But the data stores have so many more limitations that adds a whole new layer of frustration. Love the product, keep up the good work and the fast fixes.
A business management platform has to be flexible to provide solutions for customers from any business environment, but that flexibility has to be delivered without requiring complex business process re-engineering and massive data conversion efforts. Domo’s web-based architecture and wealth of connectivity options allow rapid setup for any business. If your marketing company is wrestling with channel return on investment or your educational organization is drowning in data, Domo has the tools and capability to use your data and turn it into something useful for you
Pretty responsive. It took a while to get a response in selecting data points for our particular cards. Might have taken about a month? I am not sure if this was something on our end or Domo's end. But haven't had any other issues yet that required additional support from Domo.
I use self learning materials. Pretty helpful. I find myself having to go back to the "drilldown" instructions though, and have a hard time finding hidden variables on a dashboard, so perhaps there is room for intuitive improvements (or maybe I'm just being lazy)
It is a true web-based application so implementation is much easier and smoother compared to other non-web based BI solutions. Also, they offered consulting services during the implementation process, which was helpful. Also, they provided lots of on-demand training courses and videos, which I liked.
Again, Chartio provides the best multi-user presentation ability for us. Other tools are great for slicing and dicing the data, but at the end, you still have to spend time trying to find a way to present it. Chartio has that built in.
Domo is by far the industry leader. Other tools/platforms have unique strengths, but from an overall perspective, Domo is the most versatile and does an exceptional job in all areas. This is critical when it comes to "scale". A BI project may start with a siloed scope, but as the project bares fruit, others begin to ask how they can participate/leverage the tool/platform for their own projects - because of this, Domo's versatility is incredibly important
Chartio has worked well as our datawarehouse has rapidly expanded, and the usability/performance hasn't seemed to have suffered. What we haven't yet realized is additional savings from additional users. We have some dashboard needs for users who truly just view of a few charts, and the licensing structure hasn't yet been structured in a way that would support that type of approach...having 50 "core" licenses, and then potentially several hundred view only licenses for partners that would use the application infrequently.
Domo has allowed us to see much more clearly what is working for students on our programs, and what is not. This enables us to consolidate success and further develop where there are areas of concern.
The verbatim comments in Domo makes the reports especially attractive to staff, since they are able to engage directly with students' personal opinions and not just with rating scales.