Amazon CloudWatch is a native AWS monitoring tool for AWS programs. It provides data collection and resource monitoring capabilities.
$0
per canary run
SolarWinds Server & Application Monitor
Score 7.5 out of 10
N/A
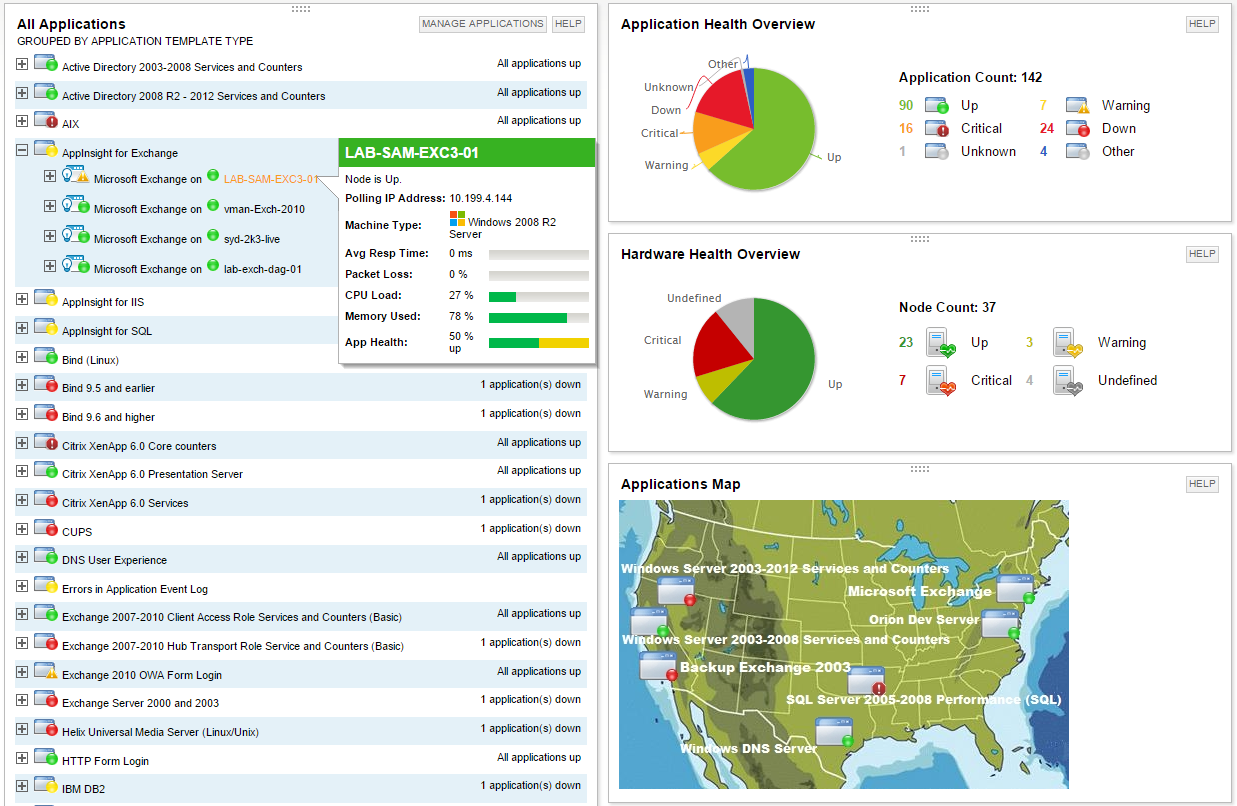
SolarWinds Server & Application Monitor (SAM) delivers application and server monitoring capabilities. SAM allows for self-service for easy setup, 1200+ monitoring templates, and customization options, as well as integrate with other SolarWinds products.
N/A
Pricing
Amazon CloudWatch
SolarWinds Server & Application Monitor
Editions & Modules
Canaries
$0.0012
per canary run
Logs - Analyze (Logs Insights queries)
$0.005
per GB of data scanned
Over 1,000,000 Metrics
$0.02
per month
Contributor Insights - Matched Log Events
$0.02
per month per one million log events that match the rule
Logs - Store (Archival)
$0.03
per GB
Next 750,000 Metrics
$0.05
per month
Next 240,000 Metrics
$0.10
per month
Alarm - Standard Resolution (60 Sec)
$0.10
per month per alarm metric
First 10,000 Metrics
$0.30
per month
Alarm - High Resolution (10 Sec)
$0.30
per month per alarm metric
Alarm - Composite
$0.50
per month per alarm
Logs - Collect (Data Ingestion)
$0.50
per GB
Contributor Insights
$0.50
per month per rule
Events - Custom
$1.00
per million events
Events - Cross-account
$1.00
per million events
CloudWatch RUM
$1
per 100k events
Dashboard
$3.00
per month per dashboard
CloudWatch Evidently - Events
$5
per 1 million events
CloudWatch Evidently - Analysis Units
$7.50
per 1 million analysis units
No answers on this topic
Offerings
Pricing Offerings
Amazon CloudWatch
SolarWinds Server & Application Monitor
Free Trial
Yes
Yes
Free/Freemium Version
Yes
No
Premium Consulting/Integration Services
Yes
No
Entry-level Setup Fee
No setup fee
No setup fee
Additional Details
With Amazon CloudWatch, there is no up-front commitment or minimum fee; you simply pay for what you use. You will be charged at the end of the month for your usage.
As CloudWatch is integrated into AWS already, its ready to go. External products such as Nagios require a fair bit of work to actually get the metrics into the dashboards. Products like SolarWinds and Datadog provide quite a high level of very easy integration which allows for …
For out business we find that AWS Cloudwatch is good at providing real-time metrics for monitoring and analysing the performance and usage of our platform by customers. It is possible to create custom metrics from log events, such people adding items to a basket, checking out or abandoning their orders.
For monitoring applications that run on Windows hosts on VMware or HyperV virtualization, SolarWindows offers a nice, vertical view of both the loads and the resources. In such an environment, this makes life really good! But if you have something else -- for example, Linux hosts -- you're on your own to some extent. That is, the things it does well, it does very well -- but everything else is much less polished.
It provides lot many out of the box dashboard to observe the health and usage of your cloud deployments. Few examples are CPU usage, Disk read/write, Network in/out etc.
It is possible to stream CloudWatch log data to Amazon Elasticsearch to process them almost real time.
If you have setup your code pipeline and wants to see the status, CloudWatch really helps. It can trigger lambda function when certain cloudWatch event happens and lambda can store the data to S3 or Athena which Quicksight can represent.
Memory metrics on EC2 are not available on CloudWatch. Depending on workloads if we need visibility on memory metrics we use Solarwinds Orion with the agent installed. For scalable workloads, this involves customization of images being used.
Visualization out of the box. But this can easily be addressed with other solutions such as Grafana.
By design, this is only used for AWS workloads so depending on your environment cannot be used as an all in one solution for your monitoring.
Provides basic monitoring/visibility. Visibility into detailed/fine-grained issues best suited for more specialized/expensive solutions.
Licensing per monitored application rapidly uses up purchased license count.
More out-of-the-box templates or easier setup of monitoring less-common applications would make the solution more appealing given the target audience of the product.
We are heavily invested in Solarwinds products for a reason. They are generally easy to setup and run with, requiring only some interfacing with support or help articles on rare occasions. They do what we bought them to do and we can't ask for more.
It's excellent at collecting logs. It's easy to set up. The viewing & querying part could be much better, though. The query syntax takes some time to get used to, & the examples are not helpful. Also, while being great, Log Insights requires manual picking of log streams to query across every time.
SolarWinds Server & Application Monitor is quite easy to use and super versatile. It allows you to do just about anything you can through premade templates or through scripting. You can use an agent on the servers if you want to, or you can monitor through WMI or SNMP credentials. You can customize thresholds for alerting quickly, and you can configure alerts to be as complex or as simple as you want.
The graphical interface and the performance of the database leave a little to be desired, they could be better explored.Some functionality and screens do not work well depending on the browser used. The integrations never had any problems or caused crashes in other systems.
Support is effective, and we were able to get any problems that we couldn't get solved through community discussion forums solved for us by the AWS support team. For example, we were assisted in one instance where we were not sure about the best metrics to use in order to optimize an auto-scaling group on EC2. The support team was able to look at our metrics and give a useful recommendation on which metrics to use.
I think there was only a couple times I had to open a support case for SAM and one time they got multiple engineers on the phone to get a better idea what I was trying to monitor and was able to point me in the best direction to monitor that system.
Grafana is definitely a lot better and flexible in comparison with Amazon CloudWatch for visualisation, as it offers much more options and is versatile. VictoriaMetrics and Prometheus are time-series databases which can do almost everything cloudwatch can do in a better and cheaper way. Integrating Grafana with them will make it more capable Elasticsearch for log retention and querying will surpass cloudwatch log monitoring in both performance and speed
It has been a while since we first purchased SolarWinds, but I looked over several other products that I can't remember now. Many other products tried to scan the network to find computers but given that our computers are located in various places across campus with other computers in our buildings that are not ours that type of network scanning was not what we needed. Other services have extra services that we had no need of and I liked the ability to add custom fields in SolarWinds so we can track the information on each computer that we need to know.
Less time spent investigating causes of issues. We are alerted straight away and can find the root cause of the issue in less time.
We have been able to ditch all our previous individual monitoring solutions, none of which integrated with each other for a single solution which fully integrates with each of the different modules to provide a single portal for monitoring and alerting.