
Splunk Observability Cloud vs. TrackJS
Splunk Observability Cloud vs. TrackJS
| Product | Rating | Most Used By | Product Summary | Starting Price |
|---|---|---|---|---|
 Splunk Observability Cloud | N/A | Splunk Observability Cloud aims to enable operational agility and better customer experience through real-time AI-driven streaming analytics allowing accurate alerts in seconds. It is designed to shorten MTTD and MTTR by providing real-time visibility into cloud infrastructure and services. | $15 per month (billed annually) per host | |
 TrackJS | N/A | TrackJS is an error monitoring service for web applications. It provides enhanced stack traces and detailed telemetry for developers to understand how an error happened, how to recreate it, and how to fix it. | N/A |
| Splunk Observability Cloud | TrackJS | |||||||||||||||
|---|---|---|---|---|---|---|---|---|---|---|---|---|---|---|---|---|
| Editions & Modules |
| No answers on this topic | ||||||||||||||
| Offerings |
| |||||||||||||||
| Entry-level Setup Fee | No setup fee | $49 monthly page views | ||||||||||||||
| Additional Details | — | — | ||||||||||||||
| More Pricing Information | ||||||||||||||||
| Splunk Observability Cloud | TrackJS |
|---|
| Splunk Observability Cloud | TrackJS | |||||||||||||||||||||
|---|---|---|---|---|---|---|---|---|---|---|---|---|---|---|---|---|---|---|---|---|---|---|
| Application Performance Management |
|
| Splunk Observability Cloud | TrackJS | |
|---|---|---|
| Small Businesses |  InfluxDB Score 8.8 out of 10 |  GitLab Score 8.7 out of 10 |
| Medium-sized Companies |  Sumo Logic Score 9.4 out of 10 |  ManageEngine Site24x7 Score 9.8 out of 10 |
| Enterprises |  NetBrain Technologies Score 9.2 out of 10 | ManageEngine Site24x7 Score 9.8 out of 10 |
| All Alternatives | View all alternatives | View all alternatives |
| Splunk Observability Cloud | TrackJS | |
|---|---|---|
| Likelihood to Recommend | 8.6 (0 ratings) | 8.0 (0 ratings) |
| Likelihood to Renew | 6.4 (0 ratings) | - (0 ratings) |
| Usability | 7.3 (0 ratings) | - (0 ratings) |
| Splunk Observability Cloud | TrackJS | |
|---|---|---|
| Likelihood to Recommend | 
| 
|
| Pros |
|
|
| Cons |
|
|
| Likelihood to Renew |
| No answers on this topic |
| Usability |
| No answers on this topic |
| Support Rating |
 Giuseppe Cusello GRC Director | No answers on this topic |
| Implementation Rating |
Giuseppe Cusello GRC Director | No answers on this topic |
| Alternatives Considered |
| |
| Return on Investment |
|
|
| ScreenShots | Splunk Observability Cloud Screenshots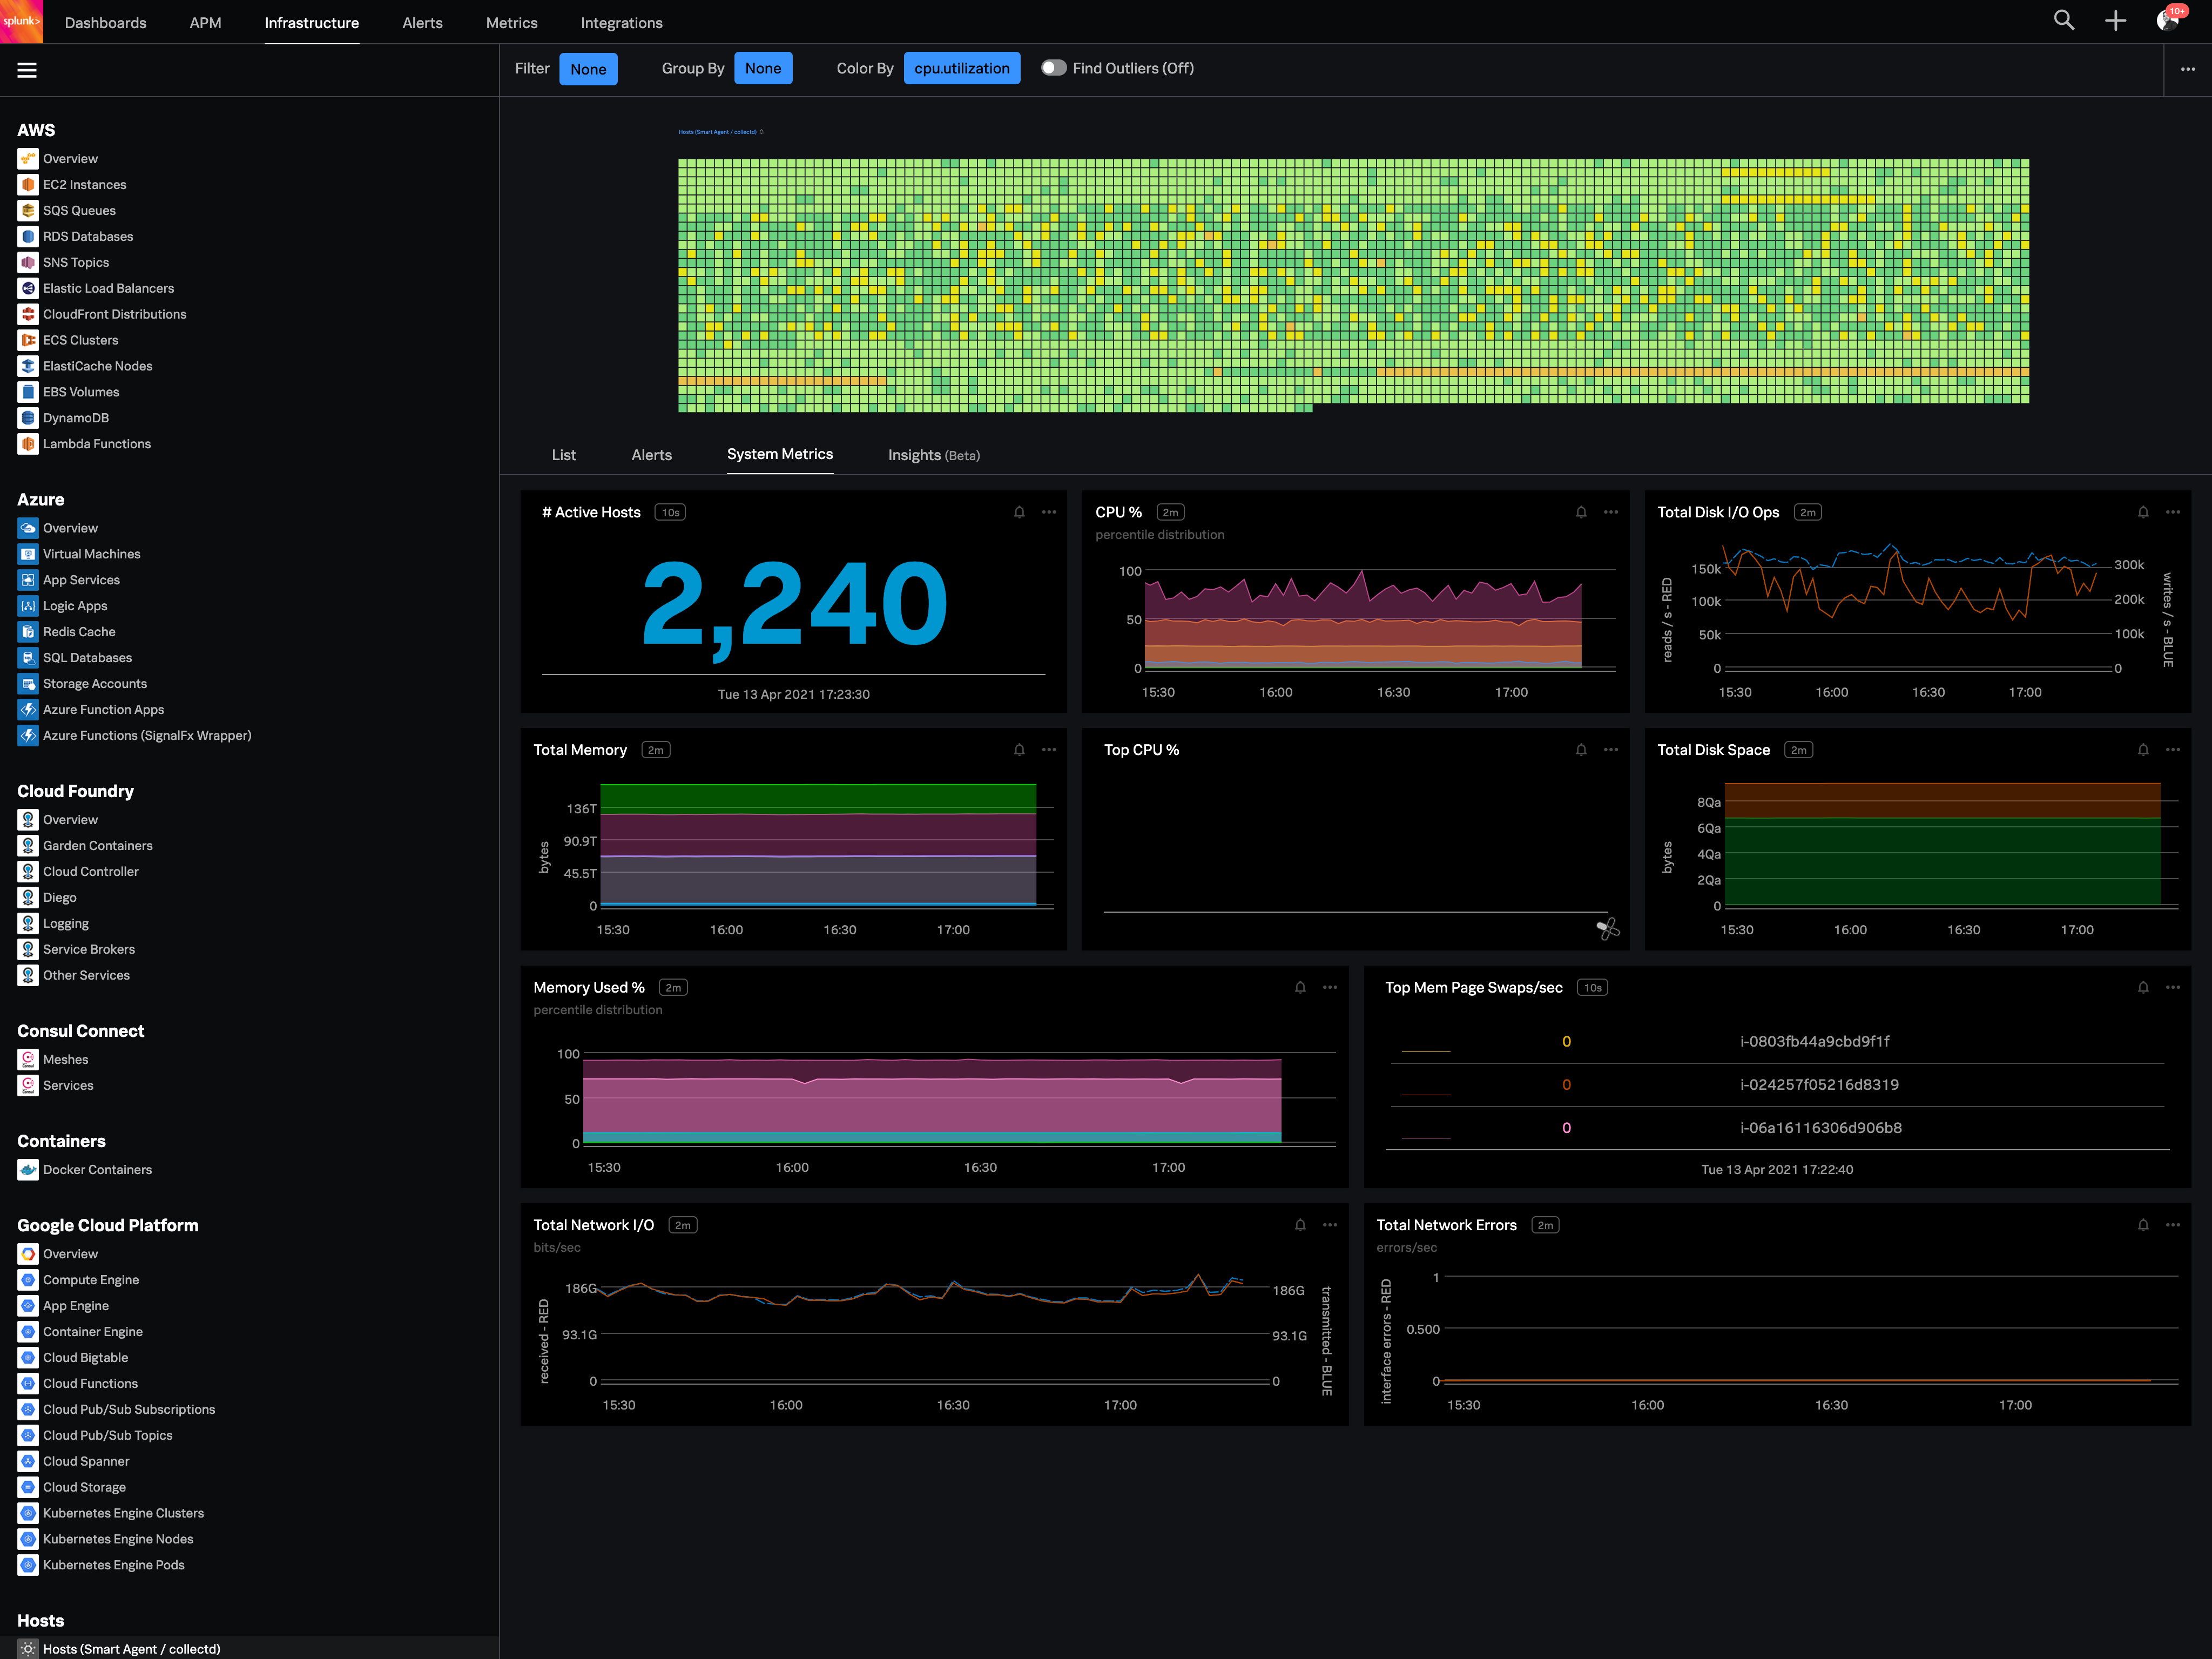 | TrackJS Screenshots    |