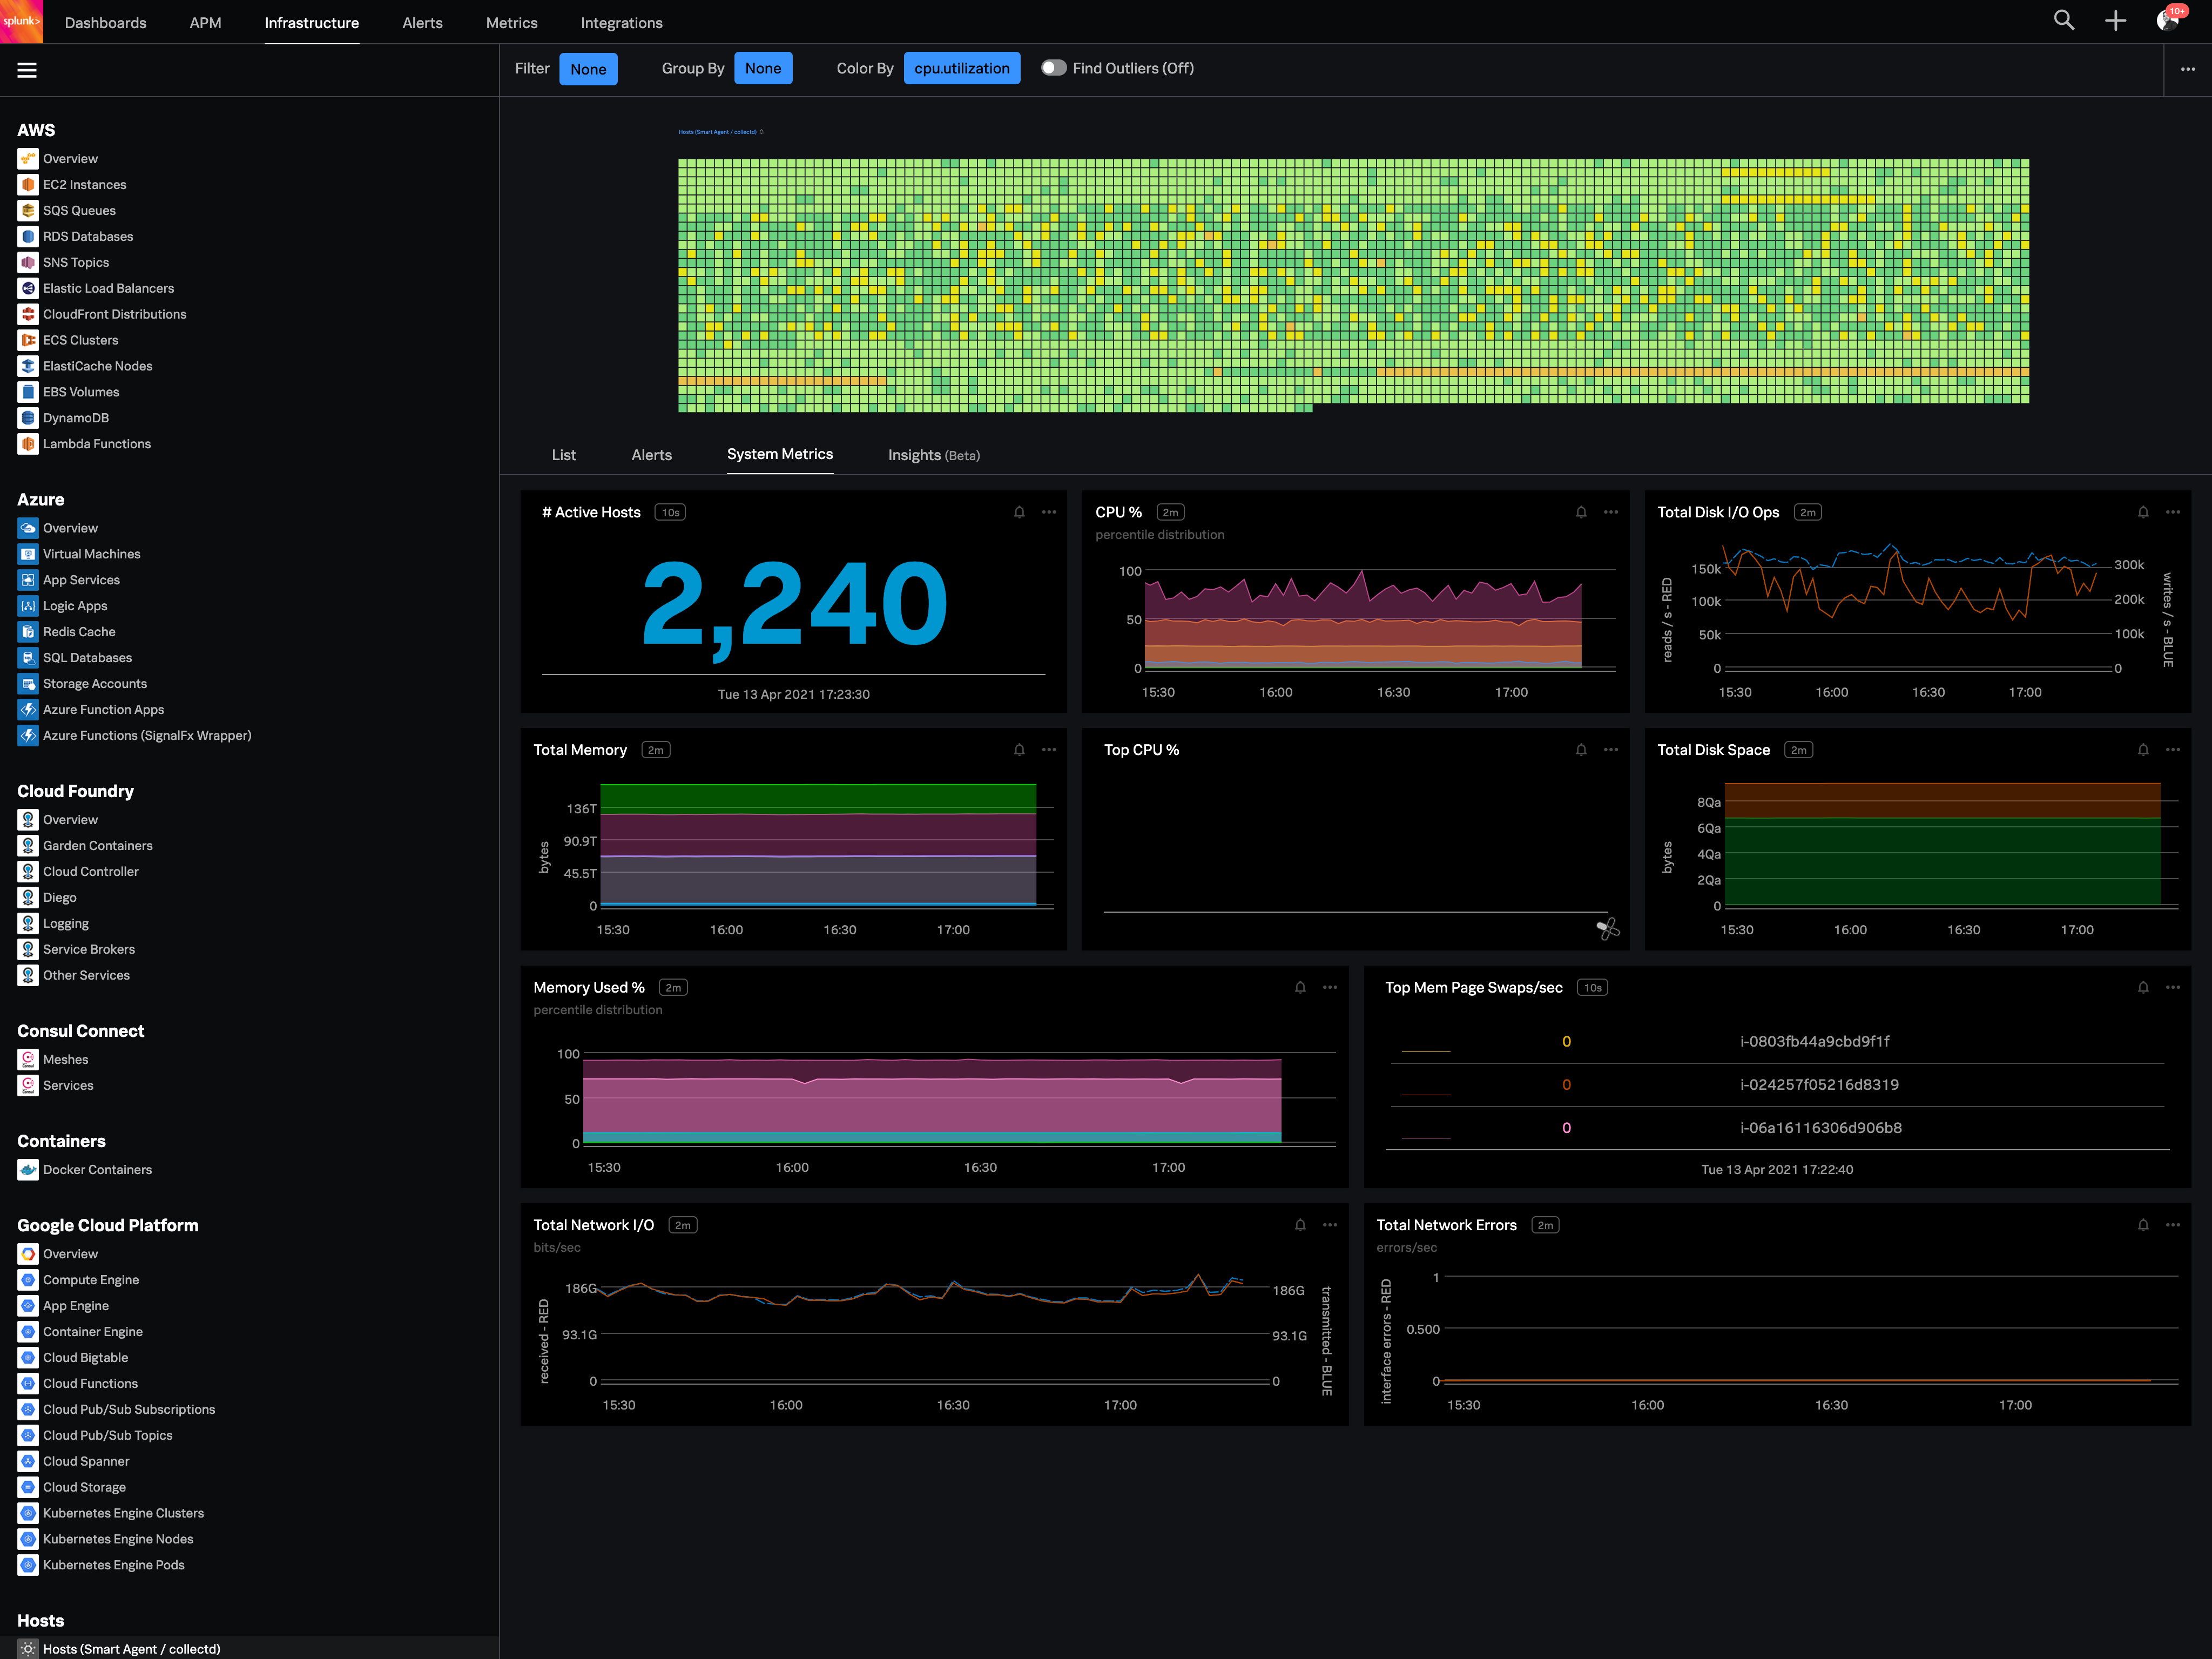
Splunk Observability Cloud aims to enable operational agility and better customer experience through real-time AI-driven streaming analytics allowing accurate alerts in seconds. It is designed to shorten MTTD and MTTR by providing real-time visibility into cloud infrastructure and services.
$180
per year per host
SolarWinds SQL Sentry
Score9 out of 10
N/A
SolarWinds SQL Sentry is designed to help data professionals optimize SQL Server database performance
in physical, virtual, and cloud environments. SQL Sentry delivers metrics to help users find and fix database performance problems
and provides scalability, boasting demonstrated success monitoring 800+ SQL
Server instances with one monitoring database. With
SQL Sentry, the user can monitor:
SQL Server
Azure SQL
Database
SQL Server
Analysis…
Its great if you need real-time visibility across complex or regulated environments. Also strong for hybrid or multi-cloud setups where uptime, observability and fast IR are required. It’s probably overkill for smaller teams or environments that don’t have constant changes or compliance reporting needs. It's expensive and has a steep learning curve. Also, in my opinion, do not get yourself into a consumption based model. Costs can certainly get out of control quickly.
A de minimis incentive was given to thank the reviewer for their time. The incentive was not used to bias or drive a particular response, nor was the incentive contingent on a positive endorsement. TR verified that a representative sample of customers was invited. More Info
This solution is perfect for a team with a large server count and, at least, moderate experience supporting a SQL Server environment. If the environment is smaller or the team has less experience working with SQL Server performance tuning methodologies, then the tool may be overwhelming for the users.
A de minimis incentive was given to thank the reviewer for their time. The incentive was not used to bias or drive a particular response, nor was the incentive contingent on a positive endorsement. More Info
The first one is its Kubernetes container monitoring.
I really like this features because as we know how much K8s is vast and to manually monitor each part of the Kubernetes it takes so much time but Splunk Observability Cloud makes it easier. And even once we integrate K8s with Splunk Observability Cloud it gives us some prebuilt dashboards which gives holistic view of our Cluster and its nodes, pods, etc.
The dashbaord feature of Splunk Observability Cloud, it gives us full flexibility to customize our dashboard with a wide range of predefined chart types.
Now it also supports OTEL, which is a plus point for observability. As now everyone is moving towards Otel and in current market there are only few tools who supports OTEL based integrations, Splunk Observability Cloud is one out of them.
A de minimis incentive was given to thank the reviewer for their time. The incentive was not used to bias or drive a particular response, nor was the incentive contingent on a positive endorsement. TR verified that a representative sample of customers was invited. More Info
The Top SQL functionality has been extremely useful for identifying poorly performing queries by resource consumption.
The flexibility of creating your own Advisory Conditions has allowed us to integrate our custom internal alerts into a centralized dashboard and alerting platform.
Being able to highlight any chart on the dashboard and then tool-matching that window across all the other charts makes it much easier to correlate the different performance metrics against each other.
A de minimis incentive was given to thank the reviewer for their time. The incentive was not used to bias or drive a particular response, nor was the incentive contingent on a positive endorsement. More Info
You can use table-like functionality to generate dashboards, but these queries are heavy on the system.
It could be easier to give insight into what type of line parsing is used for specific documents in a company-managed environment and/or show ways to gain the insights needed.
I would like to see ways to anonymize specific data for shared reports without pre-formatting this in a dashboard on which reports could be based.
A de minimis incentive was given to thank the reviewer for their time. The incentive was not used to bias or drive a particular response, nor was the incentive contingent on a positive endorsement. More Info
Tuning advice: With all the graphs and data available, it's not always easy to determine the best thing to do. I'd like to see SentryOne provide some best practice analysis based on the historical information collected for the server being looked at.
They could add help tips or links to help documents, when you select a graph on the dashboard. Inexperienced users tend to put blinders on and focus on one thing when they see a high counter or something out of the ordinary. It would be very useful to include a link that provides underlying help. The link would provide an explanation of the counter in detail and offer possible explanations as to why the counter is off.
Good: Stable system with low error rate Easy to use for simple use cases Bad: UI is not very clear for complex usage Mobile view (when logged in from phone) is bad No library for .net
A de minimis incentive was given to thank the reviewer for their time. The incentive was not used to bias or drive a particular response, nor was the incentive contingent on a positive endorsement. More Info
Absolutely. SQL Sentry is an absolute must have for any company with a SQL Server estate. It provides a force multiplier to effectively manage SQL Server, and the feature sets are second to none. The support and expertise at SentryOne is incredible. They are very supportive of both the platform users and helping your business with the product
A de minimis incentive was given to thank the reviewer for their time. The incentive was not used to bias or drive a particular response, nor was the incentive contingent on a positive endorsement. More Info
When there is an issue, it’s a win if one can easily identify the root cause. To do the same, it should allow the user to dig deep with multiple data points and compare the data and identify the anomaly. In this use case, it’s good to drive from Splunk 011y.
A de minimis incentive was given to thank the reviewer for their time. The incentive was not used to bias or drive a particular response, nor was the incentive contingent on a positive endorsement. More Info
I accept that the flexibility of the alerting comes at a price. Other than the alerting SQL Sentry's interface is intuitive. Connecting to a new SQL instance, given that all the needed ports are open in your firewalls is straight forward. Reviewing the performance and queries for an instance is available in with a right click. As you dig in new tabs are created to present the detailed data. I find the ability to filter and rollup metrics on a query very helpful in dealing with the "it's running slow". You can easily compare the metrics of run times for the same query to let the user know, it's probably data your doing a billion reads instead of the usual 100 thousand.
A de minimis incentive was given to thank the reviewer for their time. The incentive was not used to bias or drive a particular response, nor was the incentive contingent on a positive endorsement. TR verified that a representative sample of customers was invited. More Info
The system is working perfectly in capturing data, but we do experience issues with SQL Timeout when viewing results in the remote clients. This may be due to the fact that our monitoring service is consuming most of the CPU, and it is the same server that is hosting the SQL Repository. We could probably fix the issue by separating the SQL instance from the monitoring service.
A de minimis incentive was given to thank the reviewer for their time. The incentive was not used to bias or drive a particular response, nor was the incentive contingent on a positive endorsement. More Info
In most cases the pages load very quickly. In our particular case, we need to do some movement of services to separate our monitoring service to separate infrastructure from the repository. When we first started with SQL Sentry on 5 licenses, we did not have any issues. Since we have now grown that to 25, we are experiencing some challenges. We do not believe this to be a tool problem
A de minimis incentive was given to thank the reviewer for their time. The incentive was not used to bias or drive a particular response, nor was the incentive contingent on a positive endorsement. More Info
A de minimis incentive was given to thank the reviewer for their time. The incentive was not used to bias or drive a particular response, nor was the incentive contingent on a positive endorsement. More Info
From their infancy as a smaller company to now as a global player they have always kept focus on prioritising he customer. They know their product and the technology it supports and are easily accessible for both resolving problems with the product all the way to adding value through additional training and assisting with getting return on investment through utilisation of the many features the product provides.
A de minimis incentive was given to thank the reviewer for their time. The incentive was not used to bias or drive a particular response, nor was the incentive contingent on a positive endorsement. TR verified that a representative sample of customers was invited. More Info
A de minimis incentive was given to thank the reviewer for their time. The incentive was not used to bias or drive a particular response, nor was the incentive contingent on a positive endorsement. TR verified that a representative sample of customers was invited. More Info
A de minimis incentive was given to thank the reviewer for their time. The incentive was not used to bias or drive a particular response, nor was the incentive contingent on a positive endorsement. More Info
Was suggested that we install the process monitors on a dev or qa database server, but we found it more useful to create an IT db server and put it there (along with a few other apps that we use for monitoring).
A de minimis incentive was given to thank the reviewer for their time. The incentive was not used to bias or drive a particular response, nor was the incentive contingent on a positive endorsement. More Info
Splunk Infrastructure Monitoring provides far superior options for anybody using a complex hybrid multi-cloud environment and allows both your SOC and NOC to work together on the same data while driving their own insights. We found other products are still in the old world view of servers and agents residing together within a single data centre, but modern apps are no longer like this.
A de minimis incentive was given to thank the reviewer for their time. The incentive was not used to bias or drive a particular response, nor was the incentive contingent on a positive endorsement. More Info
SQL Sentry offers more features and is customize-able to fit our business needs. It has more centralized management and support. The company's technical support is also top notch. It is also worth mentioning that SentryOne Team Blog is an excellent source. One can find lots of valuable troubleshooting skills on the blog site - very educational and informational.
A de minimis incentive was given to thank the reviewer for their time. The incentive was not used to bias or drive a particular response, nor was the incentive contingent on a positive endorsement. More Info
We are running 25 instances through a single monitoring service and it is able to keep up. We are finding that this many instances in our environment is about as many as can be handled. We will need to deploy additional monitoring services. Luckily, there is no additional licensing costs to deploy additional monitoring services. For us, it's just an additional Azure VM.
A de minimis incentive was given to thank the reviewer for their time. The incentive was not used to bias or drive a particular response, nor was the incentive contingent on a positive endorsement. More Info
A de minimis incentive was given to thank the reviewer for their time. The incentive was not used to bias or drive a particular response, nor was the incentive contingent on a positive endorsement. More Info
Better customer service as it alerts me automatically to loss of service issues so I can react and either get things fixed before it impacts the customers or to let my management know as soon as possible
It helps me find expensive SQL so our customers get better performance and we make better use of our resources
A de minimis incentive was given to thank the reviewer for their time. The incentive was not used to bias or drive a particular response, nor was the incentive contingent on a positive endorsement. More Info