AppDynamics is an APM and Mobile APM program, with application mapping and predictive capabilities. These capacities enable automated remediation and code-level diagnostics in real time. It can be deployed on-premise or as a SaaS.
N/A
Splunk Observability Cloud
Score 9.0 out of 10
N/A
Splunk Observability Cloud aims to enable operational agility and better customer experience through real-time AI-driven streaming analytics allowing accurate alerts in seconds. It is designed to shorten MTTD and MTTR by providing real-time visibility into cloud infrastructure and services.
$15
per month (billed annually) per host
Pricing
Splunk AppDynamics
Splunk Observability Cloud
Editions & Modules
No answers on this topic
Infrastructure
$15
per month (billed annually) per host
App & Infra
$60
per month (billed annually) per host
End-to-End
$75
per month (billed annually) per host
Offerings
Pricing Offerings
Splunk AppDynamics
Splunk Observability Cloud
Free Trial
Yes
Yes
Free/Freemium Version
Yes
No
Premium Consulting/Integration Services
No
No
Entry-level Setup Fee
No setup fee
No setup fee
Additional Details
—
—
More Pricing Information
Community Pulse
Splunk AppDynamics
Splunk Observability Cloud
Features
Splunk AppDynamics
Splunk Observability Cloud
Application Performance Management
Comparison of Application Performance Management features of Product A and Product B
Platforms for software as a service (SaaS) frequently cater to a large number of users with a variety of needs and usage patterns. Because AppDynamics offers multi-tenant monitoring capabilities to track performance across various customer environments, it is a good choice for SaaS platform monitoring. SaaS providers can maximize resource utilization, proactively detect and resolve performance issues, and provide a dependable and consistent user experience for their clients with AppDynamics.
The query language is relatively easy and flexible when looking into an application's problems. These queries can then be used for alerts, reports, and dashboards. I believe Splunk is a platform that can help a system grow into its proactive application management, using incidents to add insights as needed without trying to work out every scenario in advance.
AppDynamics excels in creating dynamic baselines for application performance. For instance, during periods of varying workloads, it automatically adjusts performance baselines. This adaptive baseline creation helps in accurately detecting anomalies and deviations, ensuring that abnormal behavior is quickly identified and addressed.
The scalability of an organization's apps can be evaluated with the assistance of AppDynamics. It gives insights into how effectively programs can handle increased workloads, helping to proactively address scalability concerns before they impair performance.
The first one is its Kubernetes container monitoring.
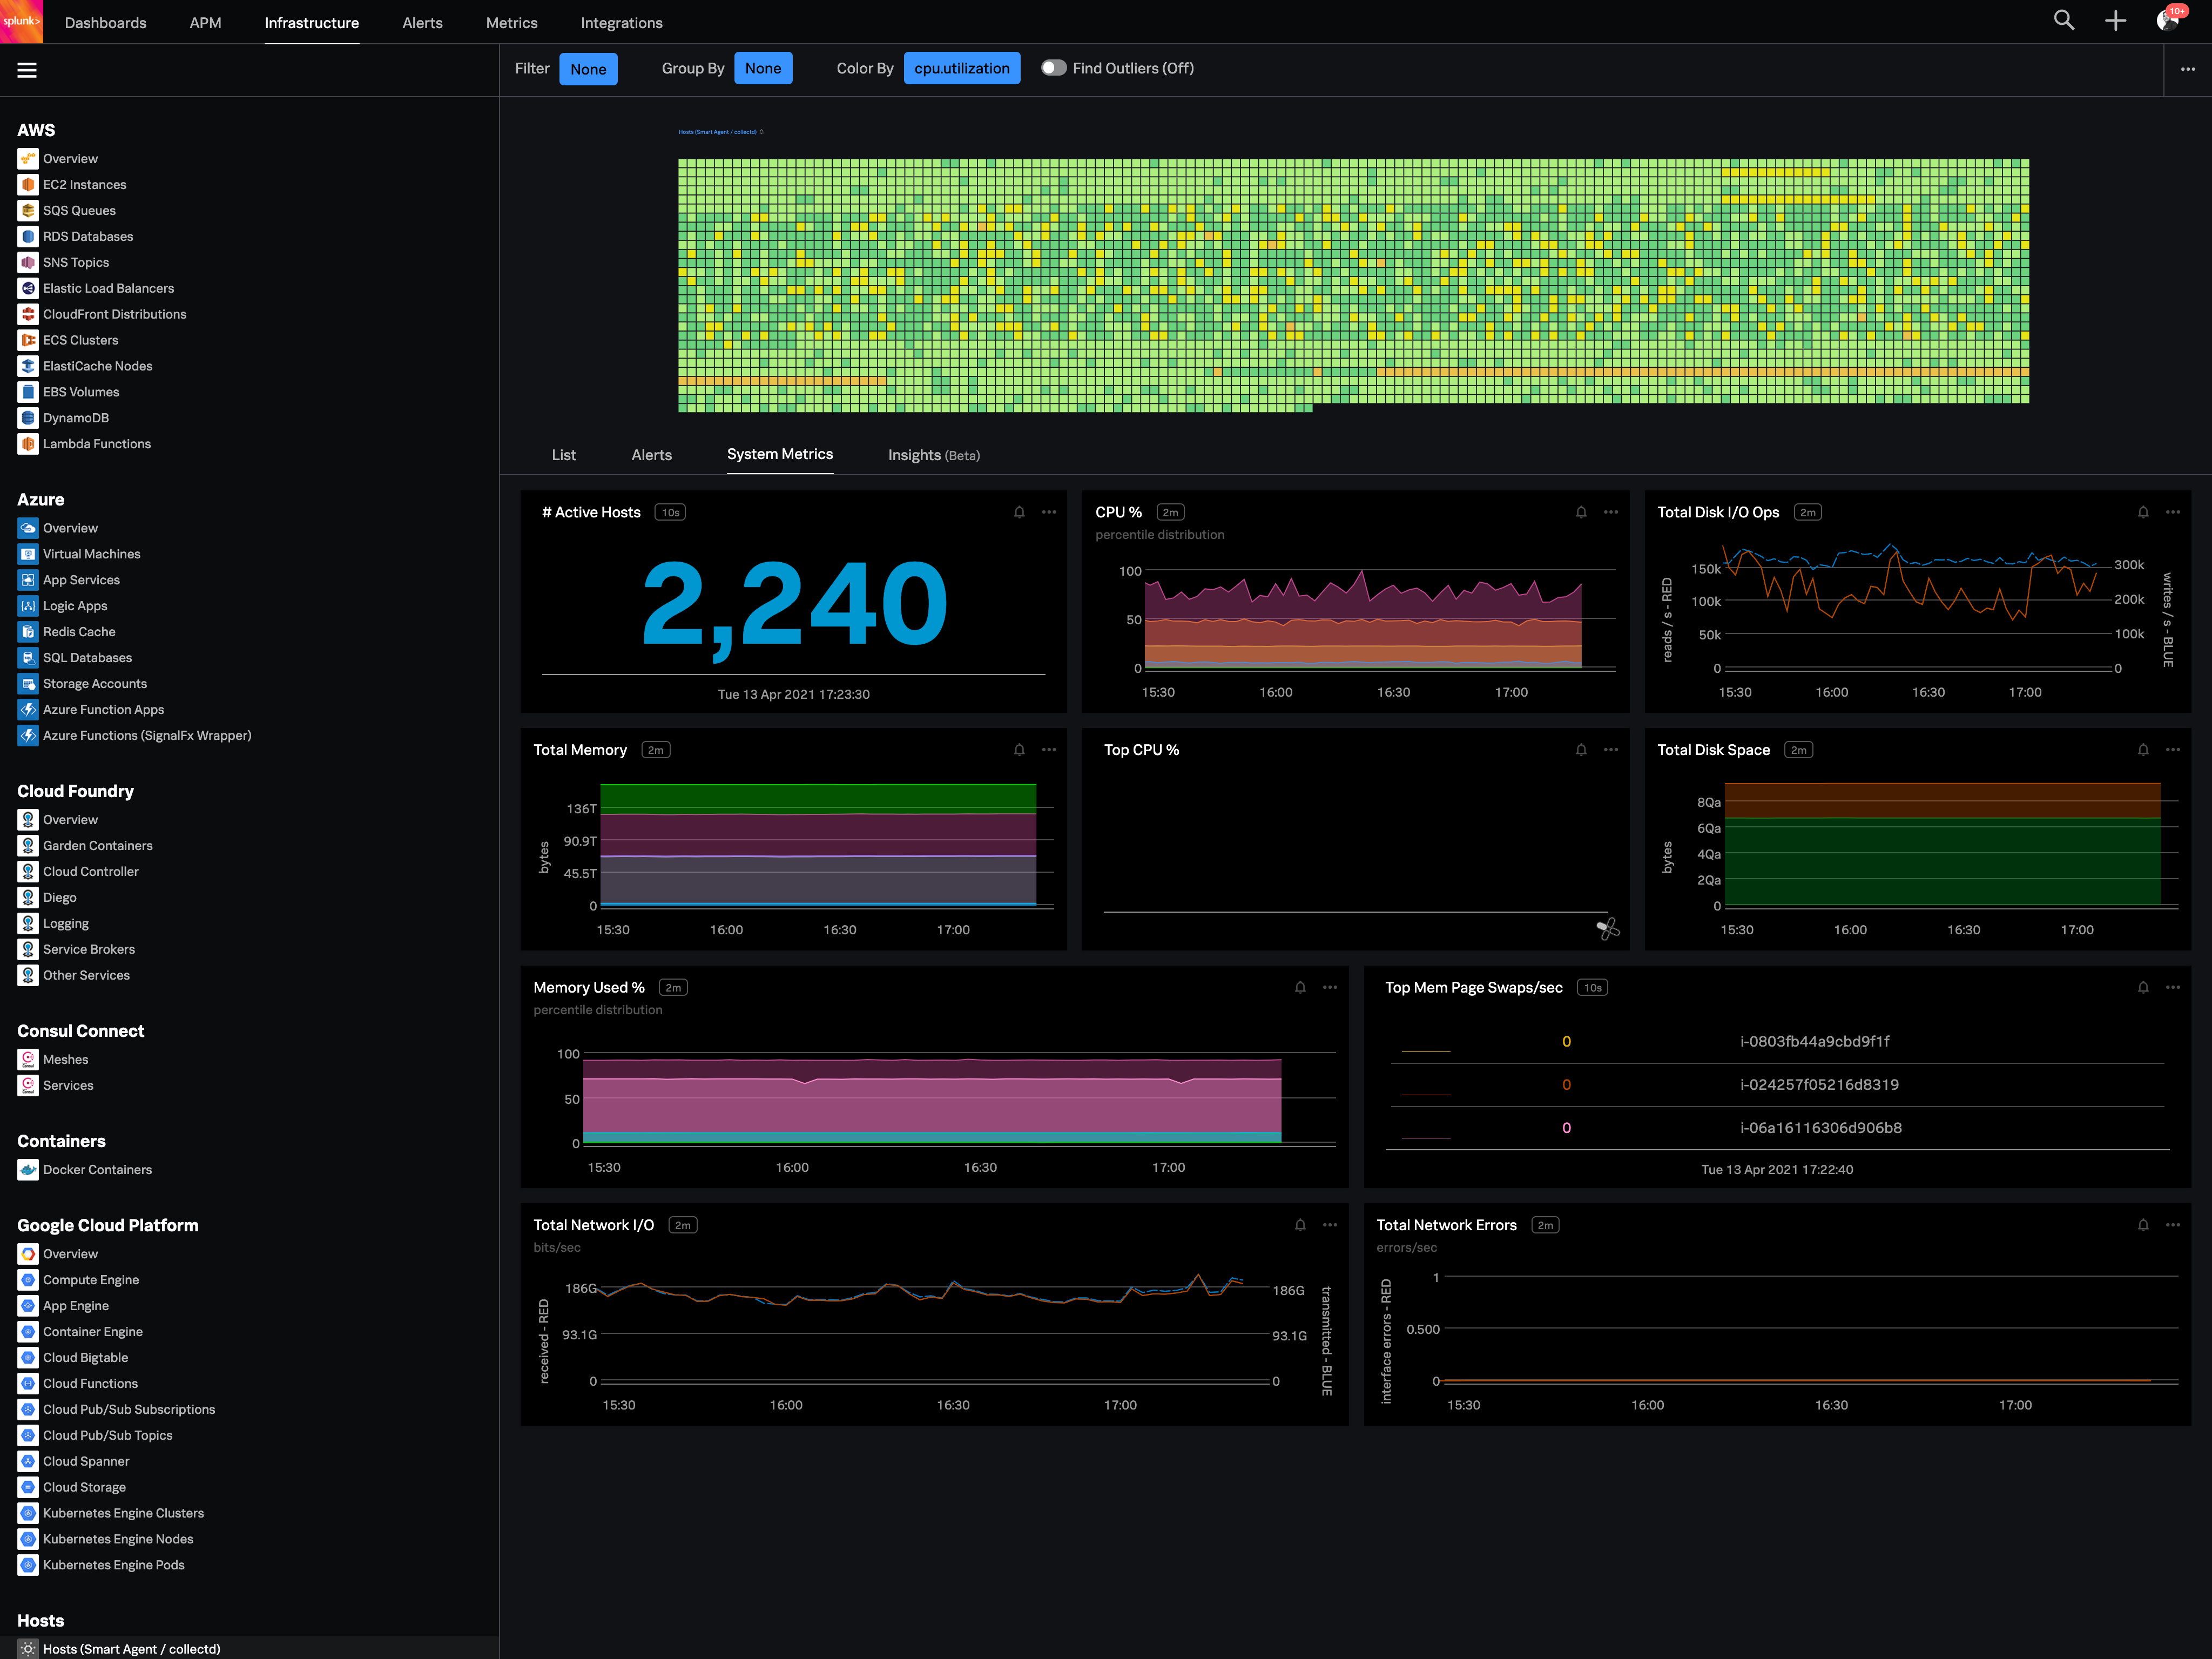
I really like this features because as we know how much K8s is vast and to manually monitor each part of the Kubernetes it takes so much time but Splunk Observability Cloud makes it easier. And even once we integrate K8s with Splunk Observability Cloud it gives us some prebuilt dashboards which gives holistic view of our Cluster and its nodes, pods, etc.
The dashbaord feature of Splunk Observability Cloud, it gives us full flexibility to customize our dashboard with a wide range of predefined chart types.
Now it also supports OTEL, which is a plus point for observability. As now everyone is moving towards Otel and in current market there are only few tools who supports OTEL based integrations, Splunk Observability Cloud is one out of them.
The initial setup process of AppDynamics could be more user-friendly. Some users find the configuration and onboarding to be a bit complex. Improving the onboarding experience could make it more accessible, especially for smaller teams or those with limited resources.
It can be difficult for some users to get AppDynamics up and running for the first time. For new users, the platform's usability might be improved by streamlining the onboarding process or providing more user-friendly setup wizards.
An indicator for errors on the navigations pane so that we don't have to go through each tab.
As we go more and more cloud maybe you guys can implement a pay-as-you-use strategy so that small companies using it not frequently can also afford it.
That's it can't think of any and it wont let me skip to next question. Thanks
Good: Stable system with low error rate Easy to use for simple use cases Bad: UI is not very clear for complex usage Mobile view (when logged in from phone) is bad No library for .net
Actually, I would like to give it a score of 10 out of 10, but taking into account certain factors such as: the cost of the annual licence, the complexity of installation and configuration, the blurring of setting Splunk AppDynamics over the cloud and especially OpenShift since we use it as a container platform. So, 8 out of 10 looks perfect for it
When there is an issue, it’s a win if one can easily identify the root cause. To do the same, it should allow the user to dig deep with multiple data points and compare the data and identify the anomaly. In this use case, it’s good to drive from Splunk 011y.
AppDynamics has its own community site that includes forums and a knowledge base. On the forums, you can converse with other members of the community and ask technical questions as you have them. Though this forum isn’t filled with people there are active members for you to gain some valuable insights.
It is distinguished from these programs because the platform provides visualizations of application processes, showing the interplay between various parts and services. Understanding the architecture of complicated apps and finding their weak spots is greatly aided by this.
We initially chose Splunk Observability Cloud because it promised full-stack visibility and tighter integration. The other tools didn't offer this as part of the core package. Their analytics and real-time dashboards looked strong during the demo but it turned out to a lot heavier and more complex than expected. If I had to decide again, I’d probably go with something more streamlined and easier to manage.
We can optimize infrastructure utilization and lower cloud or server costs by locating and removing resource-intensive bottlenecks with the aid of AppDynamics.
Building trust with external stakeholders and encouraging accountability within our organization, AppDynamics' comprehensive reporting and monitoring capabilities offer transparency into the health of applications.
We can find bugs earlier and improve development workflows with the help of AppDynamics' real-time insights and code-level profiling.