Sigma Computing headquartered in San Francisco provides a suite of data services such as code free data modeling, data search and explorating, and related BI and data visualization services.
N/A
Yurbi
Score 8.0 out of 10
N/A
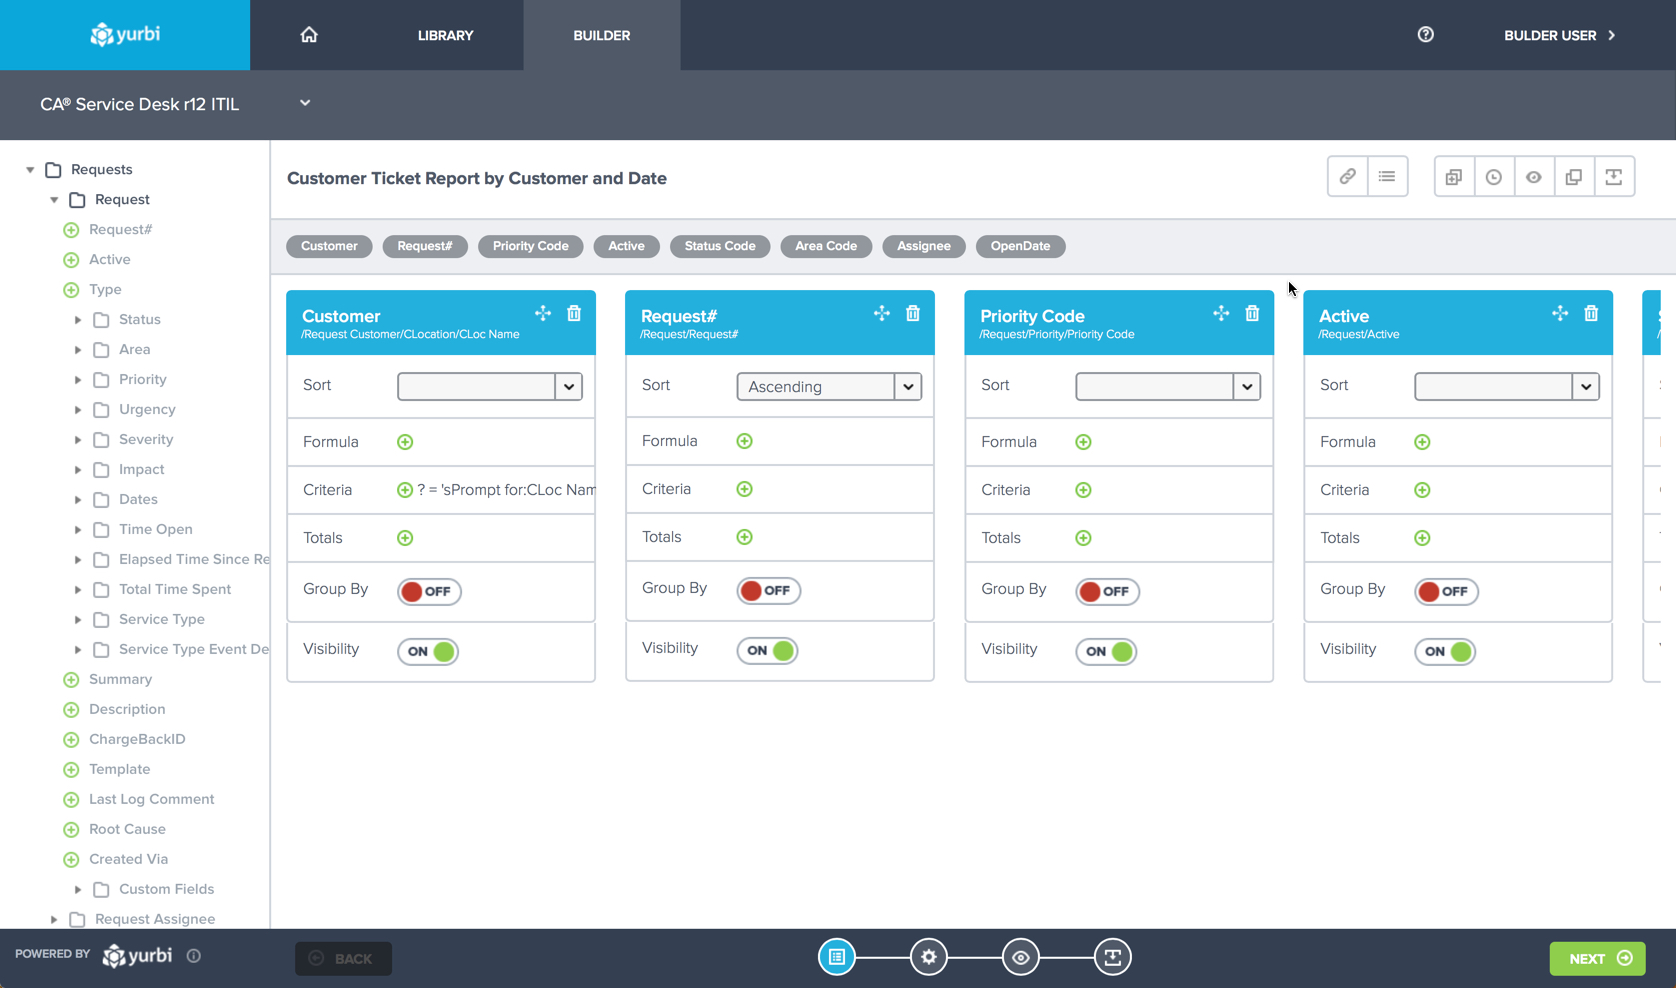
Yurbi is a business intelligence solution that is designed to bridge the gap between business users and intelligent data. It provides the business user with the ability to connect, secure, and collaborate with data to make better business decisions. According to the vendor, Yurbi brings the powerful reporting and analytical capabilities of traditional BI, but takes out the coding jargon – so that people can actually use it themselves.
As a 100% HTML5 application, Yurbi gives users and…
$24,000
per year
Pricing
Sigma Computing
Yurbi
Editions & Modules
No answers on this topic
Yurbi
24,000
per year
Offerings
Pricing Offerings
Sigma
Yurbi
Free Trial
Yes
Yes
Free/Freemium Version
No
No
Premium Consulting/Integration Services
No
Yes
Entry-level Setup Fee
Optional
No setup fee
Additional Details
Contact us for pricing.
Yurbi's pricing model is simple and predictable. User licenses start at just $495 per year and that includes all the powerful features of our platform. We offer named users, concurrent users, and public view or anonymous report licensing options. We also offer custom/hybrid pricing for vendors looking to OEM Yurbi.
More Pricing Information
Community Pulse
Sigma Computing
Yurbi
Features
Sigma Computing
Yurbi
BI Standard Reporting
Comparison of BI Standard Reporting features of Product A and Product B
Sigma Computing
8.9
160 Ratings
9% above category average
Yurbi
-
Ratings
Pixel Perfect reports
8.8103 Ratings
00 Ratings
Customizable dashboards
9.2158 Ratings
00 Ratings
Report Formatting Templates
8.6130 Ratings
00 Ratings
Ad-hoc Reporting
Comparison of Ad-hoc Reporting features of Product A and Product B
Sigma Computing
8.6
163 Ratings
7% above category average
Yurbi
-
Ratings
Drill-down analysis
9.4153 Ratings
00 Ratings
Formatting capabilities
8.2160 Ratings
00 Ratings
Integration with R or other statistical packages
7.35 Ratings
00 Ratings
Report sharing and collaboration
9.3159 Ratings
00 Ratings
Report Output and Scheduling
Comparison of Report Output and Scheduling features of Product A and Product B
Sigma Computing
9.1
153 Ratings
9% above category average
Yurbi
-
Ratings
Publish to Web
9.9102 Ratings
00 Ratings
Publish to PDF
8.9127 Ratings
00 Ratings
Report Versioning
9.9117 Ratings
00 Ratings
Report Delivery Scheduling
9.7130 Ratings
00 Ratings
Delivery to Remote Servers
7.067 Ratings
00 Ratings
Data Discovery and Visualization
Comparison of Data Discovery and Visualization features of Product A and Product B
We were able to set up client-facing embedded reports with ease and security. The interface is not difficult to learn, although we may not be aware of or lack the necessary expertise to utilize more advanced features that would likely benefit us.
The Yurbi Poduct is extremely well suited for organizations looking for a mature Business Intelligence and ad-hoc reporting tool. The strength of Yurbi is that it is highly customizable and can work in various environments.
Yurbi allows us to build customized Dashboards for specific users. Once the initial Dashboard is created, the user themselves have permissions to customize the Dashboard to suit their needs. The flexibility is there for a wide set of users.
Yurbi product is highly customizable. We looked for a Business Intelligence product for quite some time that could be customized to work with different types of data sets. When we started considering Yurbi, it was evident from the beginning that the product could be customized very quickly to work within our environment and our specific data types.
The Yurbi product stays a step ahead with the changing market being focused more for the tablet and smart phone user population. As our customers first started to use iPADs and iPhones, it was great to see that an upgraded Yurbi product was readily available for use for the iPAD/iPhone set of users.
Sigma Computing does not allow custom ordering of pivot fields in pivot tables easily
Sigma Computing lacks functionality for creating tables or sections that dynamically adjust to the browser window's height while maintaining a fixed height textbox at the bottom
Sigma Computing does not provide straightforward options for formatting totals in tables, such as renaming 'Total' to 'Average', 'Team Total', etc
Sigma Computing does not support searching by individual tab names within a workbook
While the Yurbi Developer tool is highly mature, there have been cases where building specific complex reports within Yurbi required extensive support directly from the vendor (and even some Yurbi product customizations). It would be great if the Yurbi Developer tool could be slightly refreshed to make it easier for more non-technical users to build more complex reports within Yurbi.
Over years of usage of the Yurbi product with growing set of available reports to run for users, it's easy to get unorganized in terms of being able to find the correct report to run. It's highly adviseable if future releases of Yurbi began offering features to organize all reports a little better within the product (including an audit trail of reports that users typically run to make it easier for them to go back to the right reports).
We heavily use the SMTP configuration within Yurbi to set up auto-email notifications to specific set of users with requested reports. At times, the SMTP service becomes unavailable and Yurbi product is unable to send these emails to the users. Besides not receiving the email, it's easily evident that the SMTP service connection failed. It would be great if future versions of the Yurbi product would alert the user of the failed SMTP connection on initial Yurbi login so the administrator becomes aware of the issue and can take action to resolve the problem.
Sigma has helped us a lot and has become an integral part of our daily workflow. It would be difficult to switch to another platform and have to rebuild the numerous metrics and performance reports that we have already established
The Yurbi product has been perceived very well by our customers. They have continued to use it for years and the user population has only expanded. Customers love the flexibility and large set of Dashboards and reports that can be made available within the product quickly and efficiently.
It has a clean and modern interface. However, it is not completely intuitive. I think it would be better and easier to navigate with more Windows style drop down menus and/or tabls. There is a significant learning curve, but that may be due in part to the technical nature of this type of software tool.
The Yurbi product is incredibly easy to use and very intuitive for the user. The environment is highly customizable to the user's own preferences which is the best part.
They are very friendly and informative. They are quick in resolving our queries and help us understand very minute things as well. They are quick in creating feature tickets based on our custom requirements, and they would also create a bug ticket if there is any discrepancy and get that checked on time.
With Looker, to be effective, a substantial amount of coding & modeling needs to happen in LookML. Being another language to learn, users have to context switch again from at a minimum either SQL or Python into LookML. The concept of being able to source control, code review, and deploy your models is a plus though.
Tableau is the gold standard for data visualization, no question. Power users will be able to create dazzling content that Sigma won't necessarily be able to easily match. However, since development usually happens via an extract, helping other users troubleshoot is an arduous process. Trying to re-do or un-do all the transformations and calculations that cause a certain number is very difficult.
With Sigma, all the queries happen directly against Snowflake and you can see the query logs. The data modeling happens right in a tabular, spreadsheet-like manner, so within only a few minutes, substantial transformations can happen, with visualizations just a few more clicks away.
Monitoring health of cloud platform has allowed the company to anticipate issues before they affect customers – Sigma prompted us building a canary monitoring process that provides customer container health.
Customer success has used an activity report to discover customers running runaway processes that they were unaware of, creating an alert to contact the customer and prevent an embarrassing situation.
Customer success uses the activity report to prompt conversations regarding increases or declines in behavior that led to increasing contract limits or addressing churn concerns.