Microsoft Power BI vs. Scuba Analytics
Microsoft Power BI vs. Scuba Analytics
| Product | Rating | Most Used By | Product Summary | Starting Price |
|---|---|---|---|---|
 Microsoft Power BI | N/A | Microsoft Power BI is a visualization and data discovery tool from Microsoft. It allows users to convert data into visuals and graphics, visually explore and analyze data, collaborate on interactive dashboards and reports, and scale across their organization with built-in governance and security. | N/A | |
 Scuba Analytics | Enterprise companies (1,001+ employees) | Scuba Analytics is a continuous intelligence platform that breaks down data silos, and allows teams to run no-code queries to get real-time insights about customer journey analytics. Scuba Analytics takes a behavioral process mining approach to discovering, monitoring and improving processes to help organizations reduce churn, streamline customer onboarding, improve A/B testing, increase supply chain and delivery efficiency, and make model drifts more accurate. All accounts include setup and… | N/A |
| Microsoft Power BI | Scuba Analytics | |||||||||||||||
|---|---|---|---|---|---|---|---|---|---|---|---|---|---|---|---|---|
| Editions & Modules | No answers on this topic | No answers on this topic | ||||||||||||||
| Offerings |
| |||||||||||||||
| Entry-level Setup Fee | No setup fee | No setup fee | ||||||||||||||
| Additional Details | — | Annual pricing model, usage based. | ||||||||||||||
| More Pricing Information | ||||||||||||||||
| Microsoft Power BI | Scuba Analytics |
|---|
| Microsoft Power BI | Scuba Analytics | |||||||||||||||||||||
|---|---|---|---|---|---|---|---|---|---|---|---|---|---|---|---|---|---|---|---|---|---|---|
| BI Standard Reporting |
| |||||||||||||||||||||
| Ad-hoc Reporting |
| |||||||||||||||||||||
| Report Output and Scheduling |
| |||||||||||||||||||||
| Data Discovery and Visualization |
| |||||||||||||||||||||
| Access Control and Security |
| |||||||||||||||||||||
| Mobile Capabilities |
| |||||||||||||||||||||
| Application Program Interfaces (APIs) / Embedding |
|
| Microsoft Power BI | Scuba Analytics | |
|---|---|---|
| Likelihood to Recommend | 8.5 (0 ratings) | - (0 ratings) |
| Likelihood to Renew | 9.0 (0 ratings) | - (0 ratings) |
| Usability | 8.0 (0 ratings) | - (0 ratings) |
| Support Rating | 10.0 (0 ratings) | - (0 ratings) |
| Implementation Rating | 9.0 (0 ratings) | - (0 ratings) |
| Microsoft Power BI | Scuba Analytics | |
|---|---|---|
| Likelihood to Recommend | 
|  No answers on this topic |
| Pros |
| No answers on this topic |
| Cons |
| No answers on this topic |
| Likelihood to Renew |
 David Jensen Operations Manager, Customer Success | No answers on this topic |
| Usability |
| No answers on this topic |
| Support Rating |
| No answers on this topic |
| Implementation Rating |
 Anuj Sant Technical Supply chain professional Senior buyer | No answers on this topic |
| Alternatives Considered |
| No answers on this topic |
| Return on Investment |
| No answers on this topic |
| ScreenShots | Microsoft Power BI Screenshots      | Scuba Analytics Screenshots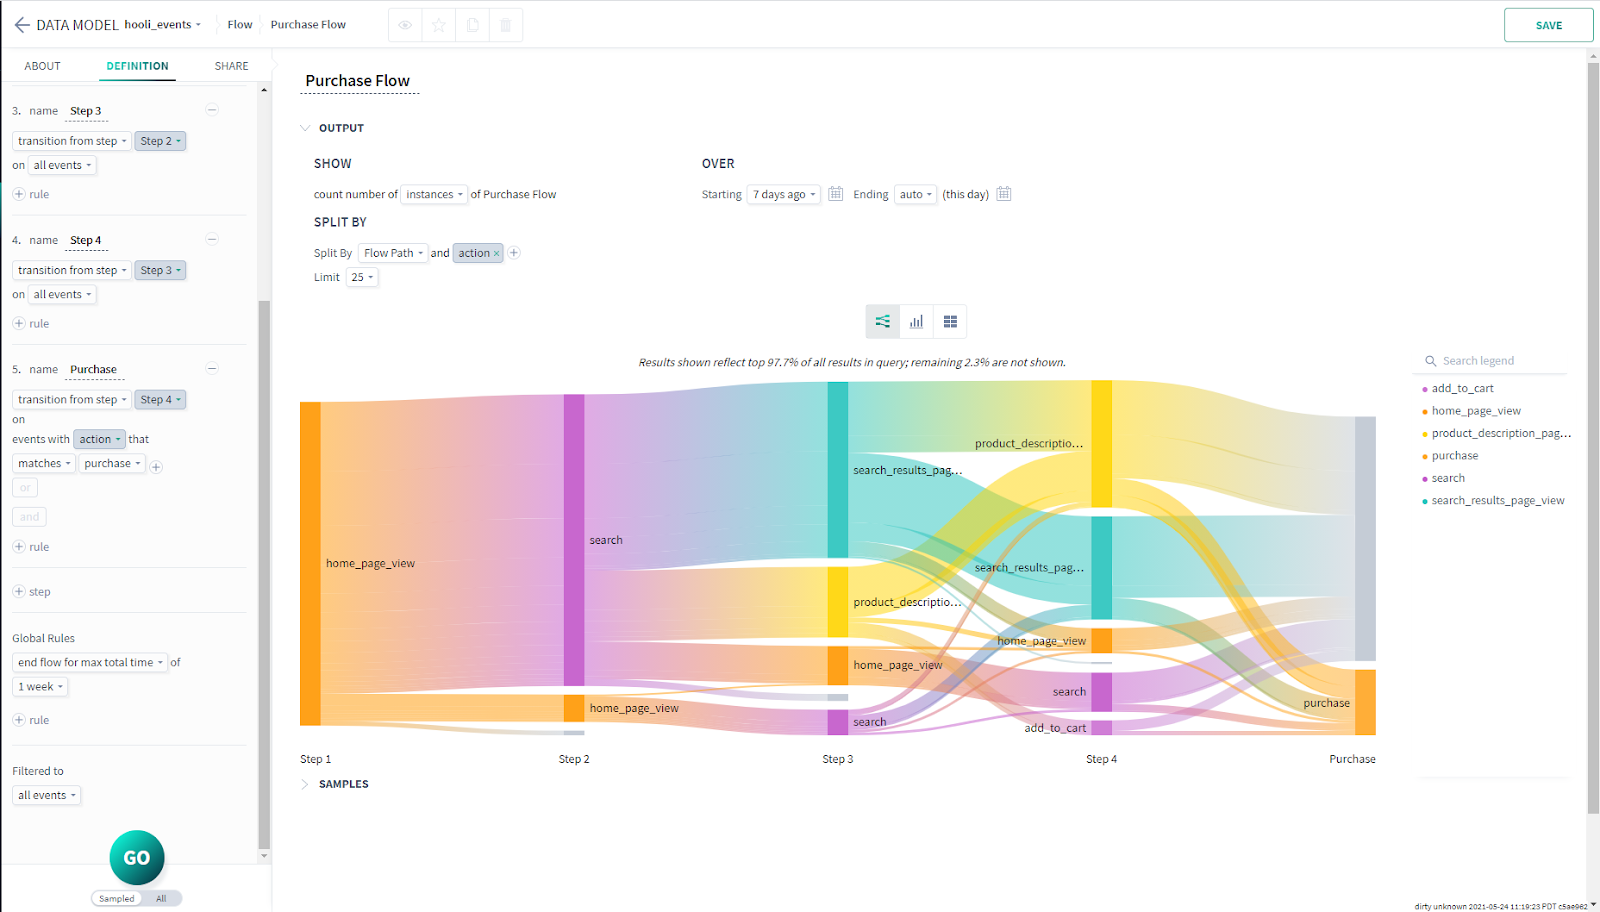 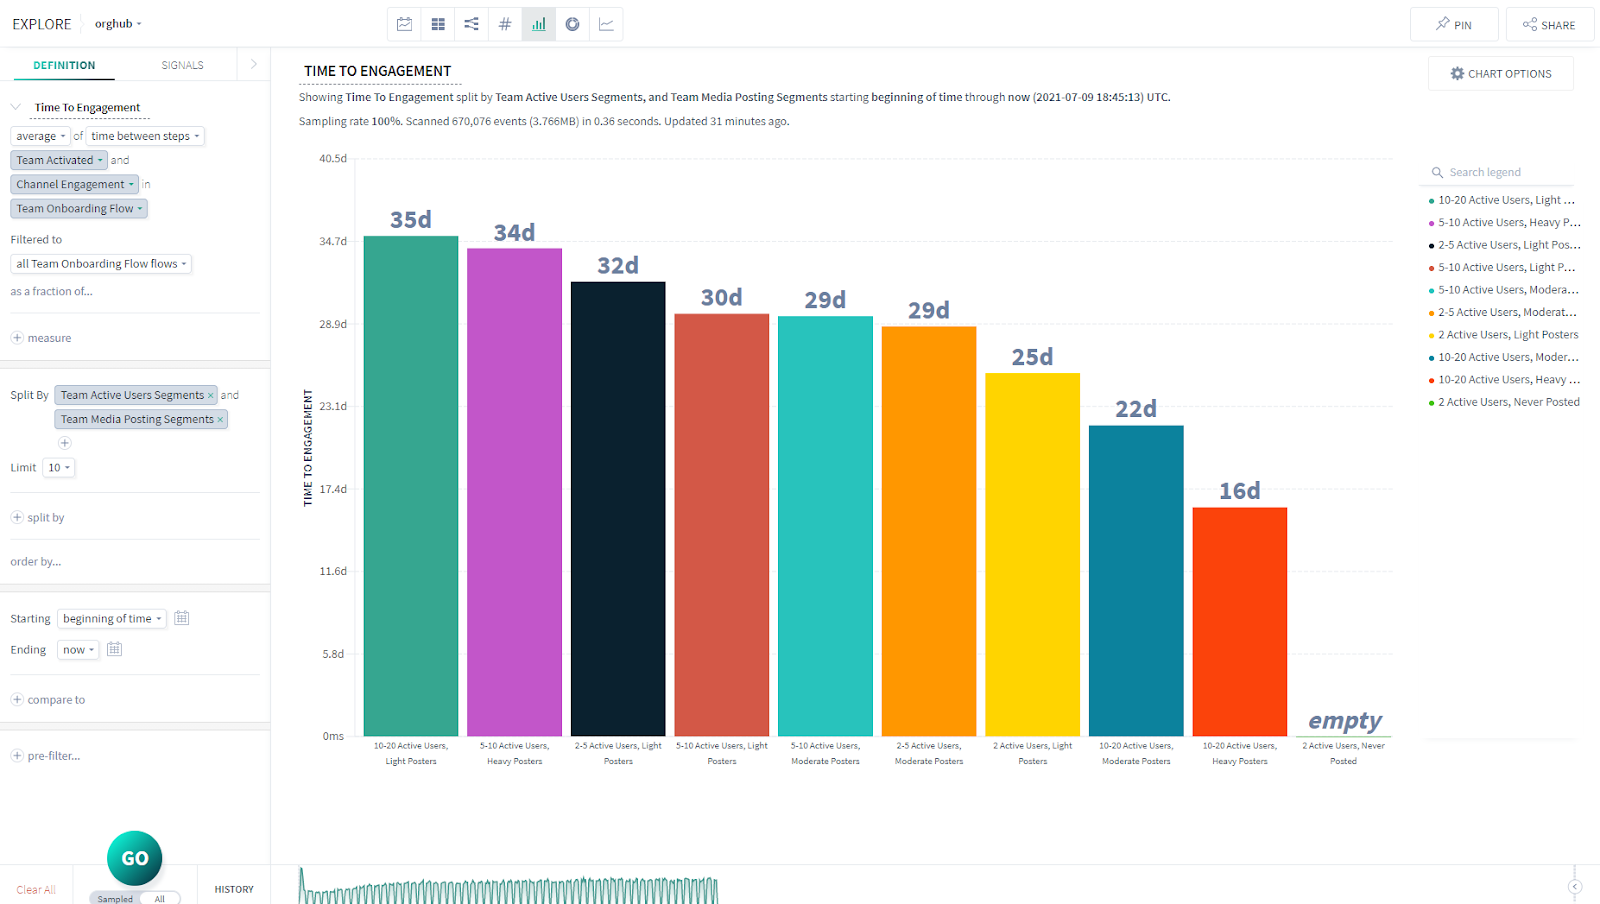 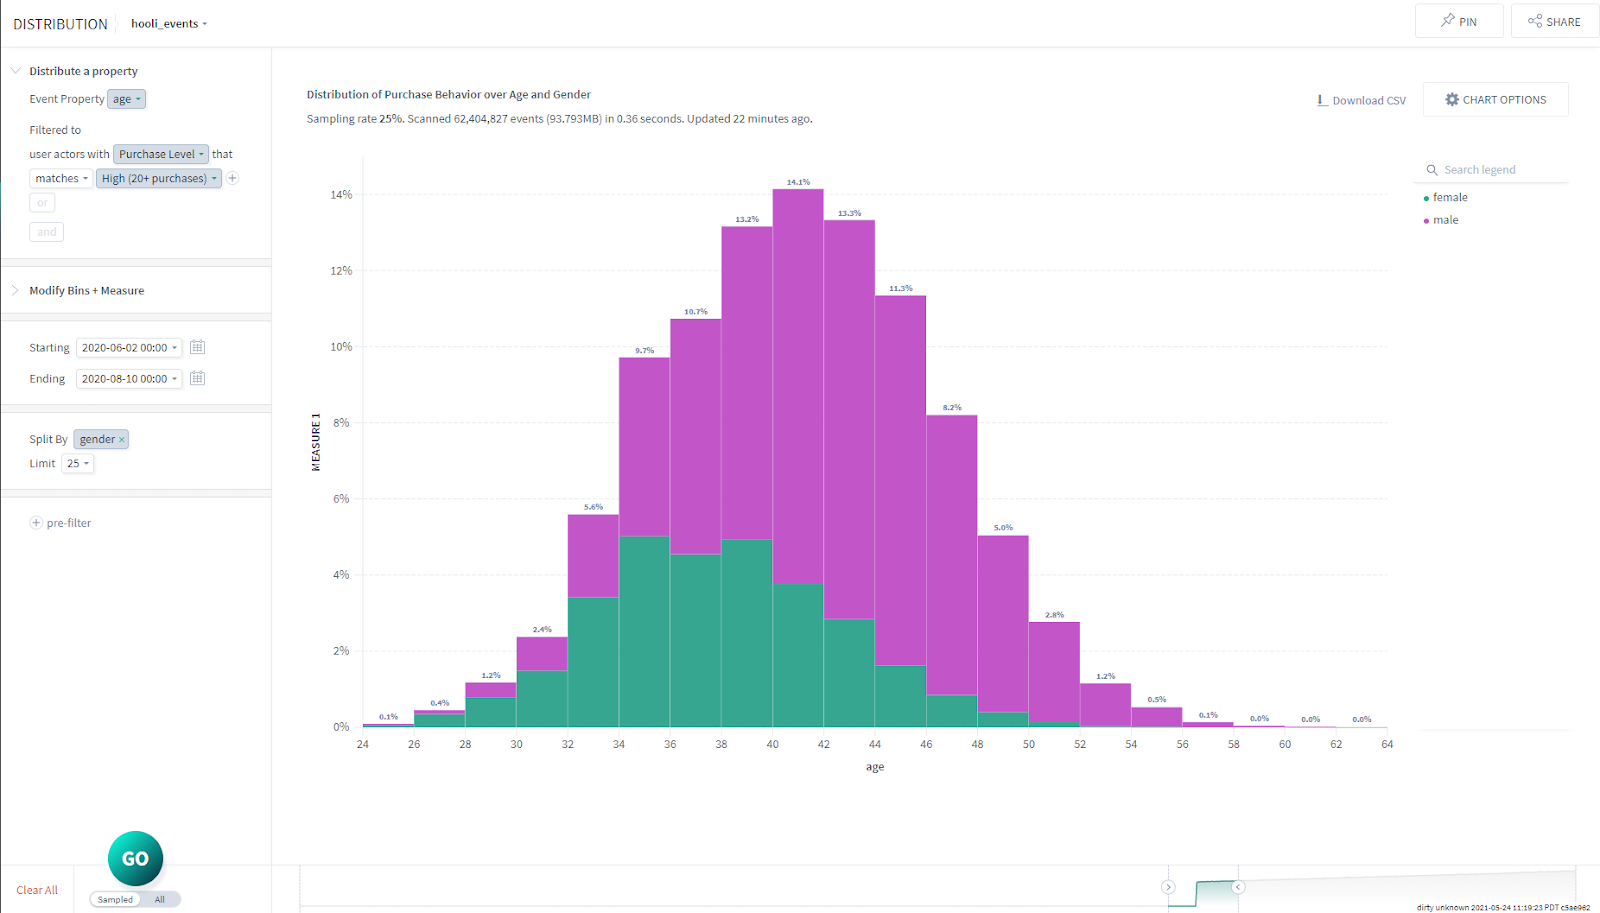 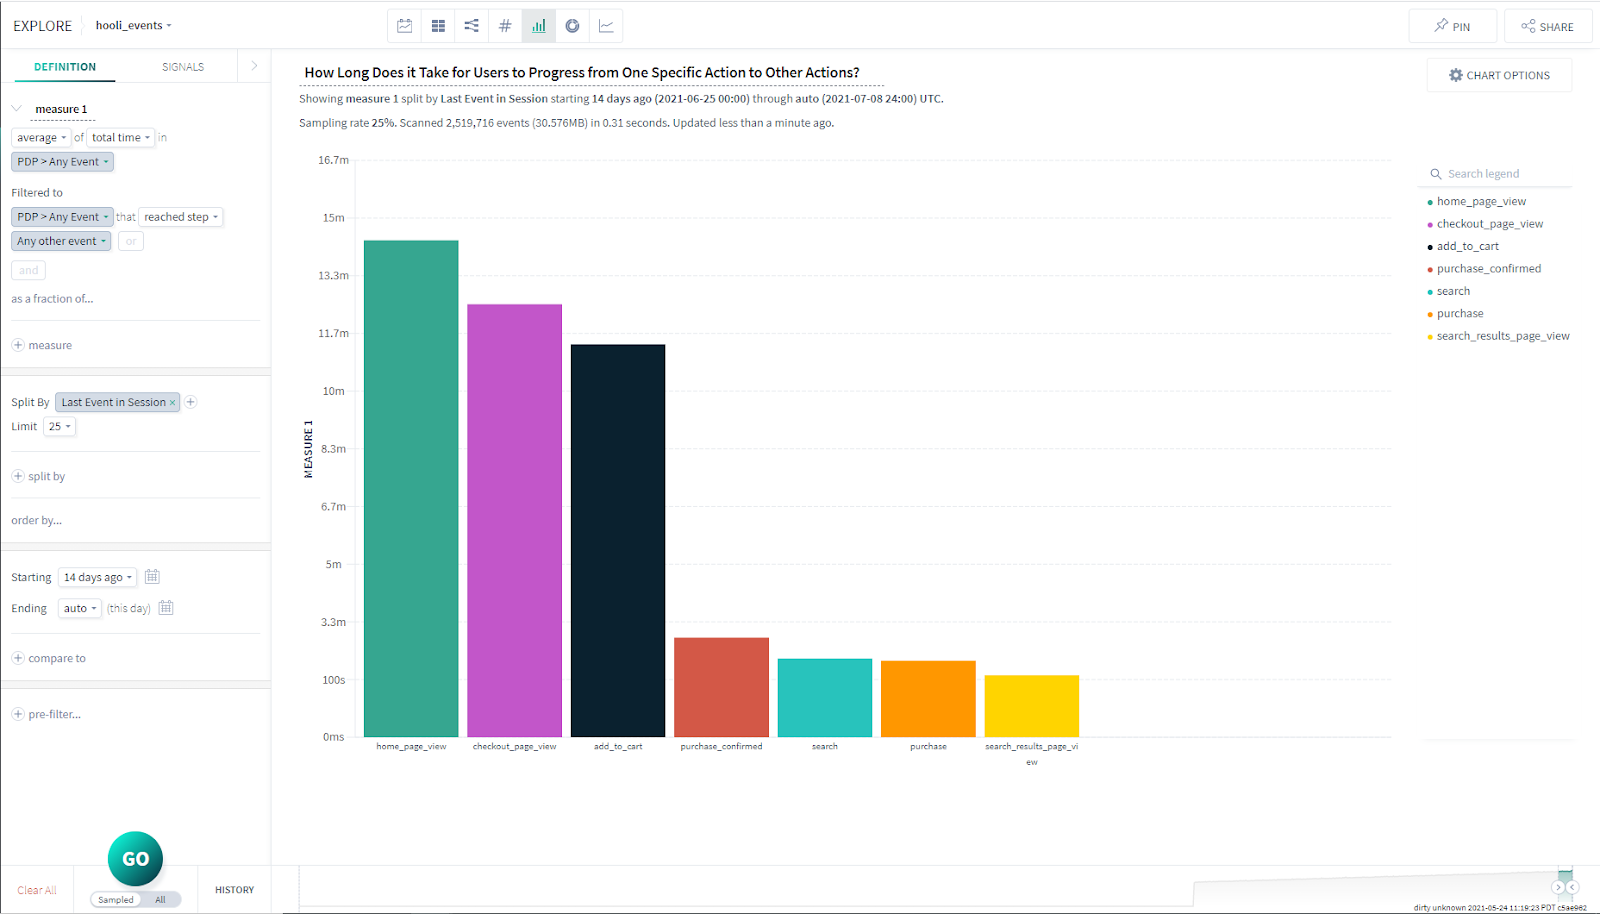 |