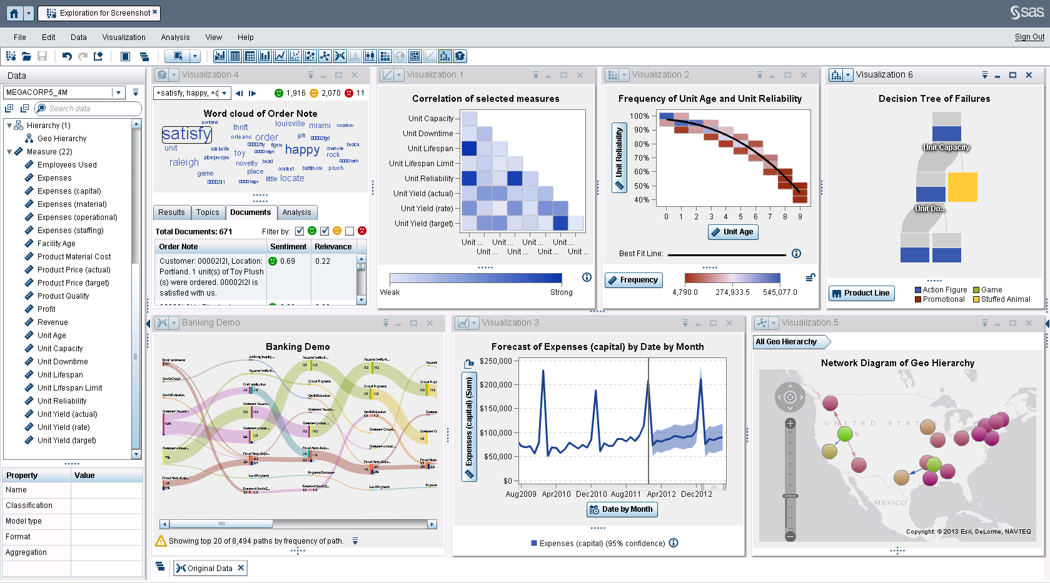
SAS Visual Analytics provides a complete platform for analytics visualization, enabling users to identify patterns and relationships in data that weren't initially evident. Interactive, self-service BI and reporting capabilities are combined with out-of-the-box advanced analytics so everyone can discover insights from any size and type of data, including text.
N/A
Zendesk Explore
Score 8.7 out of 10
N/A
Zendesk offers Explore, a business intelligence and customer analytics tool which integrates with the Zendesk suite featuring ticket analytics, custom fields, dashboards, and other features. Zendesk is migrating customers of the BIME analytics product, which is approaching end of support, to Zendesk Explore in 2019.
N/A
Pricing
SAS Visual Analytics
Zendesk Explore
Editions & Modules
SAS Visual Analytics for SAS Cloud
$0
Annual By Users: 5, 10, 20
No answers on this topic
Offerings
Pricing Offerings
SAS Visual Analytics
Zendesk Explore
Free Trial
Yes
No
Free/Freemium Version
No
No
Premium Consulting/Integration Services
No
No
Entry-level Setup Fee
No setup fee
No setup fee
Additional Details
SAS Visual Statistics and SAS Office Analytics are also available as add-ons.
—
More Pricing Information
Community Pulse
SAS Visual Analytics
Zendesk Explore
Features
SAS Visual Analytics
Zendesk Explore
BI Standard Reporting
Comparison of BI Standard Reporting features of Product A and Product B
SAS Visual Analytics
8.3
Ratings
2% above category average
Zendesk Explore
9.0
Ratings
10% above category average
Pixel Perfect reports
8.00 Ratings
7.10 Ratings
Customizable dashboards
8.00 Ratings
10.00 Ratings
Report Formatting Templates
9.00 Ratings
9.90 Ratings
Ad-hoc Reporting
Comparison of Ad-hoc Reporting features of Product A and Product B
SAS Visual Analytics
8.8
Ratings
9% above category average
Zendesk Explore
8.3
Ratings
3% above category average
Drill-down analysis
9.00 Ratings
9.50 Ratings
Formatting capabilities
8.00 Ratings
9.00 Ratings
Integration with R or other statistical packages
8.00 Ratings
4.80 Ratings
Report sharing and collaboration
10.00 Ratings
10.00 Ratings
Report Output and Scheduling
Comparison of Report Output and Scheduling features of Product A and Product B
SAS Visual Analytics
9.2
Ratings
10% above category average
Zendesk Explore
8.4
Ratings
1% above category average
Publish to Web
9.00 Ratings
6.90 Ratings
Publish to PDF
9.00 Ratings
9.00 Ratings
Report Versioning
9.00 Ratings
9.00 Ratings
Report Delivery Scheduling
10.00 Ratings
8.90 Ratings
Delivery to Remote Servers
9.00 Ratings
8.00 Ratings
Data Discovery and Visualization
Comparison of Data Discovery and Visualization features of Product A and Product B
SAS Business Intelligence is more suited to organizations which are already using SAS as the primary software for their analytics needs. Learning curve is relatively shorter for teams already skilled in BASE SAS. For organizations already working with open source software like Julia and Python, it doesn't make much sense to use SAS BI.
Compared to other analytics functions of other Ticket Management System, Zendesk Explore is the easiest to learn. Moreover, the learning curve is high. Once you pick up the fundamentals, you will be able to create all types of analytic reports. In addition, if you know basic coding or SQL, you can create your own metrics and attributes to capture extremely specific elements such as the tickets that contain a certain word or etc.
SAS BI makes it very easy to create interactive dashboards even for someone who is not from an IT background. For some specific requirements, basic knowledge of SQL is good enough.
A lot of functions have been predefined which makes it very convenient to create dashboards and reports. One doesn't need to be from an IT or a programming background to understand and create dashboards.
It supports other programming languages like R and also has a seamless API integration with various data management platforms.
As with most "suite" products, if you already use other Zendesk features (Chat, Talk, etc), then Zendesk Explore adds an extra facet to the customer experience. The more we know about our clientele, the better we can understand/anticipate their needs.
I like that we can get as in-depth as we feel is necessary. For example, is just one customer having an issue? Or are many experiencing a similar problem? We can better rack this type of trend using Explore.
Our team can dive deep into the data based on exactly what we're looking for. If the marketing team wants a certain kind of segment, we can give them that info. If we want to sort by date or another set of parameters, we can do that as well.
There is no other product that can match SAS. There are some products that can compare to ETL but lack the analytics that SAS has. Others can perform a limited set of analytical procedures but lack the data processing that comes with SAS. Using thin client allows users to access data whenever they have an internet connection.
SAS BI is good for creating reports and dashboards and then sharing it with the users. It also has ability to manage access to the reports and dashboards but somehow with most of the world moving to open source languages R, Python and Julia, SAS BI feels to be archaic in terms of feature set and integrations it allow[s]. Also, comparing it with other Business Intelligence tools like Tableau and Microsoft BI, the functionality of SAS BI is very limited and doesn't justify the pricing.
I rate Zendesk Explore 8 out of 10 for it's overall usability because it offers powerful reporting and analytics with an easy to navigate interface and intuitive dashboards. It helps improve customer satisfaction by providing valuable insights into ticket handling, agent performance and customer satisfaction. Though the complex query builder can be challenging for non technical users.
When you call tech support, you are immediately routed to a person who can answer your question. Often they can answer on the spot. However, if they cannot, you are given a track number and then followed up with. There have been times when I have had multiple track numbers open and they will actually TRACK YOU DOWN to ensure that your problem has been resolved. Issues do not fall into black holes with SAS. They are also willing to do a WebEx with you to diagnose the problem by seeing your environment, which is always helpful.
Zendesk Community is extremely useful for Zendesk Explore beginners. The live support provided by Zendesk will also help a lot. If you don't know anything you can ask live support right away. However, one drawback of Zendesk Community and Support is the creation of complex reports on Zendesk Explore. Zendesk Community and Support cannot really help you much if you are trying to build a complex report as they are not a complete expert on it as well.
I have chosen SAS Visual Analytics because one of my colleagues suggests using the software for the same for our work. As earlier, we use to take a lot of time in analyzing the data but after using the SAS Visual Analytics software our work has improved and time has decreased. It's very helpful for us.
Zendesk Explore stands out against Freshchat and Freshdesk for it's deeper analytics capabilities and seamless integration with Zendesk ecosystem. While Freshdesk offers reporting, it lacks on the same level of granular insights and customization that Zendesk Explore provides. Compared to Freshchat which focuses more on live chat and conversational analytics Zendesk Explore excels in historical trend analysis and comprehensive dashboarding. We choose Zendesk Explore for it's robust reporting and drill down capabilities.