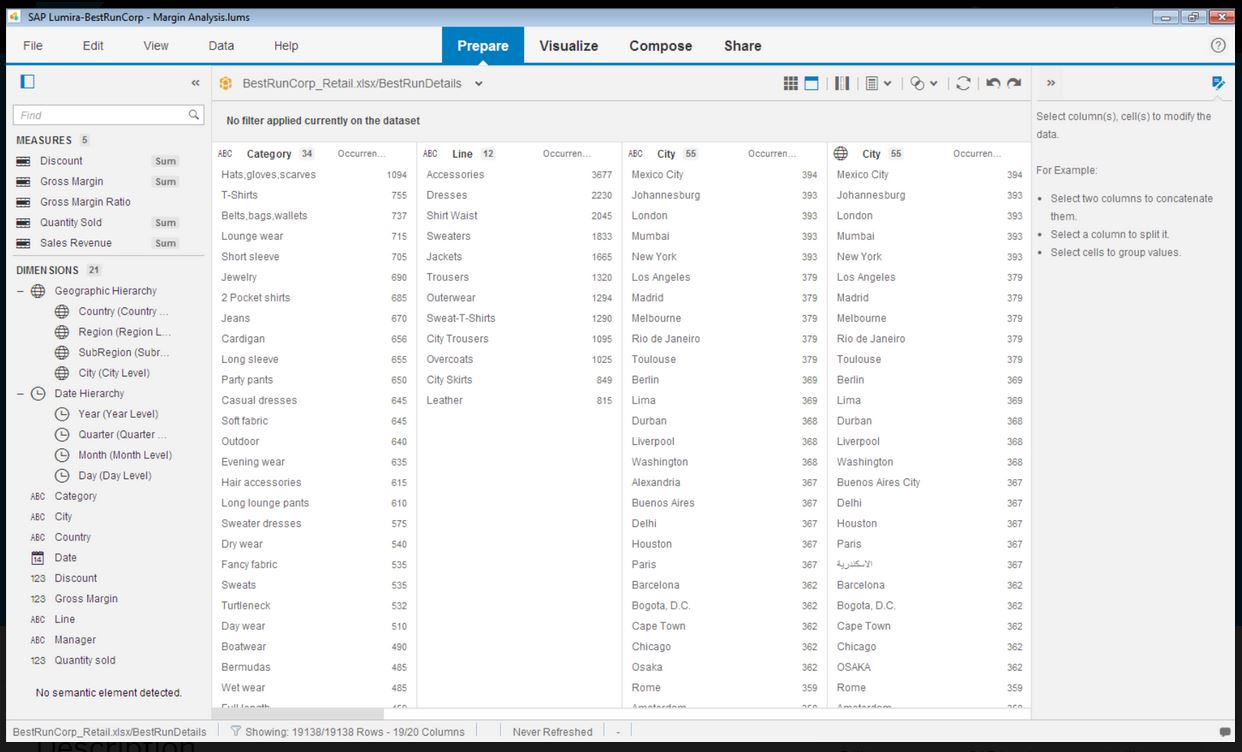
SAP Lumira Discovery is SAP’s data visualization and discovery application. It facilitates data discovery, visualization, and analysis by assisting users with creation of dashboards, infographics, presentations, data facets, tag clouds, and more.
$185
per user
Spotfire
Score 8.2 out of 10
N/A
Spotfire, formerly known as TIBCO Spotfire, is a visual data science platform that combines visual analytics, data science, and data wrangling, so users can analyze data at-rest and at-scale to solve complex industry-specific problems.
N/A
Pricing
SAP Lumira Discovery
Spotfire
Editions & Modules
SAP Lumira, standard edition
$185
per user
No answers on this topic
Offerings
Pricing Offerings
SAP Lumira Discovery
Spotfire
Free Trial
Yes
Yes
Free/Freemium Version
No
No
Premium Consulting/Integration Services
Yes
Yes
Entry-level Setup Fee
No setup fee
No setup fee
Additional Details
—
For Enterprise engagements, contact Spotfire directly for a custom price quote.
More Pricing Information
Community Pulse
SAP Lumira Discovery
Spotfire
Considered Both Products
SAP Lumira Discovery
Verified User
Professional
Chose SAP Lumira Discovery
Much better. Quicker and easier to update. Better connectivity and able to share and collaborate. The ability to connect data puts it a step above the others.
Lumira is better at visualization than Analysis Office but does not allow as much in depth analysis. Also it's much easier to consume quickly with Lumira as you don't have to build a query to pull the data.
Design studio is more flexible but dashboards and visualizations need to …
I have been using Spotfire; it is free and I was able to play around a lot more with the features. The best part of using Spotfire is the heat map signatures for my data. It provides a better visualization of your target demographic.
We evaluated on Mobility, Dashboarding, Web Based User Interface and Analytical capability. At the forefront was the user experience which accounted for just over half of our evaluation criteria. No platform was a 10/10 in all four categories - SAS Visual Analytics excelled in …
Infographics derived from specific data sources appears to be well suited for development using Lumira. The development of executive level dashboards was less appropriate from my perspective. The software does not provide sufficient demonstration or samples for the users to learn from in my opinion.
A high level of data integration is available here it supports various data sources and so on. Collaborating features allow users to give access to the dashboard and merge data analytics with other team members. It can meet the demands of both small and large size business enterprises. A customized dashboard and reports are provided to meet the specific needs and get support of extensibility through APIs and customized scripts.
Even though the process of creating visualizations of data is now greatly improved, it could still be a lot better as users become accustomed to this kind of tool and bring forward edge cases the developers did not anticipate.
It would be awesome to have a cross platform tool that works on more than just Windows.
The donut chart is I guess a powerful illustrations but I hope it should be done quite simple in Spotfire. But in Spotfire there are lots of steps involve just to build a simple donut chart.
Table calculation (like Row or Column Differences) should be made simple or there should be drag and drop function for Table Calculation. No need for scripting.
Information Link should be changed. If new columns are added to the table just refreshing the data should be able to capture the new column. No need extra step to add column
-Easy to distribute information throughout the enterprise using the webplayer. -Ad hoc analysis is possible throughout the enterprise using business author in the webplayer or the thick client. -Low level of support needed by IT team. Access interfaces with LDAP and numerous other authentication methods. -Possible to continually extend the platform with JavaScript, R scripts, HTML, and custom extensions. -Ability to standardize data logic through pre-built queries in the Information Designer. Everyone in the enterprise is using the same logic -Tagging and bookmarking data allows for quick sharing of insights. -Integration with numerous data sources... flat files, data bases, big data, images, etc. -Much improved mapping capability. Also includes the ability to apply data points over any image.
SAP Lumira is very good self service analytical tool with powerful capabilities. However need to look into other SAP products in BI space, like SAP SAC. SAP Lumira is more used for custom and complex analytical need in business intelligence area. Also SAP Lumira is going out of maintenance in coming future replaced by SAP SAC.
Basic tasks like generating meaningful information from large sets of raw data are very easy. The next step of linking to multiple live data sources and linking those tables and performing on the fly analysis of the imported data is understandably more difficult.
Lumira is a desktop application runs in its own JVM. It installs its own java runtime libraries to avoid any core java version conflicts. The availability of the application is completely relies on individual machine hardware configuration. On a decent desktop, it performs well and always launches in either 32 or 64 bit environment based on the hosts system's OS
Even though, it's a rather stable and predictable tool that's also fast, it does have some bugs and inconsistencies that shut down the system. Depending on the details, it could happen as often as 2-3 times a week, especially during the development period.
The performance is linear with amount of data that is being explored. We have done some benchmarks acquiring 10million data cells without having any performance problems. We need to make proper adjustments to jvm run time properties to start with higher heap size and other parameters that optimizes the run time performance
Generally, the Spotfire client runs with very good performance. There are factors that could affect performance, but normally has to do with loading large analysis files from the library if the database is located some distance away and your global network is not optimal. Once you have your data table(s) loaded in the client application, usually the application is quite good performance-wise.
It does not have many bugs or issues since not a lot of new features are being added. The customer support for SAP Lumira Discovery is good and anyone considering this as a self-service tool would be happy. It integrates well in the SAP BI suite of products and the overall experience is positive.
Support has been helpful with issues. Support seems to know their product and its capabilities. It would also seem that they have a good sense of the context of the problem; where we are going with this issue and what we want the end outcome to be.
The instructor was very in depth and provided relevant training to business users on how to create visualizations. They showed us how to alter settings and filter views, and provided resources for future questions. However, the instructor failed to cover data sources, connecting to data, etc. While it was helpful to see how users can use the data to create reports, they failed to properly instruct us on how to get the dataset in to begin with. We are still trying to figure out connections to certain databases (we have multiple different types).
Most of the user guides are pretty comprehensive and very easy to understand. The product itself is designed to be self-serve tool, did not need much of the end-user training. Most of the training we had is to how to read the data, how to explore the data, how to acquire the data etc.
The online training is good, provides a good base of knowledge. The video demonstrations were well-done and easy to follow along. Provided exercises are good as well, but I think there could be more challenging exercises. The training has also gone up in price significantly in the last 3 years (in USD, which hurts us even more in Canada), and I'm not sure it is worth the money it now costs (it is worth how much it cost 3 years ago, but not double that.)
Installing the desktop software on end-user machines is always challenging. The machine specifications are the biggest factor when running Lumira and be able to handle large datasets during data exploration. This often demands beefy machines at least for power-users. Although Lumira software licensing is not a big problem but managing partner's extensions and keeping track of their individual licenses may be an issue. If there is a way to bundle the more popular extensions such as vSQL or vOLAP should be bundled in core product and offer them as part of Lumira license instead of a separate license which causer operational burden.
The original architecture I created for our implementation had only a particular set of internal business units in mind. Over the years, Spotfire gained in popularity in our company and was being utilized across many more business units. Soon, its usage went beyond what the original architectural implementation could provide. We've since learned about how the product is used by the different teams and are currently in the middle of rolling out a new architecture. I suggest:
Have clearly defined service level agreements with all the teams that will use Spotfire. Your business intelligence group might only need availability during normal working hours, but your production support group might need 24/7 availability. If these groups share one Spotfire server, maintenance of that server might be a problem.
Know the different types of data you will be working with. One group might be working with "public" data while another group might work with sensitive data. Design your Library accordingly and with the proper permissions.
Know the roles of the users of Spotfire. Will there only be a small set of report writers or does everyone have write access to the Library?
ALWAYS add a timestamp prompt to your reports. You don't want multiple users opening a report that will try and pull down millions of rows of data to their local workstations. Another option, of course, is to just hard code a time range in the backing database view (i.e. where activity_date >= sysdate - 90, etc.), but I'd rather educate/train the user base if possible.
This probably goes without saying, but if possible, point to a separate reporting database or a logical standby database. You don't want the company pounding on your primaries and take down your order system.
Even though SAP Analytics Cloud is considered to be better in aspects such as data connectivity or analytics, we decided to choose Lumira as it was easier to understand, learn and use. As our business is not really that big and does not require the inclusion of large amounts of data, Lumira was overall the safest and most comfortable option. Also, some members in our team had previous knowledge so it was easier to adapt
Spotfire is significantly ahead of both products from an ETL and data ingestion capability. Spotfire also has substantially better visualizations than Power BI, and although the native visualizations aren't as flexible in Tableau, Spotfire enables users to create completely custom javascript visaualizations, which neither Tableau or Power BI has. Tableau and Power BI are likely only superior to Spotfire with respect to embedded analysis on a website.
Enterprise wide implementation is a challenge with data security and trustedness. No easy installation can be done across the enterprise. no upgrade paths also available from SAP. They have so much of experience with desktop implementation, there it could be a controlled environment with a capital budget. These may be resolved in the upcoming releases
In an enterprise architecture, if Spotfire Advanced Data services(Composite Studio),data marts can be managed optimally and scalability in a data perspective is great. As the web player/consumer is directly proportional to RAM, if the enterprise can handle RAM requirement accomodating fail over mechanisms appropraitely, it is definitely scalable,