SAP Crystal is an analytics and reporting software solution for SMBs. SAP Crystal comprises Crystal Reports for pixel-perfect reporting, and SAP Crystal Server for automated distribution and self-service access to reports, dashboards and data exploration.
$295
per single user license
Windward Core
Score 9.1 out of 10
Enterprise companies (1,001+ employees)
Windward’s low-code document generation solution embeds into any application, enabling users to populate data-smart documents within the familiar landscape of Microsoft Office. It's a solution from PDFTron since the April 2021 acquisition.
$19
Per User, Per Month (10 user minimum)*
Pricing
SAP Crystal
Windward Core
Editions & Modules
Upgrade Version to SAP Crystal Reports 2020
$295
per single user license
SAP Crystal Reports 2020 64-Bit
$495
per single user license
SAP Crystal Reports 2016 32-Bit
$495
per single user license
SAP Crystal Server 2020 1 NUL
$869
per user license + first year maintenance to be added
SAP Crystal Server 2020 5 CAL
$8,744
5 concurrent users + first year maintenance to be added
Windward Hub Standard
$19.00
Per User, Per Month (10 user minimum)*
Windward Hub Premium
$49.00
Per User, Per Month (10 user minimum)*
Windward Core Pro
$547.00
per month*
Windward Core Flex
$605.00
per month*
Windward Hub Enterprise
Custom Pricing
Offerings
Pricing Offerings
SAP Crystal
Windward Core
Free Trial
Yes
Yes
Free/Freemium Version
Yes
No
Premium Consulting/Integration Services
No
No
Entry-level Setup Fee
Optional
No setup fee
Additional Details
* SAP Crystal Reports 2020 Viewer allows you to view static data within a SAP Crystal Reports file.
* SAP Crystal Reports 2020 - Full version allows you to create powerful, richly formatted, and dynamic reports from virtually any data source, delivered in dozens of formats, in up to 28 languages. If you already have an older version of Crystal Reports, buy a license for SAP Crystal Reports 2020 - Upgrade at a discounted, upgrade price.
* SAP Crystal Server 2020, 1 NUL includes 1 license of: SAP Crystal Reports 2020 - SAP Crystal Server 2020.
* As an add-on to SAP Crystal Server 2020 1 NUL, SAP Crystal Server 2020 5 CAL allows you to support a wider, intermittent audience of end users, up to five logged on at the same time.
*Pay annually: 15% discount
10% discount for quarterly payment of Windward Core.
More Pricing Information
Community Pulse
SAP Crystal
Windward Core
Features
SAP Crystal
Windward Core
BI Standard Reporting
Comparison of BI Standard Reporting features of Product A and Product B
SAP Crystal
9.3
Ratings
13% above category average
Windward Core
-
Ratings
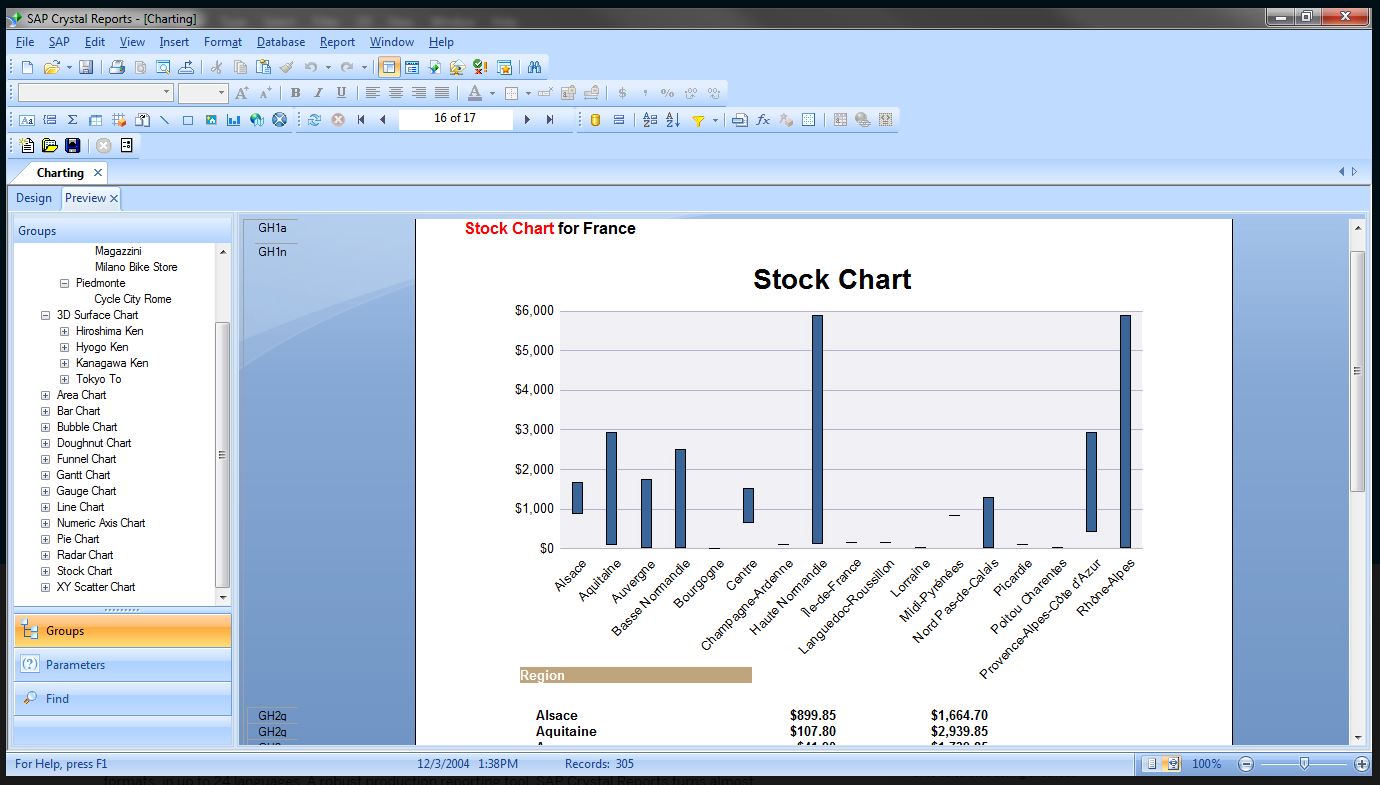
Pixel Perfect reports
8.00 Ratings
00 Ratings
Customizable dashboards
10.00 Ratings
00 Ratings
Report Formatting Templates
10.00 Ratings
00 Ratings
Ad-hoc Reporting
Comparison of Ad-hoc Reporting features of Product A and Product B
SAP Crystal
9.6
Ratings
18% above category average
Windward Core
-
Ratings
Drill-down analysis
10.00 Ratings
00 Ratings
Formatting capabilities
10.00 Ratings
00 Ratings
Integration with R or other statistical packages
8.60 Ratings
00 Ratings
Report sharing and collaboration
10.00 Ratings
00 Ratings
Report Output and Scheduling
Comparison of Report Output and Scheduling features of Product A and Product B
SAP Crystal
9.4
Ratings
12% above category average
Windward Core
-
Ratings
Publish to Web
9.20 Ratings
00 Ratings
Publish to PDF
10.00 Ratings
00 Ratings
Report Versioning
9.00 Ratings
00 Ratings
Report Delivery Scheduling
9.00 Ratings
00 Ratings
Delivery to Remote Servers
10.00 Ratings
00 Ratings
Data Discovery and Visualization
Comparison of Data Discovery and Visualization features of Product A and Product B
Generation of templated reports is the strong suit of SAP Crystal. Allows users to change formats in templates bases on requirement with minimal effort. Automated report delivery requires the user to be aware of sql which cannot be expected from all users. Should support more document export formats and improve the UI for SAP B1 Users
AutoTag is a brilliant solution for less complex reports where native Microsoft Office output is required. This is where AutoTag really shines. It's also appropriate in situations where our customers want to develop and maintain their own reports but don't necessarily want to commit an experienced data person or report developer to do the work. For complex report requirements that need JavaScript or considerable data manipulation inside the report templates, we will continue to look at other tools in our kit.
Great visualization for static format & precise tasks: For presentation to senior management /ex-co/vendors where concise decisions need to be made, Crystal is a nice choice to slide data into presentable views.
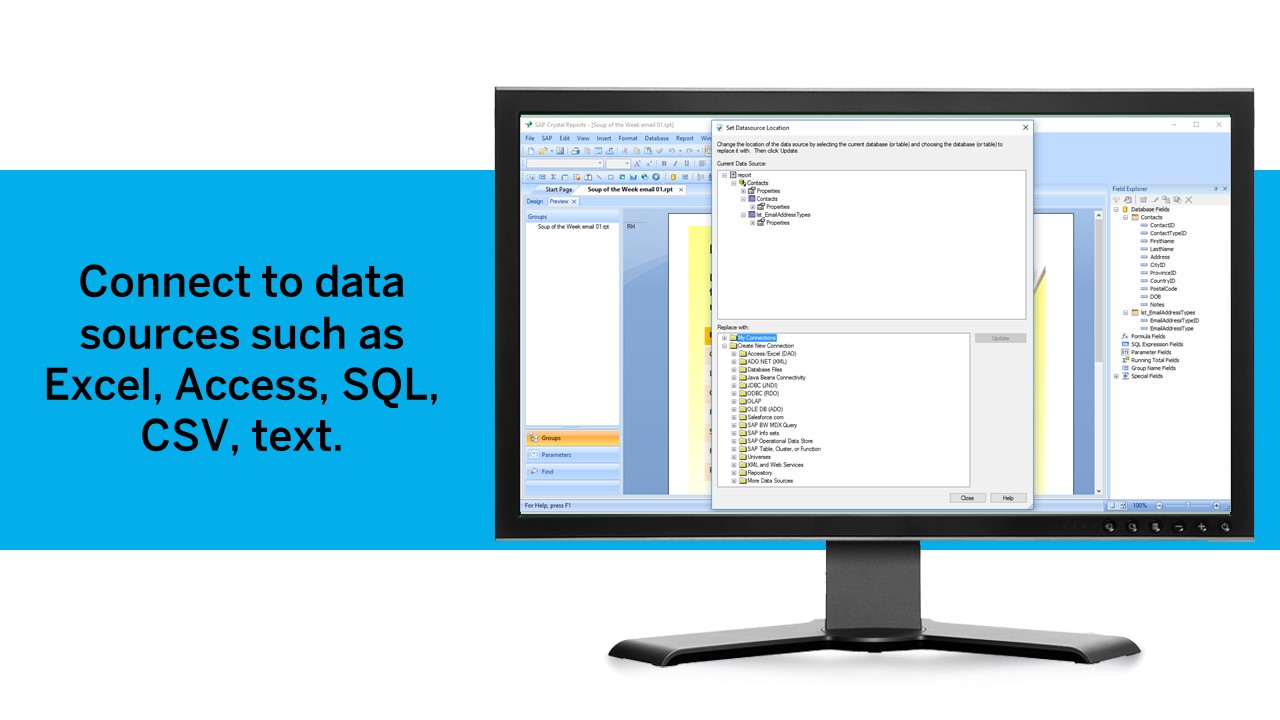
Diverse data source connect: We have used it to write reports using data from DB2, SQL, Progress, Excel spreadsheets, XML data, Access, and Lotus Notes databases. It can also be used to join different database types together in one report.
It uses the "recurring bands" structure for page layout which is efficient and fungible for generating different types of reports. Crystal doesn't require that we set up a metadata layer before creating reports and provides direct access to tables and dimensions.
AutoTag can easily be connected to virtually any data source. The wizard walks you through all the needed steps. This is very helpful in getting reports from multiple sources or departments.
WindWard has put together a Wiki based user guide and has the best tech support I have ever worked with. For the rare occasions that we get stuck trying to convert a report the help is plentiful.
AutoTag is built within the Office suite and is therefore able to leverage all the familiar features. This is very useful when you need to make reports useful and appealing.
It would be very helpful if it was possible for tag logic to handle an array of data. Without it, the syntax can become very verbose when there are multiple logical conditions to check.
Most tags are only built to handle a single piece of data so it can be a little confusing when a query only appears to return 1 record.
We have been using this product for so many years and it has truly become a cornerstone to our business processes when it comes to developing and distributing information via reports. We currently have over 500 reports developed to date over about 30 systems and that will continue to grow as user needs change.
Being able to get up and running quickly is a key asset. There's plenty of advanced features to master that are surprisingly difficult in others tools (or just missing from other tools altogether). The UI can feel a bit dated at times but its usability isn't affected. Any issue you have can usually be resolved by searching in the user community
For the most part, the Windward report designer is intuitive for our users; but there are a few areas where it is less intuitive. In these cases, our users need to search Windwards support wiki site, or even contact their support technicians. This can also be due to the short time we've had Windward and our lack of knowledge.
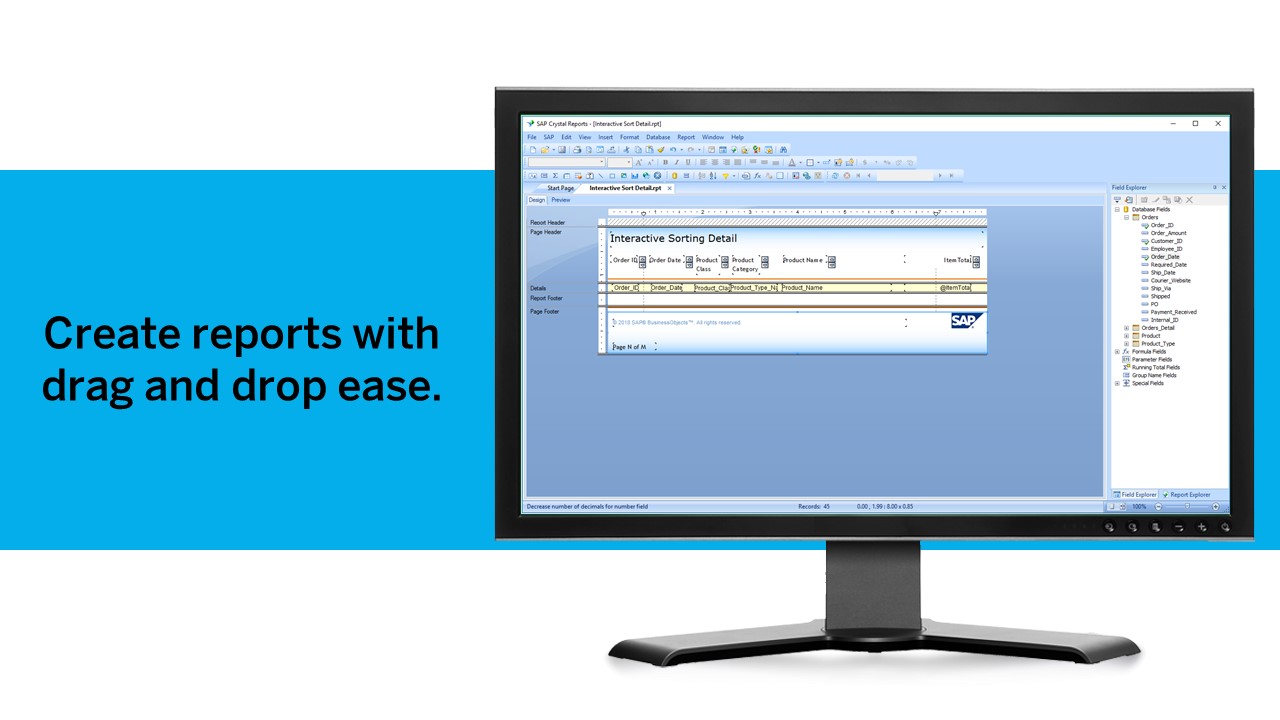
SAP Crystal report is very supportive in daily need of reports or any organization. Basic functionality of operational reports detailing the Sales Order details or PO in a manner which can be used very easily. A readily available solution for delivering any customized need in terms of pixelated reporting can be met easily with the tool
Support is something they take pride in. Once an issue is raised, they are quick to respond and provide details on a fix. No complaints on support here.
Just like any other implementation: When designing the differing reports, get end users' input, make sure to design the reports so that they display the information that the company requires, in the best and clearest way possible.
Test, test, test, revise when needed, and, particularly, do sufficient training so users are comfortable using Crystal Reports!
For standard pixel perfect reporting, our company still uses Crystal Reports. It allows us to continually provide standard reporting to our clients. For dashboards, we are moving towards Microsoft Power BI. Power BI allows similar collaboration, but generally has better features for dashboards. Power BI also allows us to publish multiple reports and dashboards into a single app for our end users.
Prior to Windward, we were using an HTML to PDF conversion for our reporting solution. It required substantial development to create and modify our reports and the styling was never up to our standards. Windward has certainly helped decrease our time in developing and modifying reports and has also helped us greatly improve the styling of them as well.