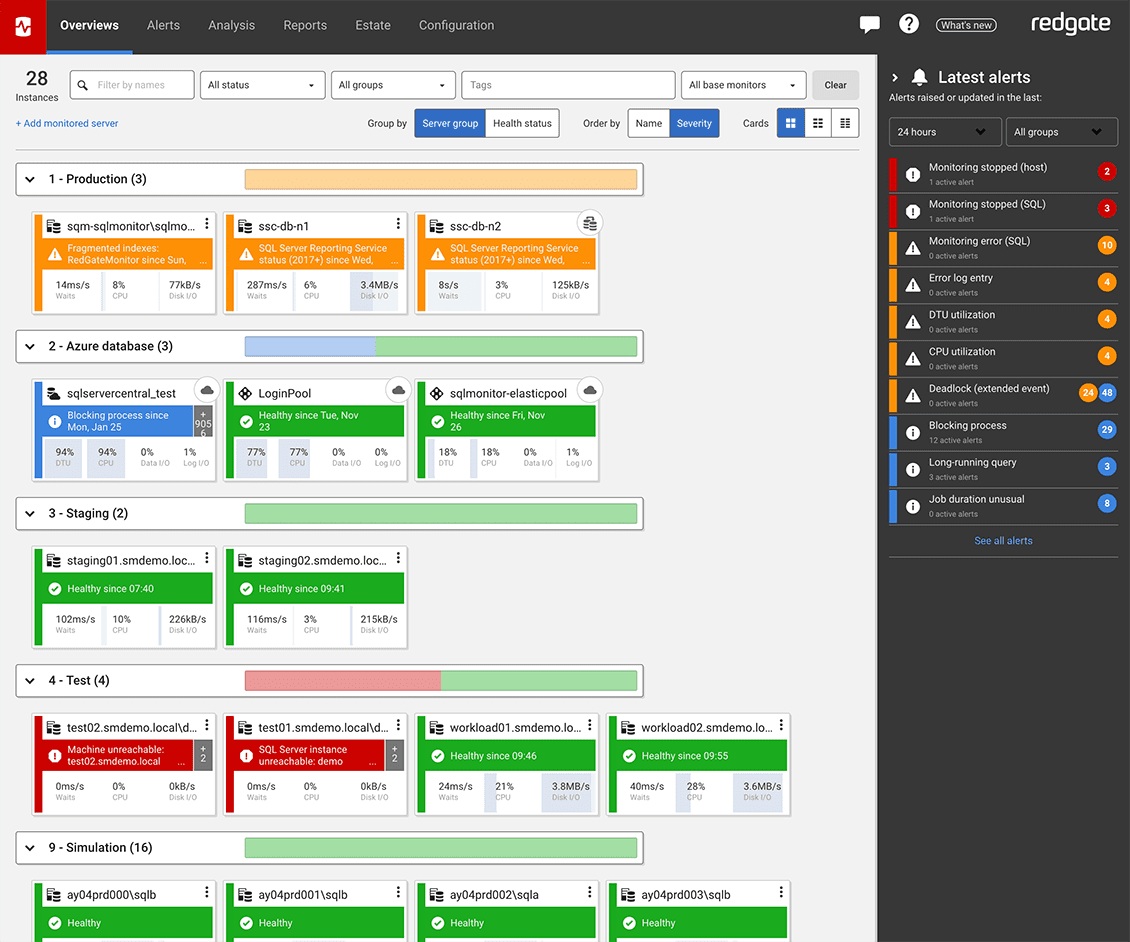
Redgate’s SQL Monitor helps teams looking after SQL servers be more proactive. SQL Monitor enables monitoring environments custom to the user’s SQL server to recognize issues before they impact users. It supports monitoring on-premises and cloud-based servers from a single interface.
$1,164
per year per server
SpeedCurve
Score10 out of 10
N/A
SpeedCurve measures the interplay between web design and web performance. They offer user experience monitoring tools that provide insight into what visitors are experiencing.
$143
per month
Pricing
Redgate Monitor
SpeedCurve
Editions & Modules
No answers on this topic
Small
$143
per month 500K RUM page views & 5K Synthetic checks
Medium
$1050
per month 5M RUM page views & 25K Synthetic checks
Large
$2,100
per month 10M RUM page views & 50K Synthetic checks
Offerings
Pricing Offerings
Redgate Monitor
SpeedCurve
Free Trial
Yes
No
Free/Freemium Version
No
No
Premium Consulting/Integration Services
Yes
No
Entry-level Setup Fee
Optional
No setup fee
Additional Details
All prices are per server and include one year’s support and upgrades.
20% discount for annual subscription.
More Pricing Information
Features
Redgate Monitor
SpeedCurve
Monitoring Tasks
Comparison of Monitoring Tasks features of Redgate Monitor and SpeedCurve
Feature
Redgate Monitor
-
Ratings
SpeedCurve
7.5
1 Ratings
3% below category average
Multi-device monitoring
00 Ratings
8.01 Ratings
Automated alerts and notifications
00 Ratings
7.01 Ratings
Reporting
Comparison of Reporting features of Redgate Monitor and SpeedCurve
Feature
Redgate Monitor
-
Ratings
SpeedCurve
8.0
1 Ratings
5% above category average
Performance data reports
00 Ratings
8.01 Ratings
Data visualization
00 Ratings
8.01 Ratings
Security
Comparison of Security features of Redgate Monitor and SpeedCurve
Redgate SQL Monitor is well suited for database administrators or companies who implement software that relies on SQL servers. It will help them test new changes and ensure this will not impact the performance of their software. It is a last resort for MSPs to use to get to the bottom of an ongoing performance issue with their SQL server.
A de minimis incentive was given to thank the reviewer for their time. The incentive was not used to bias or drive a particular response, nor was the incentive contingent on a positive endorsement. More Info
A de minimis incentive was given to thank the reviewer for their time. The incentive was not used to bias or drive a particular response, nor was the incentive contingent on a positive endorsement. More Info
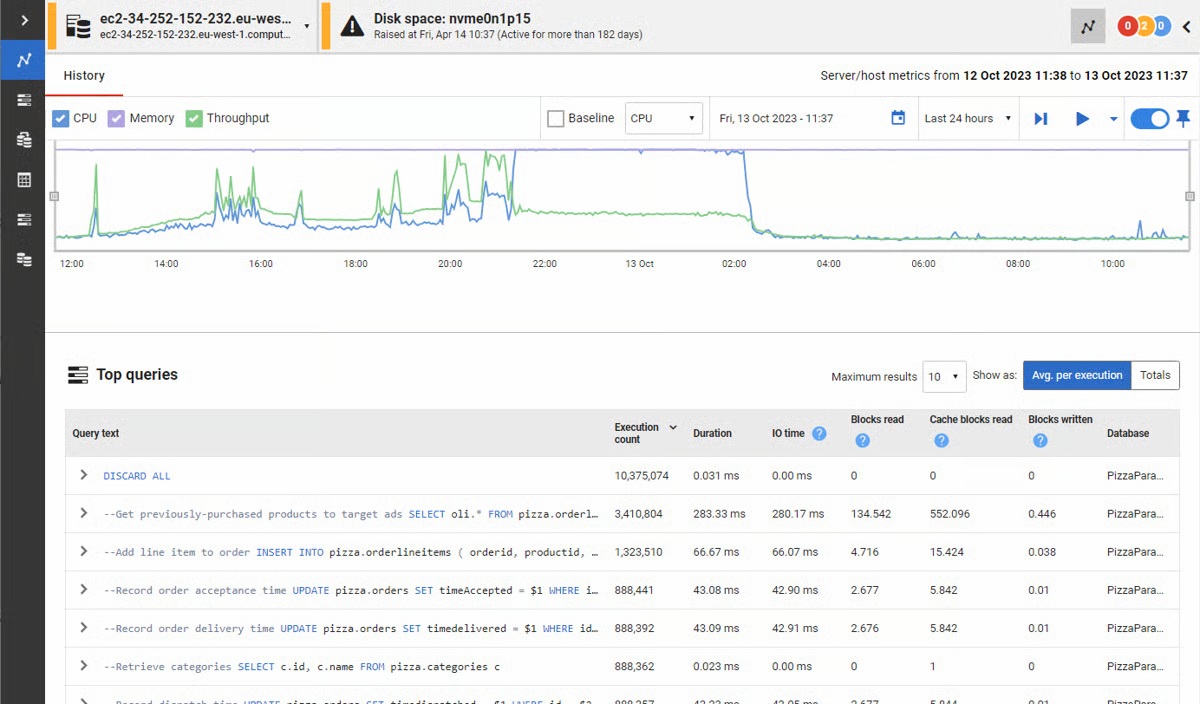
You can quickly see how your server is performing and which queries are taking the longest
I gives you the feeling that you are in control of your database, that you know what is going on for when they users ring up and tell you that the server is slow
A de minimis incentive was given to thank the reviewer for their time. The incentive was not used to bias or drive a particular response, nor was the incentive contingent on a positive endorsement. More Info
A de minimis incentive was given to thank the reviewer for their time. The incentive was not used to bias or drive a particular response, nor was the incentive contingent on a positive endorsement. More Info
A de minimis incentive was given to thank the reviewer for their time. The incentive was not used to bias or drive a particular response, nor was the incentive contingent on a positive endorsement. More Info
The interface has some confusing points, for instance aggregation setting (percentiles, median) is misleading, and doesn't do anything in some cases
Some additional statistical tools would super charge the charts and alerts: moving average, some more useful trend lines
The performance charts are amazing to compare many values (from different pages, multiple metrics) and find correlations. But the charts are barely usable when many metrics are shown (one cannot tell a line from the other). A simple UI improvement there could supercharge this use case
A de minimis incentive was given to thank the reviewer for their time. The incentive was not used to bias or drive a particular response, nor was the incentive contingent on a positive endorsement. More Info
A de minimis incentive was given to thank the reviewer for their time. The incentive was not used to bias or drive a particular response, nor was the incentive contingent on a positive endorsement. More Info
Redgate SQL Monitor is a lot cheaper than SolarWinds Database Performance Analyzer. I prefer the SolarWinds' design and that it offers integration with other SolarWinds products we already use. SolarWinds supports more than SQL servers (Oracle, MySQL, Maria DB, IBM DB2) and the analysis seems to be much better. The Spiceworks SQL Server monitoring is a free tool and is ideal for monitoring small business SQL instances.
A de minimis incentive was given to thank the reviewer for their time. The incentive was not used to bias or drive a particular response, nor was the incentive contingent on a positive endorsement. More Info
A de minimis incentive was given to thank the reviewer for their time. The incentive was not used to bias or drive a particular response, nor was the incentive contingent on a positive endorsement. More Info
A de minimis incentive was given to thank the reviewer for their time. The incentive was not used to bias or drive a particular response, nor was the incentive contingent on a positive endorsement. More Info
Speedcurve facilitates and empowers performance improvements that lead the higher conversion rates, user engagement and ultimately GMV
Through it's interface and automation, Speed curve saves hundreds of hours in investigations around performance issues
By facilitating performance analysis and knowledge sharing, SpeedCurve allows our teams to be more performance-aware, preventing performance issues from even happening
A de minimis incentive was given to thank the reviewer for their time. The incentive was not used to bias or drive a particular response, nor was the incentive contingent on a positive endorsement. More Info