Mode Analytics vs. Rational BI

Overview
ProductRatingMost Used ByProduct SummaryStarting Price
Mode
Score 8.1 out of 10
N/A
Mode, or Mode Analytics, from ThoughtSpot since the June 2023 acquisition, is a business intelligence platform that unifies company analytics by bringing data teams and business teams together, so analysts can provide rapid answers to strategic, ad hoc questions. And, business stakeholder can access relevant data to answer their own questions which can often detract more impactful work.N/A
Rational BI
Score 7.7 out of 10
Enterprise companies (1,001+ employees)
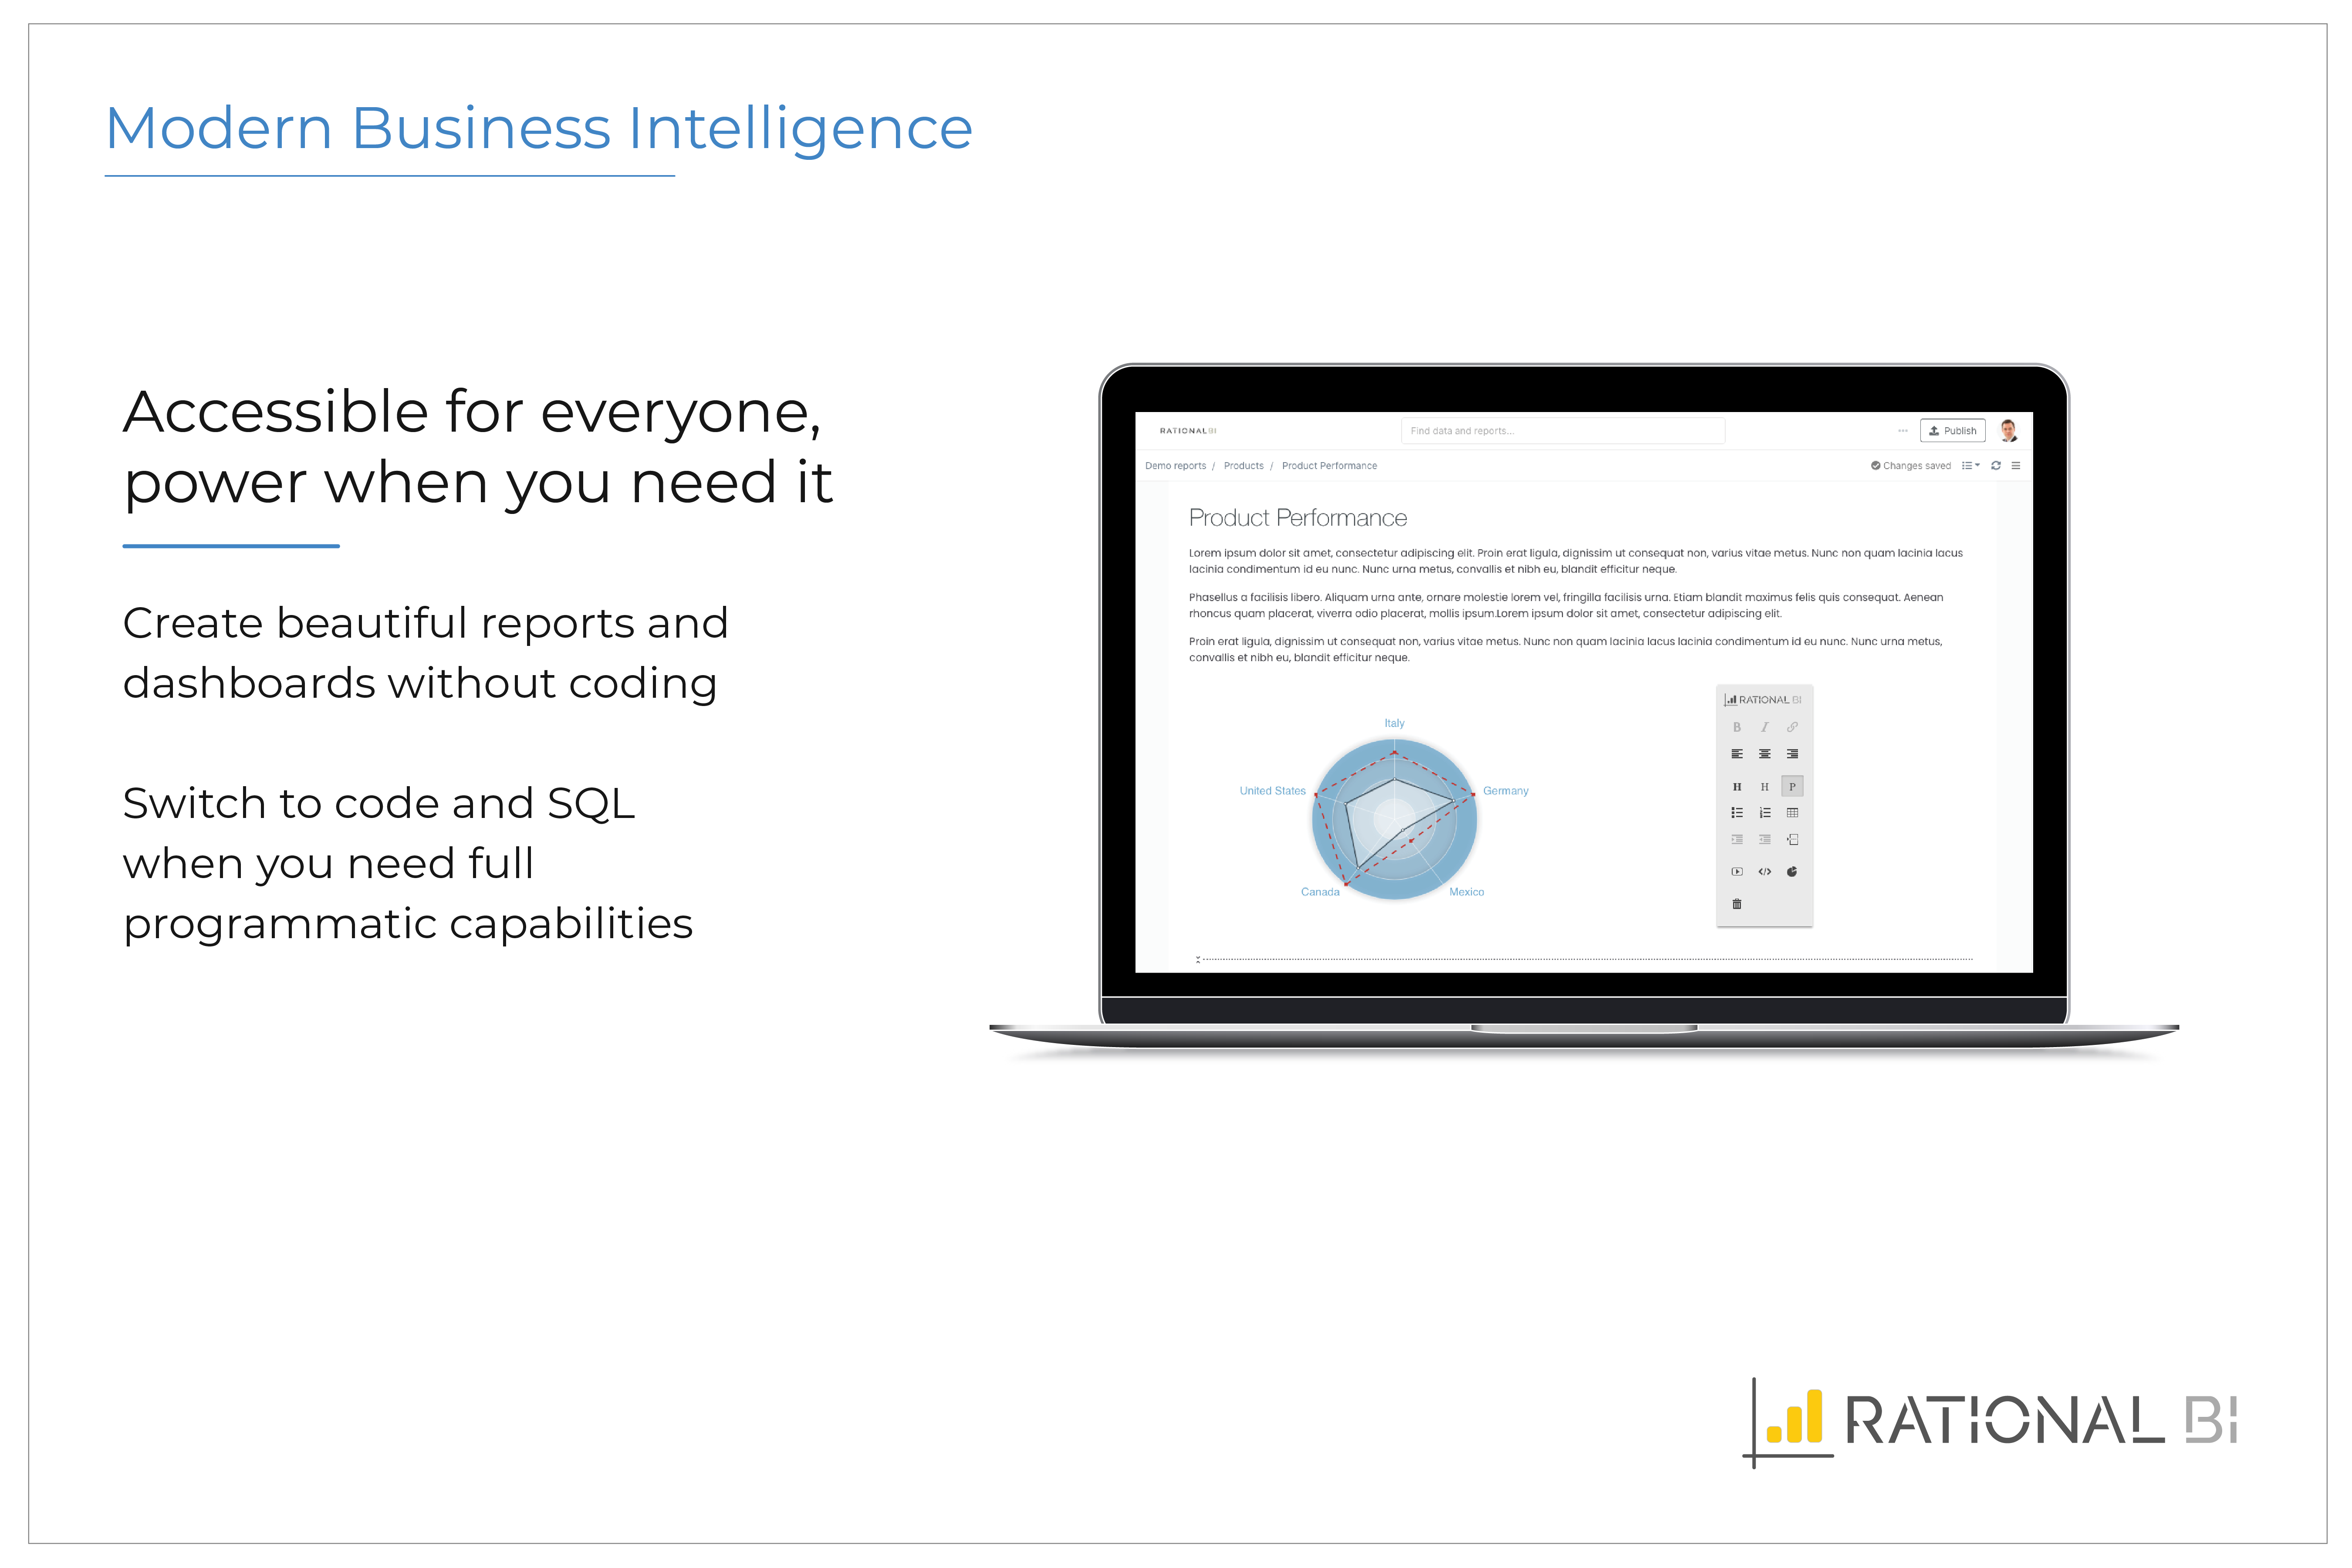
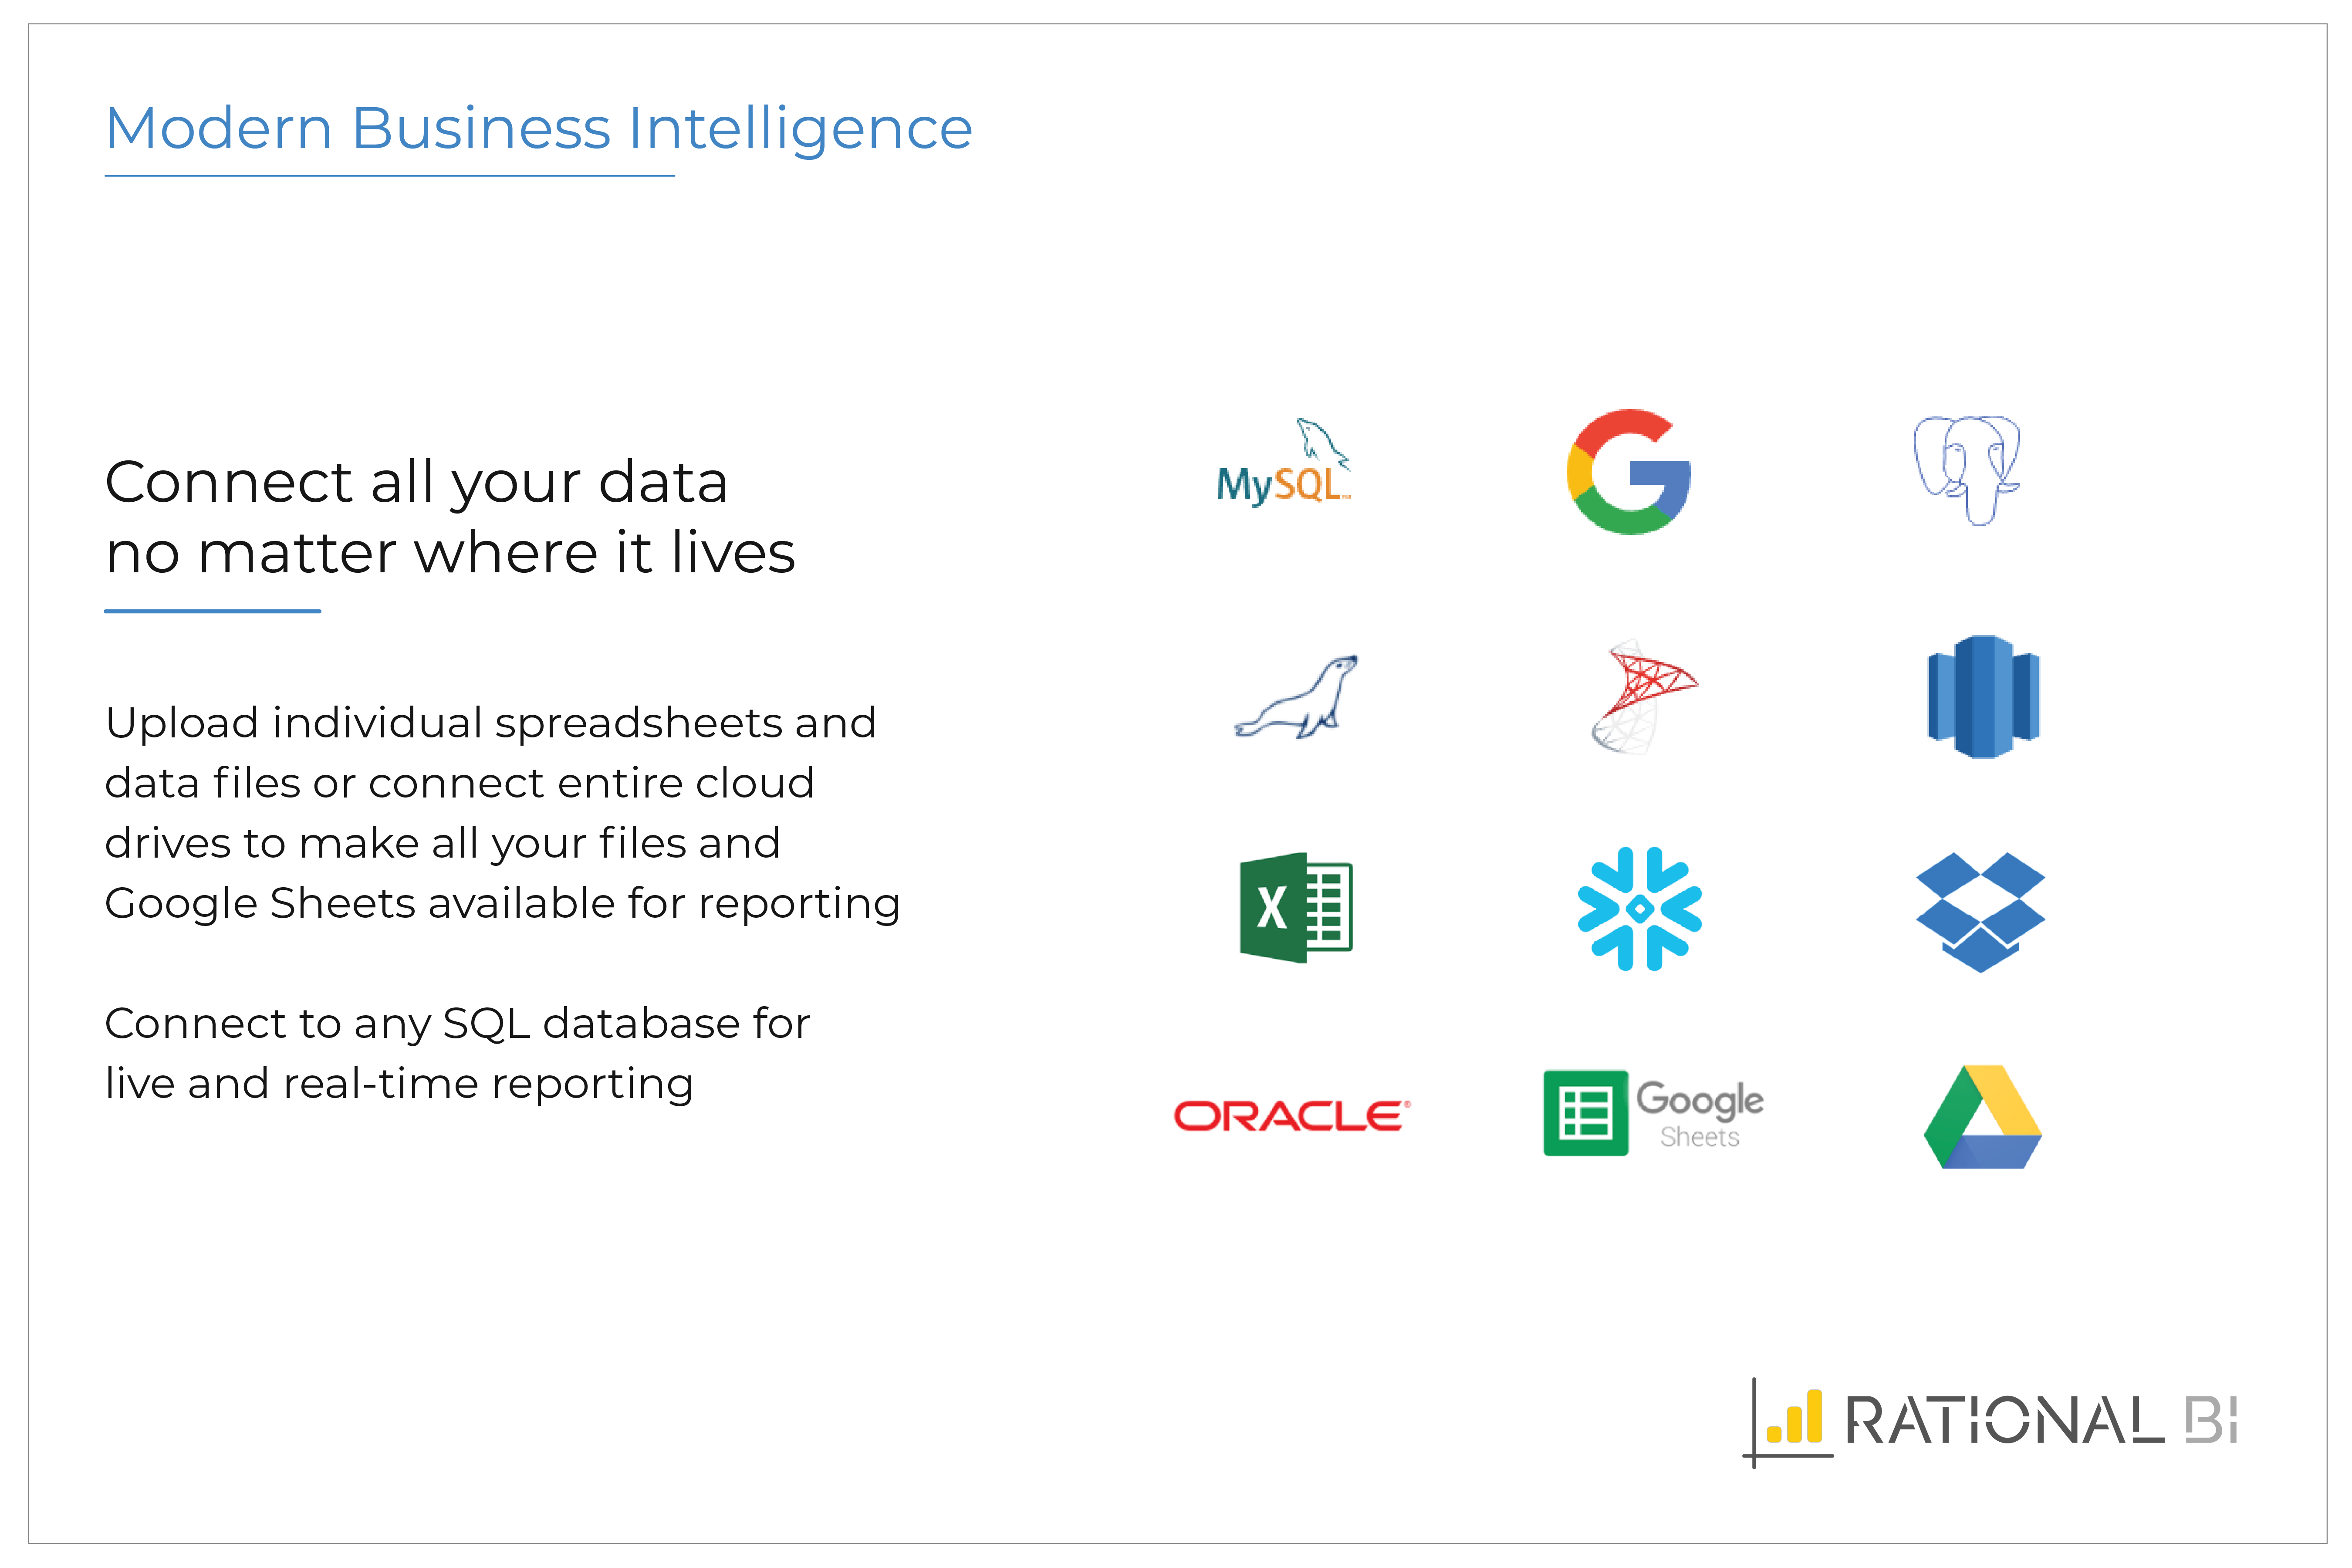
Rational BI provides analytics, data science and business intelligence in an analytical platform that connects to databases, data files and cloud drives including AWS and Azure data sources, enabling users to explore and visualize data. Users can build real-time notebook-style reports directly in a web browser with JavaScript and SQL with direct and live connections to data. Filter and query data with an SQL database embedded in the client, without network…
$0
single user
Pricing
Mode AnalyticsRational BI
Editions & Modules
No answers on this topic
Free
$0
single user
Professional
$129
single user
Enterprise
Varies
single user
Offerings
Pricing Offerings
ModeRational BI
Free Trial
YesYes
Free/Freemium Version
YesYes
Premium Consulting/Integration Services
NoNo
Entry-level Setup FeeNo setup feeOptional
Additional DetailsAdditional cost per extra user (varies by edition)
More Pricing Information
Community Pulse
Mode AnalyticsRational BI
Features
Mode AnalyticsRational BI
BI Standard Reporting
Comparison of BI Standard Reporting features of Product A and Product B
Mode Analytics
8.5
Ratings
4% above category average
Rational BI
8.3
Ratings
1% below category average
Pixel Perfect reports9.30 Ratings7.60 Ratings
Customizable dashboards8.40 Ratings8.70 Ratings
Report Formatting Templates7.80 Ratings8.50 Ratings
Ad-hoc Reporting
Comparison of Ad-hoc Reporting features of Product A and Product B
Mode Analytics
7.4
Ratings
8% below category average
Rational BI
8.3
Ratings
4% above category average
Drill-down analysis7.10 Ratings7.70 Ratings
Formatting capabilities6.70 Ratings8.20 Ratings
Integration with R or other statistical packages7.30 Ratings8.00 Ratings
Report sharing and collaboration8.70 Ratings9.20 Ratings
Report Output and Scheduling
Comparison of Report Output and Scheduling features of Product A and Product B
Mode Analytics
7.9
Ratings
5% below category average
Rational BI
9.0
Ratings
6% above category average
Publish to Web8.10 Ratings9.00 Ratings
Publish to PDF5.80 Ratings9.00 Ratings
Report Versioning7.70 Ratings8.60 Ratings
Report Delivery Scheduling9.60 Ratings9.20 Ratings
Delivery to Remote Servers8.30 Ratings9.30 Ratings
Data Discovery and Visualization
Comparison of Data Discovery and Visualization features of Product A and Product B
Mode Analytics
6.5
Ratings
20% below category average
Rational BI
8.2
Ratings
1% above category average
Pre-built visualization formats (heatmaps, scatter plots etc.)7.70 Ratings8.20 Ratings
Location Analytics / Geographic Visualization5.50 Ratings8.30 Ratings
Predictive Analytics6.40 Ratings7.90 Ratings
Access Control and Security
Comparison of Access Control and Security features of Product A and Product B
Mode Analytics
9.5
Ratings
11% above category average
Rational BI
-
Ratings
Multi-User Support (named login)10.00 Ratings00 Ratings
Role-Based Security Model9.00 Ratings00 Ratings
Multiple Access Permission Levels (Create, Read, Delete)9.00 Ratings00 Ratings
Single Sign-On (SSO)9.80 Ratings00 Ratings
Application Program Interfaces (APIs) / Embedding
Comparison of Application Program Interfaces (APIs) / Embedding features of Product A and Product B
Mode Analytics
9.0
Ratings
14% above category average
Rational BI
-
Ratings
REST API9.00 Ratings00 Ratings
User Ratings
Mode AnalyticsRational BI
Likelihood to Recommend
8.1
(0 ratings)
7.7
(0 ratings)
Usability
8.1
(0 ratings)
8.7
(0 ratings)
Support Rating
7.4
(0 ratings)
7.7
(0 ratings)
User Testimonials
Mode AnalyticsRational BI
Likelihood to Recommend
After launching a new contact pathway in a help experience, Mode Analytics can help provide insight into the sentiments from users as well as the engagement with any written content. Numeric outputs are easier to manage, whereas more nuanced/emotional feedback is sometimes hard to quantify (though not impossible if you get creative).
Read full review
Rational BI allows managing data analysis coming from different projects in order to create useful reports and dashboards. I usually set up automatically scheduled reports. All the stakeholders can easily share a rational view with the possibility to filter between the interesting arguments. Sometimes different user profiles could be needed, optimize the view.
Read full review
Pros
  • Easy to use (click a button and get right to SQL).
  • Security First (everything is locked down by default).
  • The White Label feature is super easy to skin -- our embedded reports look just like our app!
Read full review
  • Provides high performance embedded analytics
  • Seamless integration to import and export data
  • Rich features for data visualization
Read full review
Cons
  • Date ranges aren't always the most intuitive to set, strangely
  • Faster refresh rates would be ideal
  • Would love more dynamic mobile device integration (alerts, etc)
Read full review
  • Documentation for new users could be better. Sometimes it's hard for my users that are not that skilled in IS/IT to set up data connectors are understand the dynamics of data sources.
  • I have used several other BI solutions as well, and their GUI is okay, but surely there is also room for improvement here. Not all things are made entirely logically.
  • Understanding their price structure. Generally, their website looks nice, but it's not very informative when it comes to pricing, and support options. I really miss some kind of transparency and overview.
Read full review
Usability
For the advanced user already familiar with Python. It is just the same tool, already managed and connected to the data.
Read full review
Rational BI allows managing data analysis coming from different projects. The outputs are one or more reports, that can be delivered automatically to the stakeholders or other communication media inside the organization. Nice dashboards help to describe and analyze data. Sometimes different user profiles could be needed, optimize the view.
Read full review
Support Rating
Mode has dedicated agents who are online in a chatroom, ready to take on any questions and provide helpful feedback.
Read full review
I haven't had to use support to date for this product.
Read full review
Alternatives Considered
  • Tableau is a huge pain to edit or create dashboards, by comparison. It can make better looking visualizations, but in practice, letting users drill down and change dimensions slows the end user experience so much that it's often not worth it.
  • Looker is amazing for data modeling, but you have to get your whole business all in on it to take advantage. Viz capabilities are similar.
  • Databricks has a lot of functionality overlap, but the visualizations are terrible. Databricks' great strength is that you can use notebooks to do anything with code.
Read full review
Today there are many companies providing BI solutions, and generally, I think Microsoft Power BI is the easiest go-to solution as it is part of the Office365 software. However all software solutions have their limitations, advantages, and disadvantages, but sometimes you don't need the perfect solution. You just need a solution that delivers 80-90 percent of the full potential to reach your goal and in this scope, we were really happy with Rational BI.
Read full review
Return on Investment
  • It has allowed us to monitor ongoing financial transactions written to our SQL data tables in real-time and that helps us to monitor user transaction activities in real-time
  • Using Mode we have been able to also track users who undertake fraudulent financial transactions; preventing financial losses to our users
  • Mode's collaborative abilities have been very helpful in sharing transaction monitoring workload across our compliance and cybersecurity team
Read full review
  • Allows folks to work on other items as reporting is done in the background.
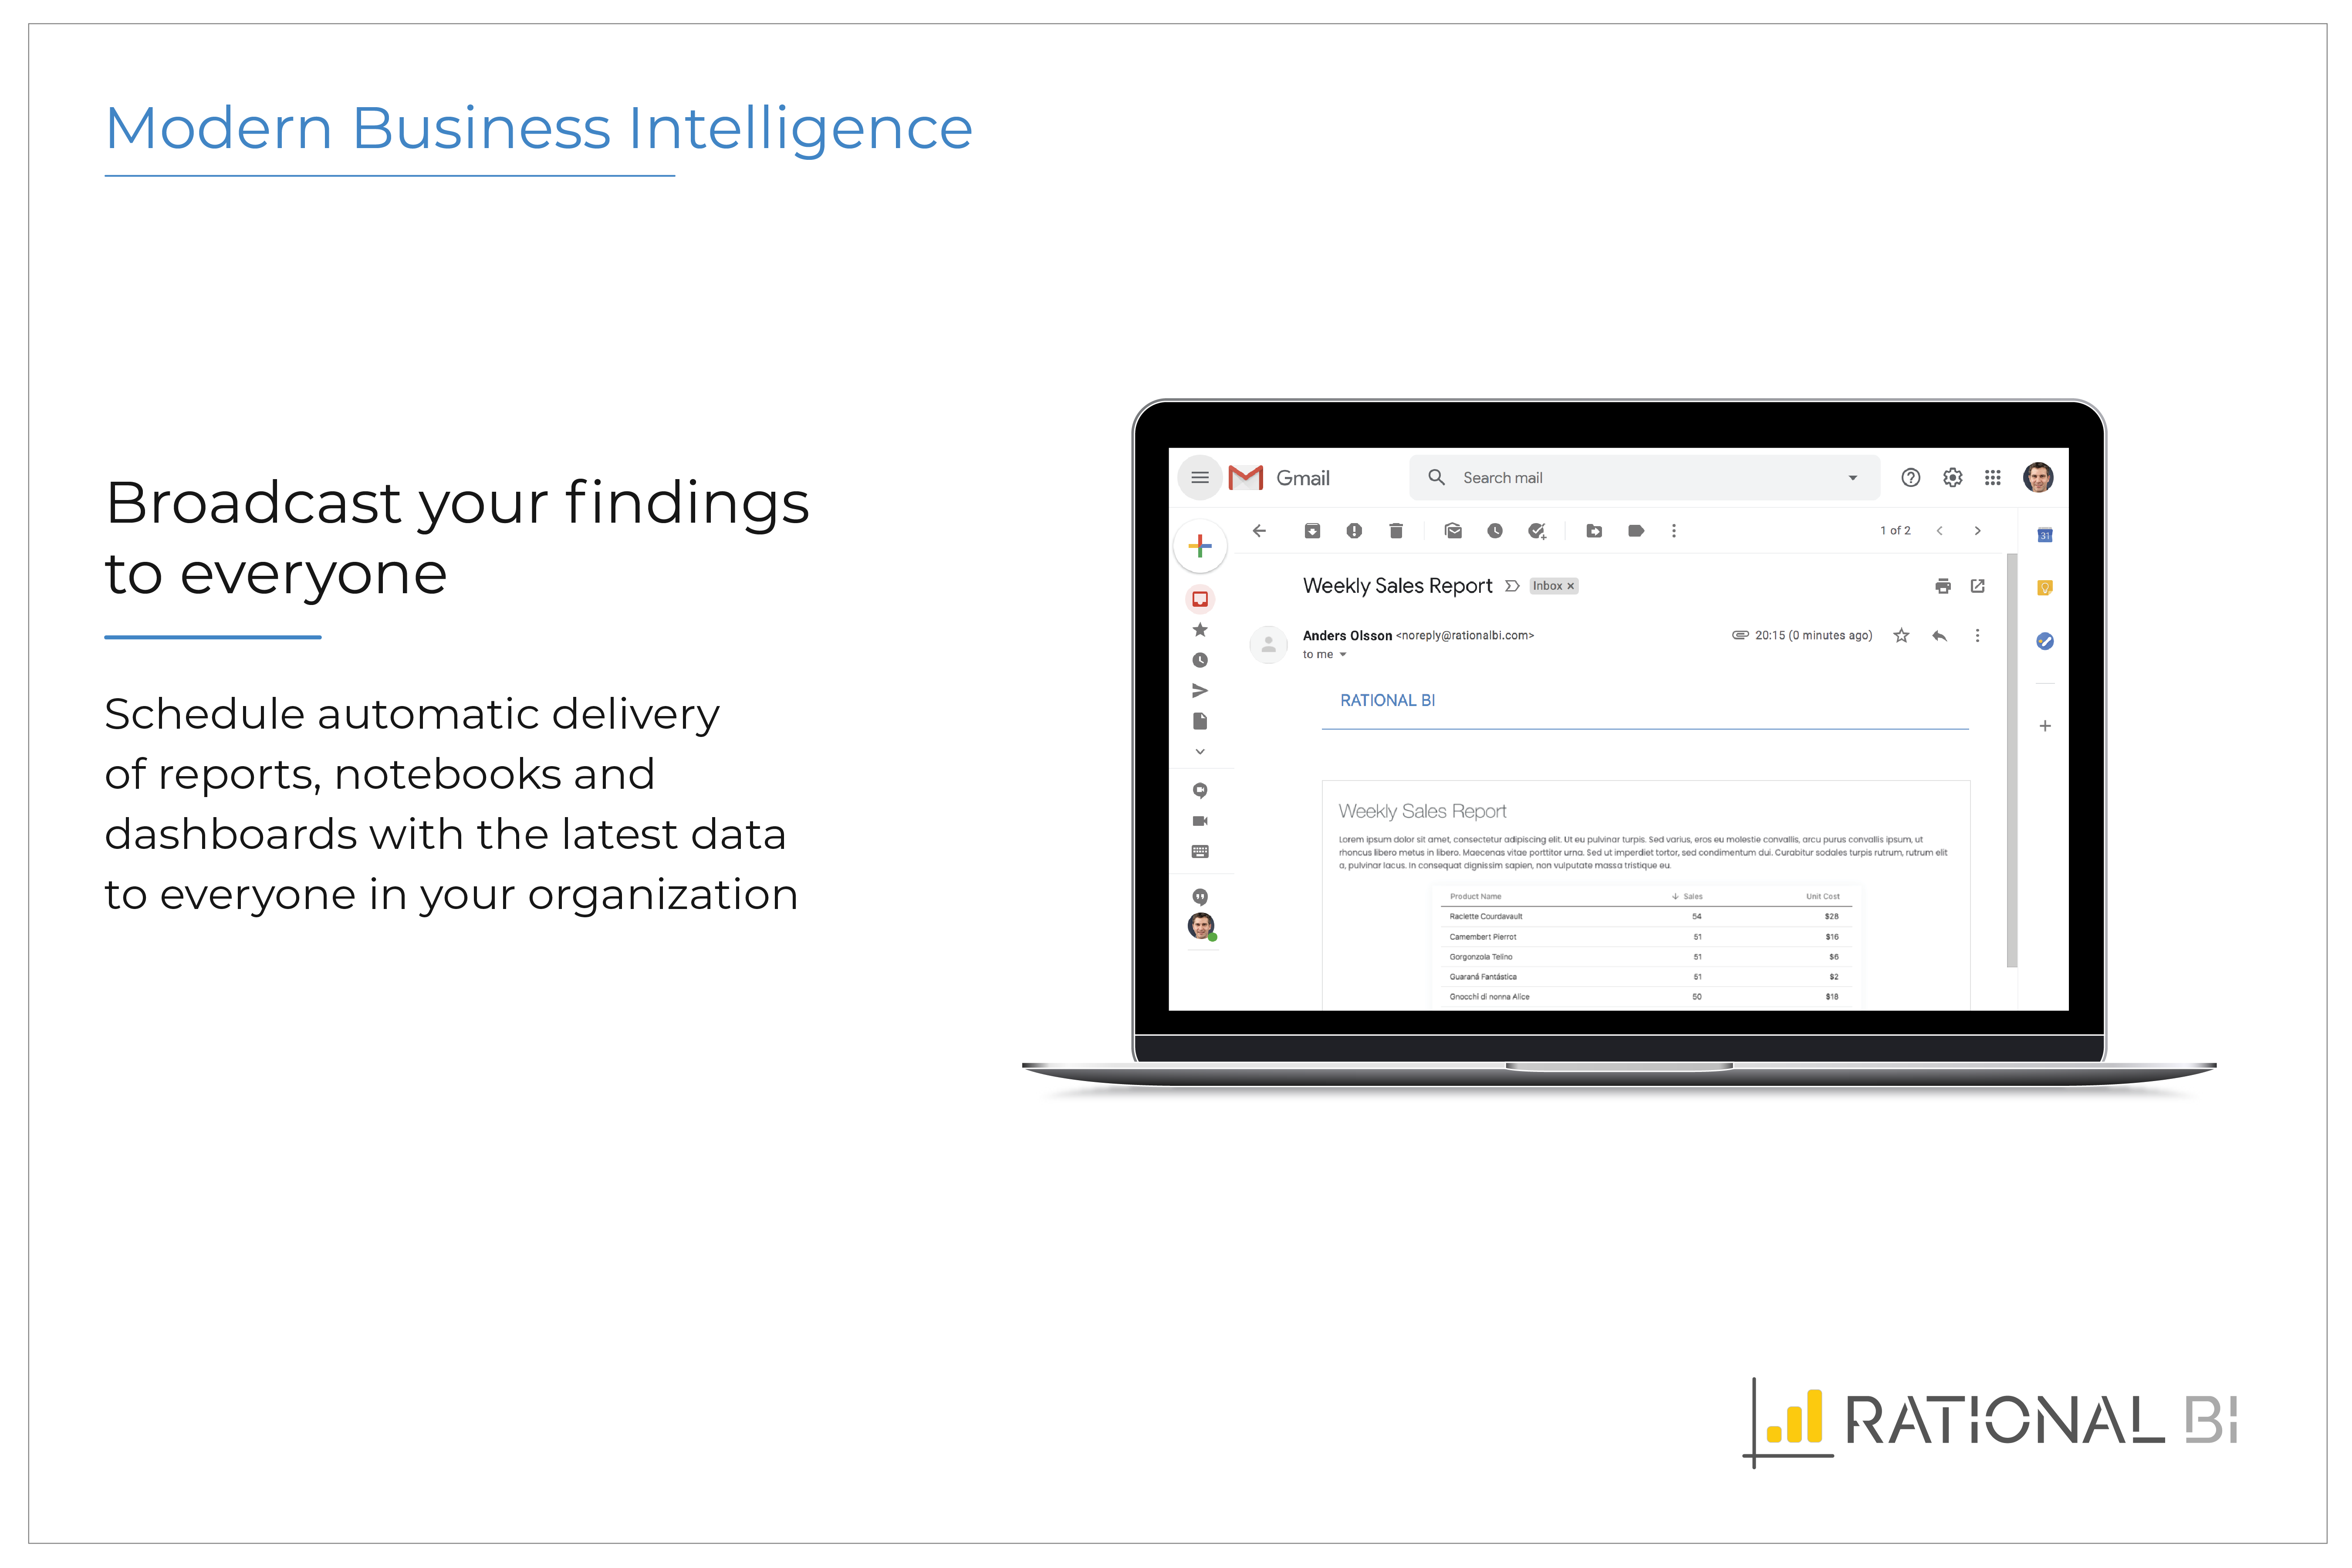
  • Scheduling and delivery of reports with one click.
  • Single pane of management.
  • Ease of use.
Read full review
ScreenShots

Rational BI Screenshots

Screenshot of Modern Business IntelligenceScreenshot of Drag-and-drop InsightsScreenshot of Accessible for everyone, power when you need itScreenshot of Beautiful analytics on every screen and deviceScreenshot of Scheduled reporting: Broadcast your findings to everyoneScreenshot of Connect all your data no matter where it lives