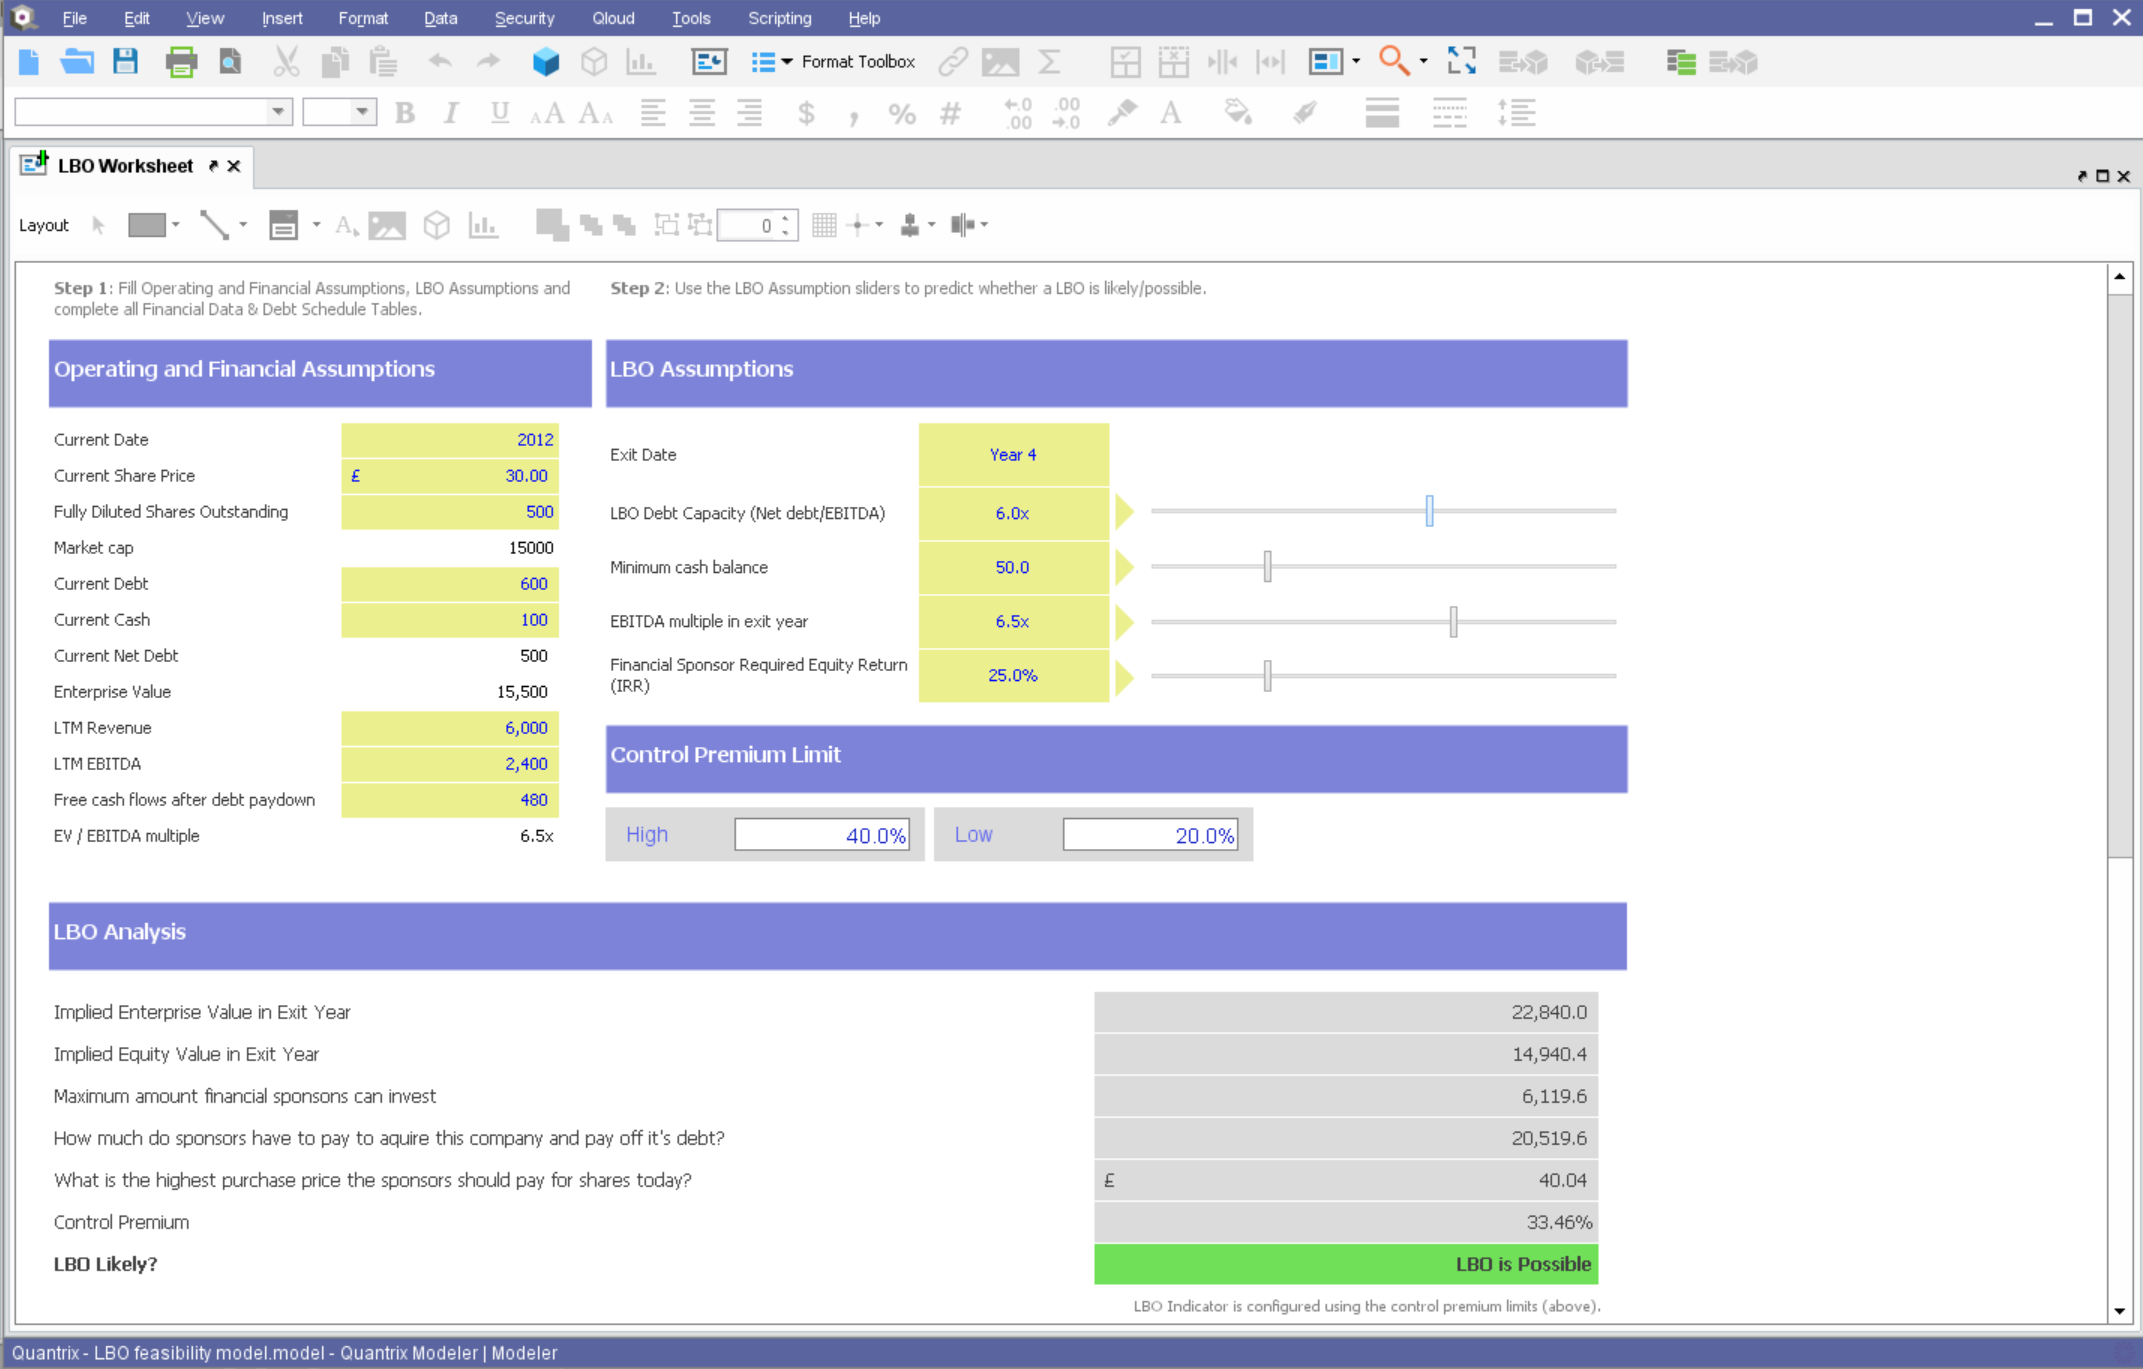
Quantrix is designed to allow users to address the limitations and risks inherent to spreadsheets when developing business-critical models. According to the vendor, this solution offers unmatched capability for forecasting, planning, budgeting, risk modeling and visual analytics, and also allows users to develop ‘what if’ scenarios and model the financial and operational impact of business decisions. Additionally, the vendor says sharing insight is made easier through the creation of interactive…
N/A
SAP Analytics Cloud
Score 7.8 out of 10
N/A
The SAP Analytics Cloud solution brings together analytics and planning with integration to SAP applications and access to heterogenous data sources. As the analytics and planning solution within SAP Business Technology Platform, SAP Analytics Cloud supports trusted insights and integrated planning processes enterprise-wide to help make decisions without doubt.
$36
per month per user
Pricing
Quantrix
SAP Analytics Cloud
Editions & Modules
No answers on this topic
SAP Analytics Cloud for Business Intelligence
$36.00
per month per user
SAP Analytics Cloud for Planning
Price upon request
per month per user
Offerings
Pricing Offerings
Quantrix
SAP Analytics Cloud
Free Trial
Yes
Yes
Free/Freemium Version
No
No
Premium Consulting/Integration Services
No
No
Entry-level Setup Fee
No setup fee
No setup fee
Additional Details
Quantrix Modeler is licensed on a per user subscription basis.
A 30-day trial with SAP Analytics Cloud is available, supporting analytics enterprise-wide. A trial can be extended up to 90 days on request.
More Pricing Information
Community Pulse
Quantrix
SAP Analytics Cloud
Features
Quantrix
SAP Analytics Cloud
Budgeting, Planning, and Forecasting
Comparison of Budgeting, Planning, and Forecasting features of Product A and Product B
Quantrix
9.3
Ratings
12% above category average
SAP Analytics Cloud
-
Ratings
Long-term financial planning
9.70 Ratings
00 Ratings
Financial budgeting
9.00 Ratings
00 Ratings
Forecasting
10.00 Ratings
00 Ratings
Scenario modeling
9.00 Ratings
00 Ratings
Management reporting
9.00 Ratings
00 Ratings
Consolidation and Close
Comparison of Consolidation and Close features of Product A and Product B
Quantrix
8.0
Ratings
1% above category average
SAP Analytics Cloud
-
Ratings
Financial data consolidation
8.30 Ratings
00 Ratings
Multi-currency management
8.40 Ratings
00 Ratings
Minority Ownership
8.00 Ratings
00 Ratings
Local and consolidated reporting
8.70 Ratings
00 Ratings
Detailed Audit Trails
6.70 Ratings
00 Ratings
Financial Reporting and Compliance
Comparison of Financial Reporting and Compliance features of Product A and Product B
Quantrix
9.0
Ratings
11% above category average
SAP Analytics Cloud
-
Ratings
Financial Statement Reporting
9.00 Ratings
00 Ratings
Management Reporting
9.00 Ratings
00 Ratings
Automated board and financial reporting
9.00 Ratings
00 Ratings
Analytics and Reporting
Comparison of Analytics and Reporting features of Product A and Product B
Quantrix
8.5
Ratings
6% above category average
SAP Analytics Cloud
-
Ratings
Personalized dashboards
8.00 Ratings
00 Ratings
Color-coded scorecards
6.40 Ratings
00 Ratings
KPIs
10.00 Ratings
00 Ratings
Cost and profitability analysis
8.60 Ratings
00 Ratings
Key Performance Indicator setting
10.00 Ratings
00 Ratings
Benchmarking with external data
8.20 Ratings
00 Ratings
Integration
Comparison of Integration features of Product A and Product B
Quantrix
9.0
Ratings
8% above category average
SAP Analytics Cloud
-
Ratings
Flat file integration
9.00 Ratings
00 Ratings
Excel data integration
9.00 Ratings
00 Ratings
Direct links to 3rd-party data sources
9.00 Ratings
00 Ratings
BI Standard Reporting
Comparison of BI Standard Reporting features of Product A and Product B
Quantrix
-
Ratings
SAP Analytics Cloud
8.0
Ratings
2% below category average
Pixel Perfect reports
00 Ratings
8.00 Ratings
Customizable dashboards
00 Ratings
8.10 Ratings
Report Formatting Templates
00 Ratings
7.90 Ratings
Ad-hoc Reporting
Comparison of Ad-hoc Reporting features of Product A and Product B
Quantrix
-
Ratings
SAP Analytics Cloud
7.9
Ratings
2% below category average
Drill-down analysis
00 Ratings
8.10 Ratings
Formatting capabilities
00 Ratings
8.10 Ratings
Integration with R or other statistical packages
00 Ratings
7.70 Ratings
Report sharing and collaboration
00 Ratings
7.80 Ratings
Report Output and Scheduling
Comparison of Report Output and Scheduling features of Product A and Product B
Quantrix
-
Ratings
SAP Analytics Cloud
8.0
Ratings
4% below category average
Publish to Web
00 Ratings
8.00 Ratings
Publish to PDF
00 Ratings
8.40 Ratings
Report Versioning
00 Ratings
8.10 Ratings
Report Delivery Scheduling
00 Ratings
7.70 Ratings
Data Discovery and Visualization
Comparison of Data Discovery and Visualization features of Product A and Product B
Quantrix Modeler is one of the most appropriate software tools for developing dynamic financial planning models in small teams composed by skilled power users. There is an also Enterprise version supporting larger user bases and stronger integration with company backend systems. It's not advisable to put Quantrix desktop application in the hands of non-skilled staff since the learning curve is much steeper than what's the typical experience with spreadsheets. Adding a table with ad hoc simple calculations can be done by anyone in a spreadsheet, but requires knowledgeable design in a Quantrix model. On the positive side, experience with students in our classes shows that with focused training an user can be become productive in a relatively short time. There is a web version of Quantrix Modeler, Qloud, that is aimed to end users that only modify input data and consume model results, without the possibility of changing the model logic (structure and formulas)
SAP Ecosystem Integration:For businesses already using other SAP solutions such as SAP BW or SAP HANA, SAP Analytics Cloud is a natural fit. It integrates well with the broader SAP ecosystem, providing a cohesive analytics experience for users familiar with SAP technologies.Predictive Analytics Use Cases:Companies seeking to incorporate predictive analytics into their decision-making processes can leverage SAP Analytics Cloud. Its built-in predictive features enable users to create models and gain insights into future trends based on historical data.
Quantrix gathers info from numerous sources in a single click. Thereby making structure to process sustainable and scale-able. Once the logic is written the data refreshes and you are good to go with furture analysis and planning. There is no need for rework, copying down formulas, etc. In our latest product wheel build process we reduced our time from 3 weeks of time to 2 days to build out product wheels. There was a sharp contrast between Excel ( previous method) and Quantrix.
Quantrix links perfectly to SQL Server which allows us to get actual data quickly, push out forecasts or other data for other systems to consume.
Quantrix range based formula writing and common term formulas are a HUGE time saver. Debugging formulas is a breeze in Quantrix using what is called the dependency inspector. There is no need to copy down formulas; make sure cell ranges are locked etc. It is one formula controlling a multitude of cells that scales as the data set shrinks or grows. Also if there is an error in the formula you have 1 formula to fix not hundreds or even thousands. Common terms in your formulas helps immensely and reduces the amount of headache of debugging your formulas.
Quantrix Scales with ease. Adding additional data or shrinking the data does not require (manual) structure updates to Quantrix. It accordions according to the data imported. Pivoting data and looking at it as well as filtering it and then building off of those filters and pivots is a joy to do in Quantrix!
Complexity - Excel does not have it! Where the vlookup ends in Excel the Quantrix Select statement is just warming up. Functions like: Select, Selects, SelectList, SelectGreaterThan, SelectBetween, SelectLessThan, and one of my new favorites SelectLike in addition to CASE and Switch Logic make Quantrix a dominating force when it comes to writing complex logic in your business model. Quantrix does is beautifully.
It makes it easier yo analyse order and related records easily.
We can easily maintain and track the performance of employees in organisation.
Can easily track various aspects for the growth of an organisation thus allowing real time analysis and tracking of organisation's growth and performance.
Quantrix was able to free the definition of calculation rules from cells. It would be interesting to be able to separate the default template structure from changes when importing data.
Just to be clear to prevent the import (example from a CSV or DB) the creation of new items in addition to those already existing.
An import navigation by level would be interesting. Or to obtain a split of the number on a tree structure (I bring as an example that of Corporate Planning (https://www.corporate-planning.com/de/).
As a further enhancement of the above, it would be interesting to be able to define reports like an explosion of a tree structure.
There’s no doubt I will renew SAP Analytics Cloud. It is the most vital tool in our organization that makes it seamless to make rapid business decisions by collecting, modeling and visualizing data in real-time.
On a scale of 1 to 10, I would rate 8 SAP Analytics Cloud's overall usability as a 7. SAC has a clean, modern user interface with drag-and-drop features. It is an integrated platform that combines reporting, planning, and predictive analytics in one tool. It has Real-time connectivity with SAP data sources like S/4HANA.
Self-service analytics capabilities allow non-technical users to build simple dashboards.
I would rate SAP Analytics Cloud an 8 out of 10 for scalability. It offers a flexible, cloud-based architecture that supports expansion across departments and geographies. The platform adapts well to growing data volumes and user needs, making it a strong choice for organizations looking to scale analytics capabilities efficiently.
I would rate SAP Analytics Cloud’s performance an 8 out of 10. Pages generally load quickly, and reports run within a reasonable time frame, even with complex datasets. Integration with other systems is smooth and doesn’t noticeably affect performance. Overall, it’s a responsive and efficient tool for business analytics. But
Since the implementation stage, the support team has been very helpful and assisting. Even in the later stages, the tech team had quite a rapid response. In general, SAP has provided us with great customer support, let it be for a specific product of SAP or for integration of different modules.
SAC is a simple solution ad it works fine when connecting it to other SAP tools. On the other hand, connecting it to third party solutions brings difficulties when there's no previous design and the objetives are not clear. It is really important to integrate Business users from the start to provide with valuable business insights
Microsoft Excel, Infor, Tagetik, Palantir Quantrix is not ready to use budgeting and planning tool, it is basically data modeling tool. That makes Quantrix different. You yourself or with help of consultant create model according to your specific business needs. You will get cost-effective, tailored solution. It is a modeling tool that allows the easy and quick creation of multiple scenarios, conducting “what-if” analysis to accommodate uncertainty associated with forecasts.
SAP Analytics Cloud and Power BI are both tools that help businesses understand their data, but they have some differences. SAC, made by SAP, works well if your company already uses other SAP products. It's in the cloud, easy to use, and has features for analyzing data, getting insights, and planning for the future. Power BI, made by Microsoft, can be used in the cloud or on your own computers. It fits well with Microsoft tools, is easy to use, and can do advanced data analysis. SAC has built-in planning tools, while Power BI needs extra tools for detailed planning
I would rate SAP Analytics Cloud an 8 out of 10 for scalability. It offers a flexible, cloud-based architecture that supports expansion across departments and geographies. The platform adapts well to growing data volumes and user needs, making it a strong choice for organizations looking to scale analytics capabilities efficiently.
Quantrix has boosted profitability and has proven its worth time and again. The platform has put us on the radar doing things even our biggest competitors could only dream of. We are still early in the development and deployment of our Quantrix Qloud based system to clients, but we already have early adopters coming over from competitor systems that cost exponentially more and do significantly less than what we provide. We feel it is only a matter of time for our Qloud driven analytics to become more mainstream in our space.
Optimized our budgeting and forecasting processes. The platform facilitates real-time collaboration among our teams, allowing for more accurate and agile financial planning. This has led to improved precision in budget allocation, ensuring that resources are strategically deployed to support the most promising startups within our portfolio.
SAC's intuitive dashboards and visualizations provide a consolidated view of key performance indicators, startup health metrics, and portfolio analytics. This heightened data visibility enables our teams to make informed decisions promptly, identify emerging trends, and proactively address challenges.
Routine tasks, such as performance tracking and reporting, are automated, allowing our teams to focus on more strategic initiatives. This has resulted in time savings and increased productivity across various operational processes.