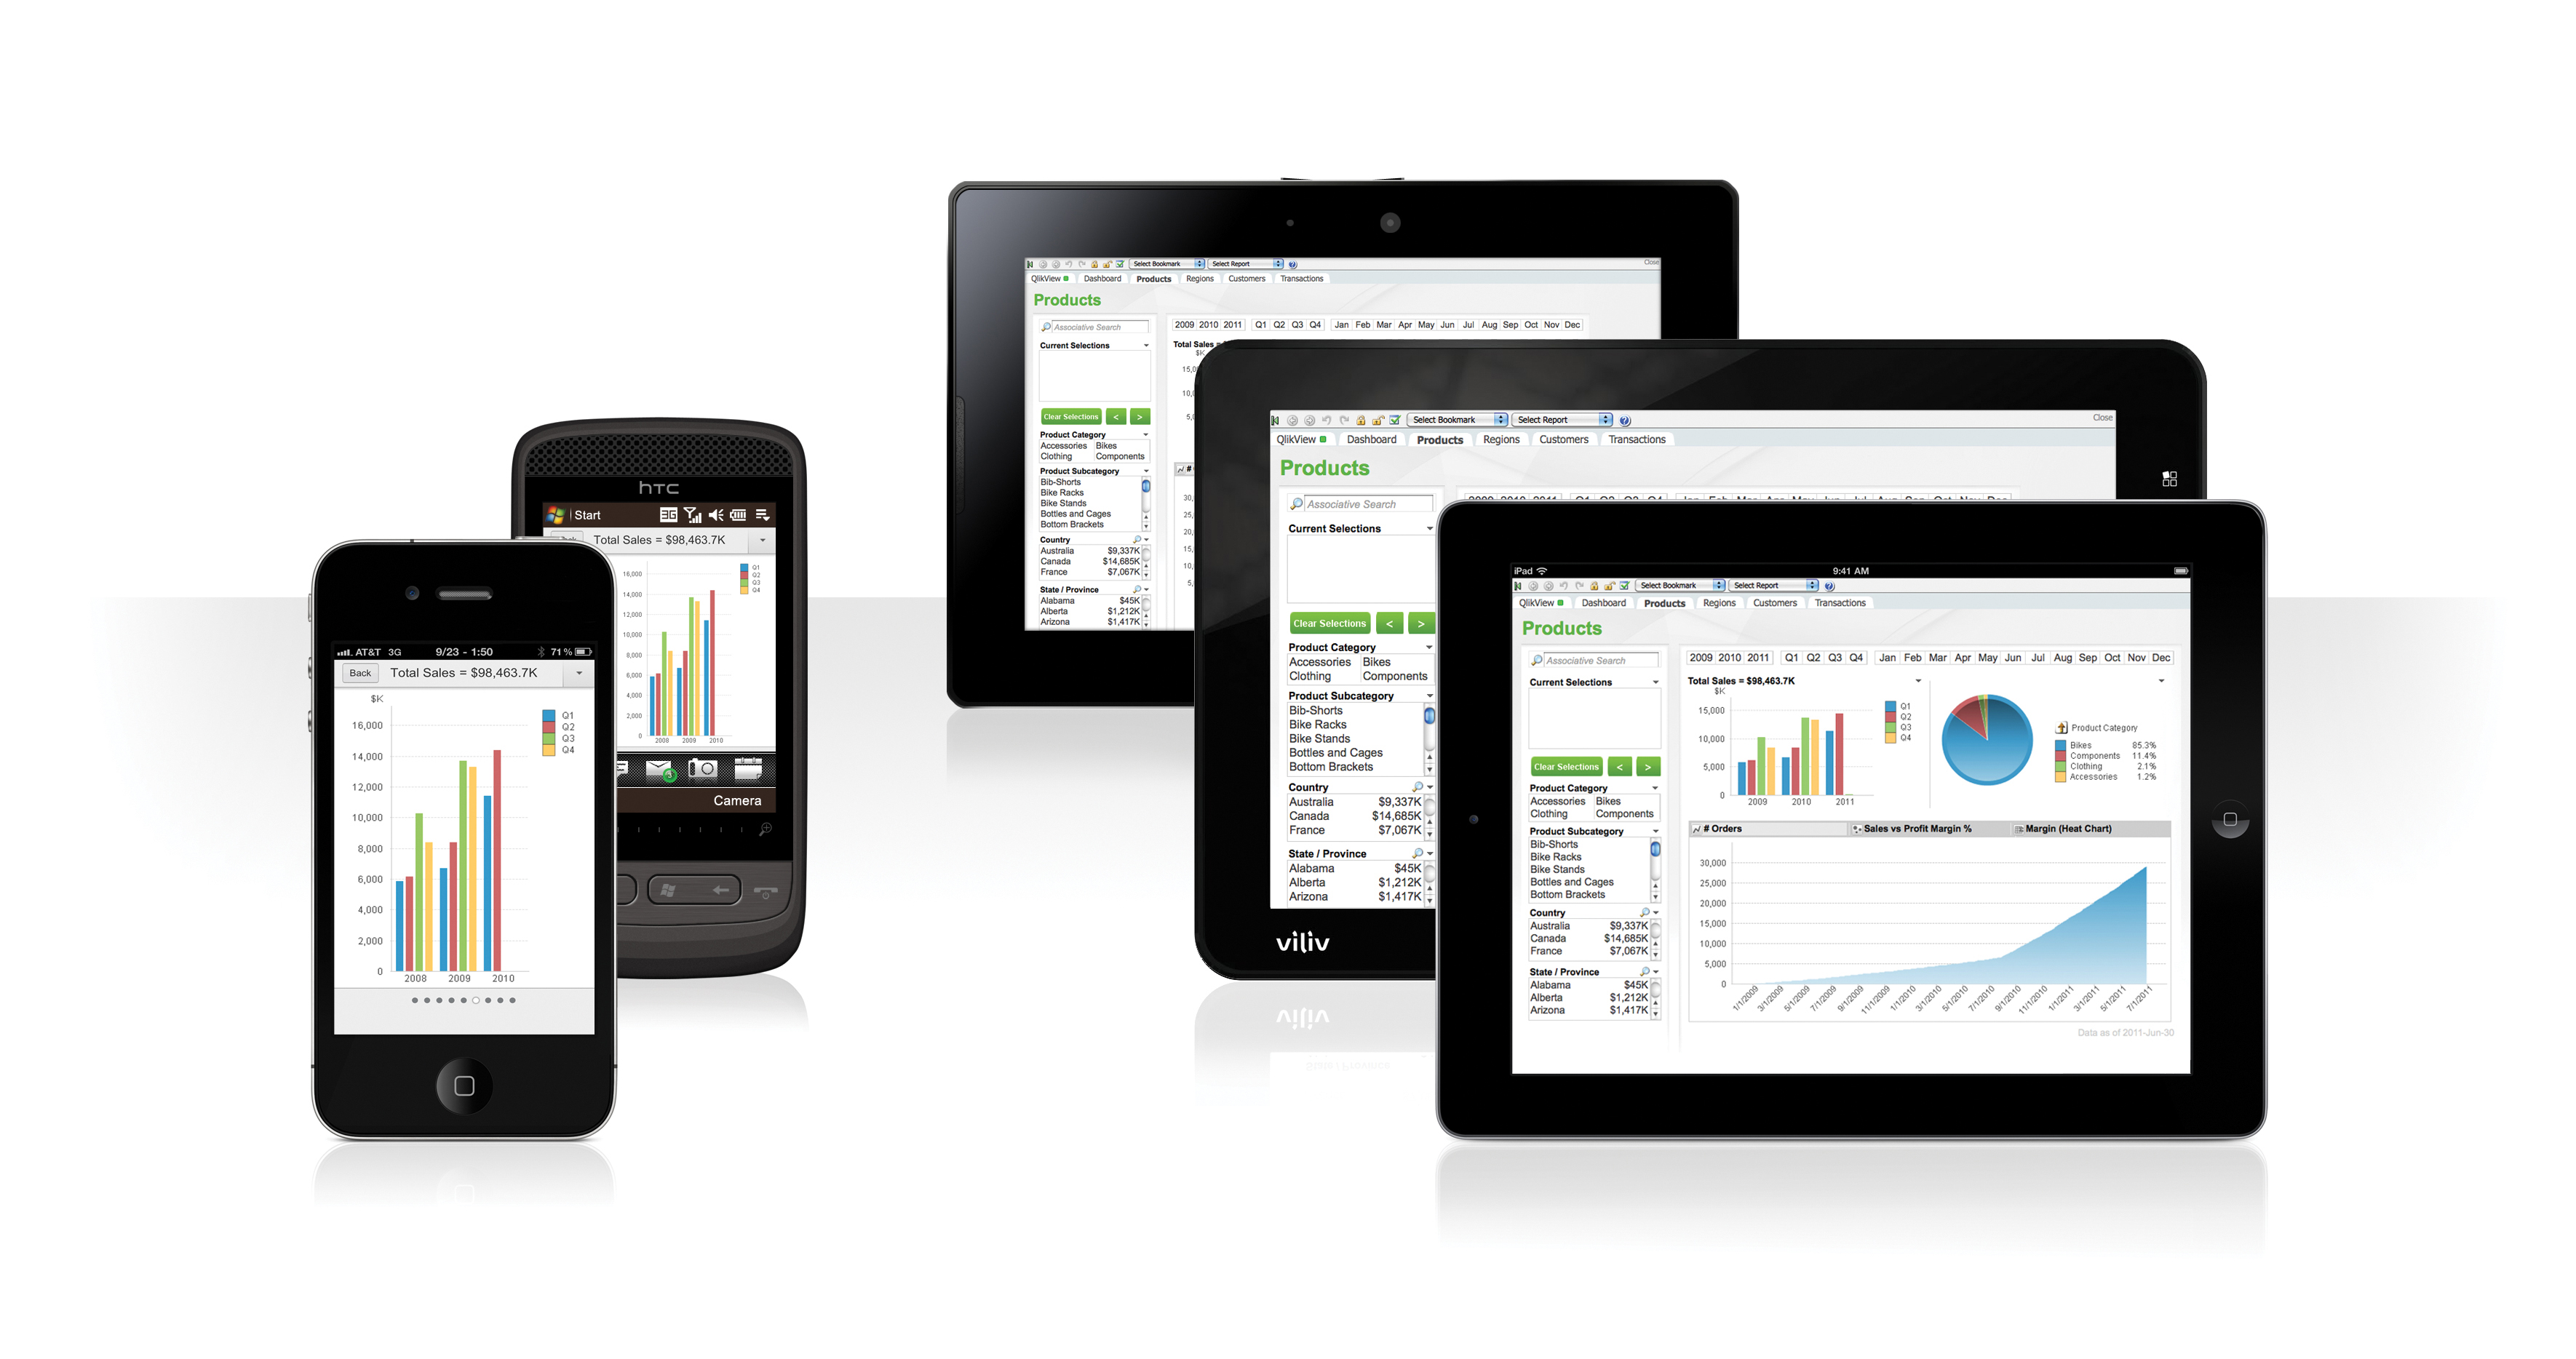
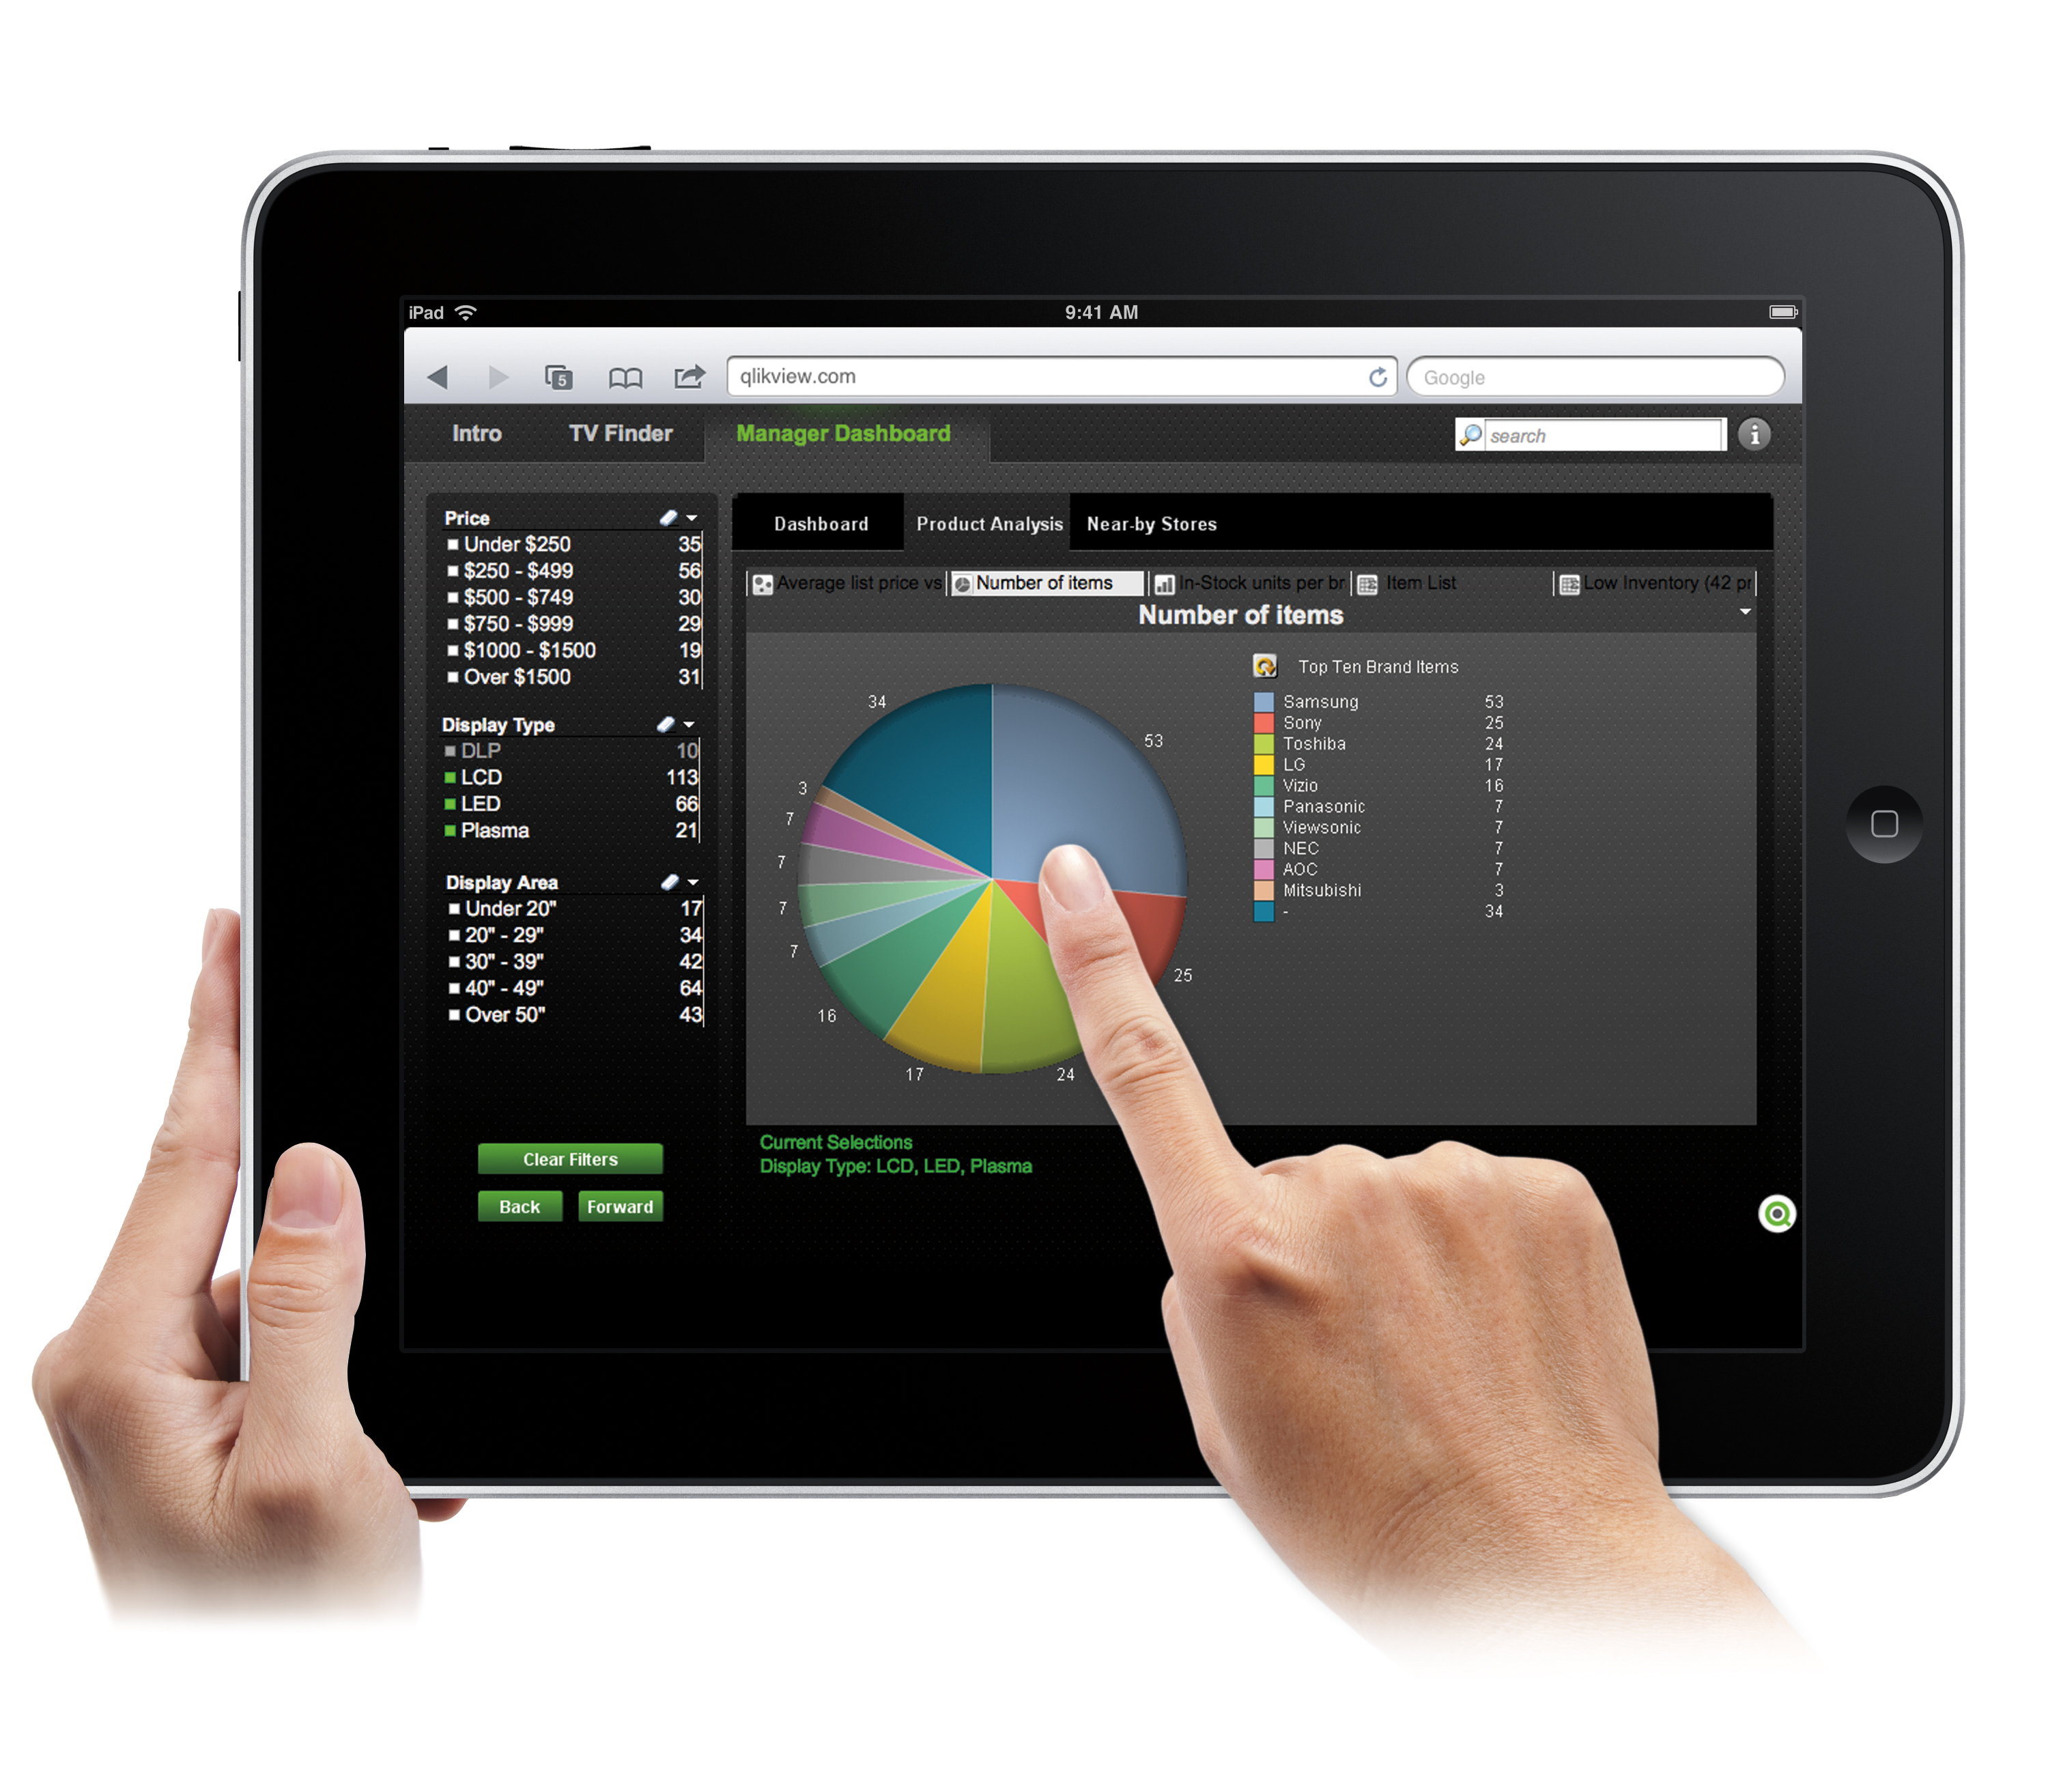
QlikView® is Qlik®’s original BI offering designed primarily for shared business intelligence reports and data visualizations. It offers guided exploration and discovery, collaborative analytics for sharing insight, and agile development and deployment.
N/A
Roambi (discontinued)
Score 7.9 out of 10
N/A
Roambi was a cloud-based solution designed specifically for mobile data consumers, used to create touch-based data visualizations. It was acquired by SAP in 2016 for the SAP Analytics portfolio, and has since been discontinued as a standalone product.
$10
per user per month
Pricing
QlikView
Roambi (discontinued)
Editions & Modules
QlikView
Custom
per user
Starter
$10
per user per month
Business
$39
per user per month
Enterprise
$59
per user per month
Offerings
Pricing Offerings
QlikView
Roambi (discontinued)
Free Trial
Yes
Yes
Free/Freemium Version
No
No
Premium Consulting/Integration Services
No
No
Entry-level Setup Fee
Optional
No setup fee
Additional Details
On an perpetual license basis, based on server plus number of users.
Contact vendor for pricing.
—
More Pricing Information
Community Pulse
QlikView
Roambi (discontinued)
Features
QlikView
Roambi (discontinued)
BI Standard Reporting
Comparison of BI Standard Reporting features of Product A and Product B
QlikView
8.0
Ratings
2% below category average
Roambi (discontinued)
-
Ratings
Pixel Perfect reports
8.10 Ratings
00 Ratings
Customizable dashboards
8.00 Ratings
00 Ratings
Report Formatting Templates
8.00 Ratings
00 Ratings
Ad-hoc Reporting
Comparison of Ad-hoc Reporting features of Product A and Product B
QlikView
8.3
Ratings
3% above category average
Roambi (discontinued)
-
Ratings
Drill-down analysis
9.00 Ratings
00 Ratings
Formatting capabilities
7.00 Ratings
00 Ratings
Integration with R or other statistical packages
8.30 Ratings
00 Ratings
Report sharing and collaboration
9.00 Ratings
00 Ratings
Report Output and Scheduling
Comparison of Report Output and Scheduling features of Product A and Product B
QlikView
7.9
Ratings
5% below category average
Roambi (discontinued)
9.0
Ratings
6% above category average
Publish to Web
8.00 Ratings
9.00 Ratings
Publish to PDF
9.00 Ratings
00 Ratings
Report Versioning
7.50 Ratings
00 Ratings
Report Delivery Scheduling
7.30 Ratings
00 Ratings
Data Discovery and Visualization
Comparison of Data Discovery and Visualization features of Product A and Product B
Sales data validations have helped manage our justifications in the past, especially with regard to new product development and new business introduction. It has also been helpful in identifying trends with business impact and direction specific to quarter and monthly sales from ERP data as well as decisions to purchase equipment of staffing based on run rates and product demand.
One thing that can get out of hand is data output - if you aren't careful in your query, you may be overloaded with data dumps and drown in the amount of info you have to filter through. This is a user caution, not a comment on the software itself.
I would recommend Roambi for its ease-of-use and quick deployment. It is very visually rich and eye-catching, and I believe it is best suited for presenting business & finance dashboard to C-level management and sales representatives in the field. Because it can be accessed on the iPhone or iPad, it is very mobile and the Apple touch interfaces are nearly flawless. If an organization needs to really dig deep into their data, I would look elsewhere, as Roambi has certain limitations.
We found that QlikView can be a bit slow in supporting some forms of encryption. It is web-based and we needed to upgrade all of our server to not support the older SSL and TLS 1 protocols, only support TLS 1.2 and TLS 1.3. However, QlikView could not run with TLS 1.2 and TLS 1.3. We had to wait over six months to get a version that would handle the newer TLS versions.
There are so many options with QlikView that you can get lost when developing a visualization. There are still items I have not yet figured out, such as labeling a graph with the name of a selected detail item.
QlikView works by pulling the data it is going to use for visualization into its database. I am a security reviewer and I need to make certain that PII and PHI is not pulled by QlikView for a visualization, otherwise this could become a reportable indecent.
The system that performs the rendering of data to the front-end can be improved to intelligently read the back end data template or at least the layout. Inserting new rows/columns of data completely messes up the rendering on the front end and the process of re-selecting information to ensure proper rendering is a very tedious one.
Also, Roambi should have the capability to analyse information in formats other than excel such as word, ppts and/or pdfs. I found the lack of this capability a major hurdle because each time I had to export information into excel to render into a template.
Ease of use, ability to load from pretty much any data source. today I created an application that loaded time sheets from excel that are not in a table format. With Qlik's "enable transformation steps" I was able to automate loads of multiple spreadsheets and multiple tabs easily. Could not do that with any other tool.
The only reason we would not renew is if there is something out there that is less expensive that is cross-platform for mobile devices. Our clients are no longer exclusively using iOS, so in order to keep their business, we need to change with them.
I do think there is a steep learning curve to the program and that it requires a high level of experience or a data scientist background to fully take advantage and implement dashboards, and users will require ongoing training to maximize ROI, but it is absolutely worth it considering the impact it can make on an organization.
The documentation presented by QlikView is very clear and exact. This makes the process of implementation more easy. If any questions arise while creating the reports it is very easy to access the QlikView documents through the internet. QlikView also has a Qlik Community, full of different questions and answers. This helps a lot to resolve issues even without contacting the support team.
My team attended, but I cannot myself rate, but I think it was good as they've successfully launched a training program at our company themselves for users. It was 3-4 day training.
Training was as expected. The demo environments tend to be more fully featured that our own environment, but the training was clear and well delivered.
It has taken some time to get used to Qlikview and the backend team behind it. From understanding the new regulations on using less images and also pushing for more tools (such as full compatibility on desktop, laptop, ipad, phone). We were given training on this and have helpful tips to find analytics behind Qlikview but it is very much also a learn as you implement system.
With QlikView and Qlik Sense the users can answer their own questions more interactively. They also can build their own visualizations without waiting [for] someone from IT to create a new report. The users can navigate through the data finding out relevant information. Through QlikView color code, users can get aware of the relationship between the different data points.
Comparing the mobile capabilities of both products - as of course, Tibco Spotfire is a complete solution whereas Roambi focuses on mobility. While some would argue that the ten View (template) limitation of Roambi works in favor of competitors, we have found this to be untrue. Users quickly get used to this native interfaces, which are found across the templates. Additionally, the ten available Views cover 99% of the types of reports or insights you'd ever need. If this is not the case, are you sure you are asking the right questions?
Speed to market is the really big thing. You can attach to multiple data sources quickly and build a consumable model for a dashboard. It doesn’t require IT talent to build. We have built more dashboards and added more users in the last year, then in our entire history. I was at a company of 30k+ employees before, and we didn't have near this level of BI adoption.
As a result, we are seeing benefits across business function. For example, within sales, our pipeline has much more visibility. It allows for much faster decisions on things like quotas. One of our biggest power users is in sales ops. She feels her dashboards load 10x faster than our previous tool and she can make changes on the fly.
and any analytical tool needs more historical data for accurate analysis, in that case, roambi 's part is as a presenter can't influence the ROI exactly..
overall objective its a value addition for sap based data analytics and others as well.
for CIO or analytics people good tool to convince their business users and executives.