Chose Qlik Sense
We use both Qlik Sense and QlikView. Both bring valué. However, due to simpler development Qlik Sense is the main tool.

| Product | Rating | Most Used By | Product Summary | Starting Price |
|---|---|---|---|---|
 Qlik Sense | N/A | Qlik Sense® is a self-service BI platform for data discovery and visualization. It supports a full range of analytics use cases—data governance, pixel-perfect reporting, and collaboration. Its Associative Engine indexes and connects relationships between data points for creating actionable insights. | $200 per month | |
 Zendesk Explore | N/A | Zendesk offers Explore, a business intelligence and customer analytics tool which integrates with the Zendesk suite featuring ticket analytics, custom fields, dashboards, and other features. Zendesk is migrating customers of the BIME analytics product, which is approaching end of support, to Zendesk Explore in 2019. | N/A |
| Qlik Sense | Zendesk Explore | |||||||||||||||
|---|---|---|---|---|---|---|---|---|---|---|---|---|---|---|---|---|
| Editions & Modules |
| No answers on this topic | ||||||||||||||
| Offerings |
| |||||||||||||||
| Entry-level Setup Fee | No setup fee | No setup fee | ||||||||||||||
| Additional Details | — | — | ||||||||||||||
| More Pricing Information | ||||||||||||||||
| Qlik Sense | Zendesk Explore | |
|---|---|---|
| Considered Both Products | Qlik Sense  Manjul Malhotra Product Consultant Chose Qlik Sense Qlik Sense cost of licensing is cheaper compared with other tools which always gives an upper edge in analytics industry with good functionality. More enhanced level of security with better user community group available to discuss about new updates. Understanding of Qlik Sense …  Murilo Fernandes BI Analyst and Automation Chose Qlik Sense We use Microsoft Power BI too as a BI tool, in my point of view, Qlik Sense's ETL is much better than PowerBi. In another side, PowerBI learning curve is small than Qlik Sense, especially the PowerBI Desktop.  Fabricio Velasco Demand Generation Manager Chose Qlik Sense Sometimes as competing solutions, other times as completing one another.  Lucy Daniell Senior Business Analyst Chose Qlik Sense The customization of the platform opens up plenty of other options depending on the use cases. The API layer is incredibly rich and makes integration of Qlik based visualization into web pages a simple and effective pattern. It's been very easy to use with a great community …  Edgar Olmos Ascanio Intelligence Data Manager Chose Qlik Sense Qlik Sense is a fast tool to implement; you can have a functional dashboard in a few days, and the ETL processes are quite easy to build it. You can have the ROI in a short period of time.  Anjum Arora Group ICT Head - Technology & Applications Chose Qlik Sense Qlik Sense comes out as a superior product as well as more cost efficient than some of the other products we evaluated as a part of our Enterprise Business Intelligence stack. It offers unified view of our data and extensibility. Qlik Sense being the most interactive …  Jeanine Willig Program Analyst Chose Qlik Sense using it because my organization has purchased it.  Silvia Guardini Manager Chose Qlik Sense Qlik Sense is one of the best reporting systems. It is stronger than PBI and Tableau when speaking about complex KPIs. It is really similar to Microstrategy Analytics when you speak about obtained results, but it is easier to use, especially as it is more code-based. But is it …  Sam Joseph Gomez Sr. Data Analyst Chose Qlik Sense Qlik Sense can easily integrate multiple data models to
visualize customer data. Tableau is easy to use—perhaps more manageable than Qlik—but
expensive. Microsoft BI was chosen because it was similar to previously used  Richard Stables Information and Support Manager Chose Qlik Sense We originally went with Qlik Sense because the desktop version used to be free for single users and was a very good proposition for us (we are a non-profit with a limited budget). However, from what I see, the functionality is comparable, and Qlik Sense stacks up well.  Angel Monjarás CIO (Chief Information Officer) Chose Qlik Sense As soon as you want to pull data from two or more separate tables, Qlik Sense leaves the rest in the dust, since it does not require joins or complex transformations. Zoho CRM analytics are limited to the data located in the product itself. No external tables can be combined. | Zendesk Explore  Max César Director of Global Support Operations Chose Zendesk Explore I selected Zendesk Explore only to provide an easy and quick access for my managers and supervisors regading metrics and volume trends. Is not the most flexible nor complete data visualization tool, but works well for day-to-day follow ups. You need to use another tool if you …  Julie Pinto Support Manager Chose Zendesk Explore For support data, we have only used Explore because it came with our ZenDesk membership. So I can't speak to other solutions! That said, it's awesome to have Knowledge Base and support data in one place. |
| Qlik Sense | Zendesk Explore | |||||||||||||||||||||
|---|---|---|---|---|---|---|---|---|---|---|---|---|---|---|---|---|---|---|---|---|---|---|
| BI Standard Reporting |
| |||||||||||||||||||||
| Ad-hoc Reporting |
| |||||||||||||||||||||
| Report Output and Scheduling |
| |||||||||||||||||||||
| Data Discovery and Visualization |
| |||||||||||||||||||||
| Access Control and Security |
| |||||||||||||||||||||
| Mobile Capabilities |
| |||||||||||||||||||||
| Application Program Interfaces (APIs) / Embedding |
|
| Qlik Sense | Zendesk Explore | |
|---|---|---|
| Small Businesses |  BrightGauge Score 9.1 out of 10 | BrightGauge Score 9.1 out of 10 |
| Medium-sized Companies |  Reveal Score 10.0 out of 10 | Reveal Score 10.0 out of 10 |
| Enterprises |  Kyvos Semantic Intelligence Layer Score 9.9 out of 10 | Kyvos Semantic Intelligence Layer Score 9.9 out of 10 |
| All Alternatives | View all alternatives | View all alternatives |
| Qlik Sense | Zendesk Explore | |
|---|---|---|
| Likelihood to Recommend | 8.5 (0 ratings) | 9.5 (0 ratings) |
| Likelihood to Renew | 8.4 (0 ratings) | - (0 ratings) |
| Usability | 8.0 (0 ratings) | 10.0 (0 ratings) |
| Support Rating | 7.3 (0 ratings) | 10.0 (0 ratings) |
| In-Person Training | 9.1 (0 ratings) | - (0 ratings) |
| Online Training | 9.1 (0 ratings) | - (0 ratings) |
| Implementation Rating | 7.3 (0 ratings) | - (0 ratings) |
| Vendor post-sale | 9.1 (0 ratings) | - (0 ratings) |
| Vendor pre-sale | 9.1 (0 ratings) | - (0 ratings) |
| Qlik Sense | Zendesk Explore | |
|---|---|---|
| Likelihood to Recommend |
 Gustavo Figueroa IT Developer / Engineer |
|
| Pros |
Anjum Arora Group ICT Head - Technology & Applications |
|
| Cons |
|
|
| Likelihood to Renew |
| No answers on this topic |
| Usability |
Manjul Malhotra Product Consultant |
|
| Support Rating |
|
|
| In-Person Training |
| No answers on this topic |
| Online Training |
| No answers on this topic |
| Implementation Rating |
 Mohan Suswaram Enterprise Data Architect | No answers on this topic |
| Alternatives Considered |
Lucy Daniell Senior Business Analyst |
|
| Return on Investment |
 Victor Ramirez Benitez Sales Support Team Leader Arg |
Max César Director of Global Support Operations |
| ScreenShots | Qlik Sense Screenshots   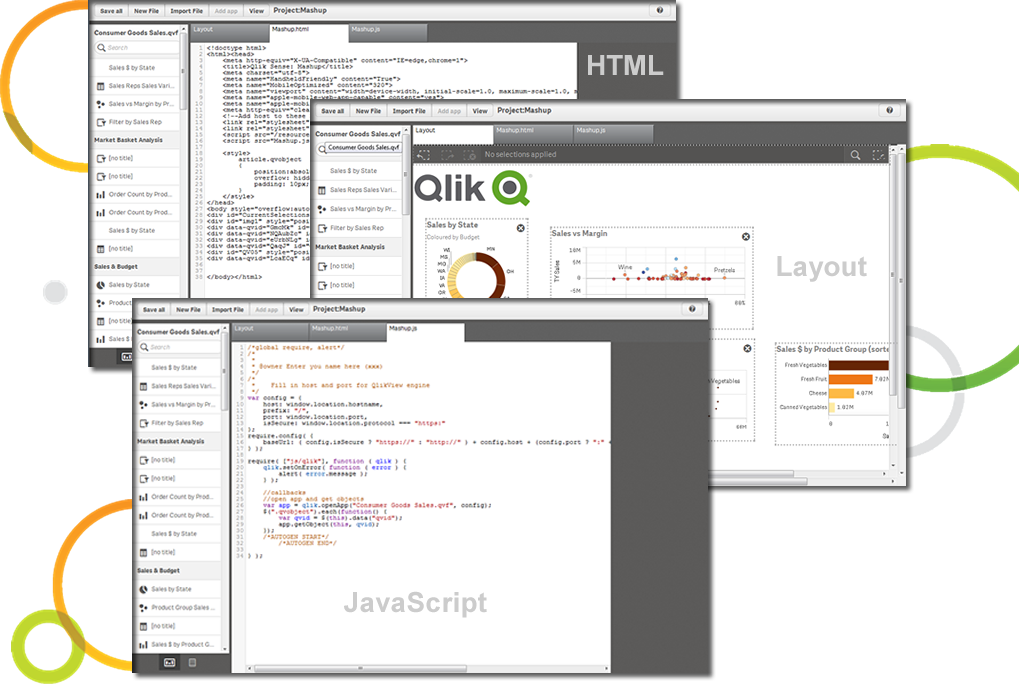   |