Qlik Sense® is a self-service BI platform for data discovery and visualization. It supports a full range of analytics use cases—data governance, pixel-perfect reporting, and collaboration. Its Associative Engine indexes and connects relationships between data points for creating actionable insights.
$200
per month
Tableau Desktop
Score8.1 out of 10
N/A
Tableau Desktop is a data visualization product from Tableau. It connects to a variety of data sources for combining disparate data sources without coding. It provides tools for discovering patterns and insights, data calculations, forecasts, and statistical summaries and visual storytelling.
Manager in Information Technology at SDG Group Italy (Information Technology & Services, 201-500 employees)
Chose Qlik Sense
Qlik Sense is one of the best reporting systems. It is stronger than PBI and Tableau when speaking about complex KPIs. It is really similar to MicroStrategy Analytics when you speak about obtained results, but it is easier to use, especially as it is more code-based. But is it …
A de minimis incentive was given to thank the reviewer for their time. The incentive was not used to bias or drive a particular response, nor was the incentive contingent on a positive endorsement. TR verified that a representative sample of customers was invited. More Info
Sr. Data Analyst in Information Technology at Cramstack Ltd (Computer Software, 11-50 employees)
Chose Qlik Sense
Qlik Sense can easily integrate multiple data models to
visualize customer data. Tableau is easy to use—perhaps more manageable than Qlik—but
expensive. Microsoft BI was chosen because it was similar to previously used
A de minimis incentive was given to thank the reviewer for their time. The incentive was not used to bias or drive a particular response, nor was the incentive contingent on a positive endorsement. More Info
Verified User
Chose Qlik Sense
When it comes to working with large datasets out of the box, Qlik in my opinion is unrivaled amongst the competitor. However, the overall user experience and customization options available to developers require a lot of work. When compared to other options on the market, …
A de minimis incentive was given to thank the reviewer for their time. The incentive was not used to bias or drive a particular response, nor was the incentive contingent on a positive endorsement. TR verified that a representative sample of customers was invited. More Info
A de minimis incentive was given to thank the reviewer for their time. The incentive was not used to bias or drive a particular response, nor was the incentive contingent on a positive endorsement. More Info
IT Service Manager BI in Information Technology at COFCO International (Logistics & Supply Chain, 10,001+ employees)
Chose Qlik Sense
Qlik Sense, Tableau, Power BI and Looker are all great tools that will cover and add value to virtually every organization. They are a bit different and the decision of selecting one and not other can reside in the particular needs of each case. Qlik Sense integration with …
A de minimis incentive was given to thank the reviewer for their time. The incentive was not used to bias or drive a particular response, nor was the incentive contingent on a positive endorsement. More Info
Product Consultant in Product Management at Flipkart (Consumer Goods, 10,001+ employees)
Chose Qlik Sense
Qlik Sense cost of licensing is cheaper compared with other tools which always gives an upper edge in analytics industry with good functionality. More enhanced level of security with better user community group available to discuss about new updates. Understanding of Qlik Sense …
A de minimis incentive was given to thank the reviewer for their time. The incentive was not used to bias or drive a particular response, nor was the incentive contingent on a positive endorsement. More Info
A de minimis incentive was given to thank the reviewer for their time. The incentive was not used to bias or drive a particular response, nor was the incentive contingent on a positive endorsement. More Info
Verified User
Chose Qlik Sense
Both are good data visualisation platforms; with certain applications where one is better than the other
A de minimis incentive was given to thank the reviewer for their time. The incentive was not used to bias or drive a particular response, nor was the incentive contingent on a positive endorsement. More Info
Group ICT Head - Technology & Applications in Information Technology at East-West Seed (Horticulture, 1001-5000 employees)
Chose Qlik Sense
Qlik Sense comes out as a superior product as well as more cost efficient than some of the other products we evaluated as a part of our Enterprise Business Intelligence stack. It offers unified view of our data and extensibility. Qlik Sense being the most interactive …
A de minimis incentive was given to thank the reviewer for their time. The incentive was not used to bias or drive a particular response, nor was the incentive contingent on a positive endorsement. More Info
Verified User
Chose Qlik Sense
Qlik Sense is relatively cheaper and more futuristic
A de minimis incentive was given to thank the reviewer for their time. The incentive was not used to bias or drive a particular response, nor was the incentive contingent on a positive endorsement. More Info
Information and Support Manager at Headway Ireland - Brain Injury Services and Support (Non-profit Organization Management, 51-200 employees)
Chose Qlik Sense
We originally went with Qlik Sense because the desktop version used to be free for single users and was a very good proposition for us (we are a non-profit with a limited budget). However, from what I see, the functionality is comparable, and Qlik Sense stacks up well.
A de minimis incentive was given to thank the reviewer for their time. The incentive was not used to bias or drive a particular response, nor was the incentive contingent on a positive endorsement. More Info
CIO (Chief Information Officer) in Information Technology at UVA Y MALTA (Food & Beverages, 1-10 employees)
Chose Qlik Sense
As soon as you want to pull data from two or more separate tables, Qlik Sense leaves the rest in the dust, since it does not require joins or complex transformations. Zoho CRM analytics are limited to the data located in the product itself. No external tables can be combined.
A de minimis incentive was given to thank the reviewer for their time. The incentive was not used to bias or drive a particular response, nor was the incentive contingent on a positive endorsement. More Info
Verified User
Chose Qlik Sense
Other tools were not able to handle complex business requirements and performance was not too good with very huge volume data. we were required to maintain history, time-based data backups, and snapshots. Also, some of the tools were too costly compare to Qlik [Sense] solutions.
A de minimis incentive was given to thank the reviewer for their time. The incentive was not used to bias or drive a particular response, nor was the incentive contingent on a positive endorsement. More Info
Verified User
Chose Qlik Sense
We thought we were getting a good (financial) deal. We had internal resources who were already familiar with Qlik.
A de minimis incentive was given to thank the reviewer for their time. The incentive was not used to bias or drive a particular response, nor was the incentive contingent on a positive endorsement. TR verified that a representative sample of customers was invited. More Info
Verified User
Chose Qlik Sense
I prefer Qlik due to its ability to combine multiple data sources and flexibility offer by the data load editor, other tools lack this capability or they don't do as good of a job as Qlik
A de minimis incentive was given to thank the reviewer for their time. The incentive was not used to bias or drive a particular response, nor was the incentive contingent on a positive endorsement. TR verified that a representative sample of customers was invited. More Info
A de minimis incentive was given to thank the reviewer for their time. The incentive was not used to bias or drive a particular response, nor was the incentive contingent on a positive endorsement. More Info
Verified User
Chose Qlik Sense
Qlik Sense offers the most flexible and deepest data modelling compared to many other competitors. The scripting language offers a ton of options which allow us to manipulate complex data scenarios. The scripting is robust and is something missing from many competitors. The …
A de minimis incentive was given to thank the reviewer for their time. The incentive was not used to bias or drive a particular response, nor was the incentive contingent on a positive endorsement. More Info
A de minimis incentive was given to thank the reviewer for their time. The incentive was not used to bias or drive a particular response, nor was the incentive contingent on a positive endorsement. More Info
Verified User
Chose Qlik Sense
QlikView has many more options for styling within charts and objects - this hurts our ability to style things to our needs within Qlik Sense. Qlik Sense looks more modern, responsive for browser size and visually more appealing.
A de minimis incentive was given to thank the reviewer for their time. The incentive was not used to bias or drive a particular response, nor was the incentive contingent on a positive endorsement. More Info
IT Analyst in Information Technology at Tata Consultancy Services (Information Technology & Services, 10,001+ employees)
Chose Qlik Sense
We have used different BI Reporting tools, but overall, Qlik Sense [has been used longer]. Customers are really happy with the dashboards we made through Qlik Sense.
A de minimis incentive was given to thank the reviewer for their time. The incentive was not used to bias or drive a particular response, nor was the incentive contingent on a positive endorsement. More Info
Account Manager in Information Technology at Channelplay Limited (Information Technology & Services, 10,001+ employees)
Chose Qlik Sense
Qlik Sense has the ability to handle huge data and the data loading and performing analytics on huge data [is] a plus as compared to other tools in the market. Qlik Sense ability to integrate open-source tools is the best compared to other tools in market.
A de minimis incentive was given to thank the reviewer for their time. The incentive was not used to bias or drive a particular response, nor was the incentive contingent on a positive endorsement. More Info
Director of HR Analytics and Artificial Intelligence in Human Resources at Aramark (Food & Beverages, 10,001+ employees)
Chose Qlik Sense
Qlik was selected before I arrived and I would not select it again in comparison to any of the alternatives I've worked with, unless that was the enterprise mandate.
A de minimis incentive was given to thank the reviewer for their time. The incentive was not used to bias or drive a particular response, nor was the incentive contingent on a positive endorsement. More Info
A de minimis incentive was given to thank the reviewer for their time. The incentive was not used to bias or drive a particular response, nor was the incentive contingent on a positive endorsement. More Info
Verified User
Chose Qlik Sense
Qlik Sense has better GUI and capability to store the data in compressed format.
A de minimis incentive was given to thank the reviewer for their time. The incentive was not used to bias or drive a particular response, nor was the incentive contingent on a positive endorsement. More Info
A de minimis incentive was given to thank the reviewer for their time. The incentive was not used to bias or drive a particular response, nor was the incentive contingent on a positive endorsement. More Info
Tableau
Verified User
Chose Tableau Desktop
Pentaho has fewer visualizations and they haven't been making a lot of improvements in their visualization space. You can't really add a lot of customized visualizations as well. If Tableau has 100 features then Pentaho Analyzer has 10 with no ray of hope for improvements. …
A de minimis incentive was given to thank the reviewer for their time. The incentive was not used to bias or drive a particular response, nor was the incentive contingent on a positive endorsement. More Info
A de minimis incentive was given to thank the reviewer for their time. The incentive was not used to bias or drive a particular response, nor was the incentive contingent on a positive endorsement. More Info
Verified User
Chose Tableau Desktop
It has a better user interface compared to Microsoft Power BI. The Tableau integration process is quite simple and clear with the third-party application whereas Power BI is not easily integrated with other tools and requires a complex process to follow for integration. DAX …
A de minimis incentive was given to thank the reviewer for their time. The incentive was not used to bias or drive a particular response, nor was the incentive contingent on a positive endorsement. More Info
Data analyst in Information Technology at OnlineSales.ai (Information Technology & Services, 51-200 employees)
Chose Tableau Desktop
Tableau can create visually attractive customizable dashboards than can quickly by drag-drop while in power bi we can create simple dashboard. Power bi support lesser data source while in Tableau there is a lot of options When we talk about data handling tableau is a clear …
A de minimis incentive was given to thank the reviewer for their time. The incentive was not used to bias or drive a particular response, nor was the incentive contingent on a positive endorsement. More Info
Verified User
Chose Tableau Desktop
We have chosen Tableau [Desktop] for its ability to extract live information from any data source, for its simplicity and simplicity that it has a very short learning curve.
A de minimis incentive was given to thank the reviewer for their time. The incentive was not used to bias or drive a particular response, nor was the incentive contingent on a positive endorsement. More Info
Verified User
Chose Tableau Desktop
Tableau is much easier and more sophisticated and well though-out.
A de minimis incentive was given to thank the reviewer for their time. The incentive was not used to bias or drive a particular response, nor was the incentive contingent on a positive endorsement. More Info
Senior Team Lead in Information Technology at Wipro Limited (Information Technology and Services, 10,001+ employees)
Chose Tableau Desktop
Tableau Desktop is the market leader when it comes to creating interactive and appealing graphs and charts. The beauty of the tool is that is can work with almost any kind of back-end source and in real-time take the data and present you with an amazing insight based on the …
A de minimis incentive was given to thank the reviewer for their time. The incentive was not used to bias or drive a particular response, nor was the incentive contingent on a positive endorsement. More Info
Senior Analyst, Fraud Data Science & Analytics in Finance and Accounting at RBC (Banking, 10,001+ employees)
Chose Tableau Desktop
Excel has better-embedded coding functions, such as VBA developing environment, but cannot publish reports to an online portal and has limited visualization function. QlikView has fewer online resources and a small community to help you solve problems.
A de minimis incentive was given to thank the reviewer for their time. The incentive was not used to bias or drive a particular response, nor was the incentive contingent on a positive endorsement. More Info
Consultant in Information Technology at WNS Global Services (Outsourcing/Offshoring, 10,001+ employees)
Chose Tableau Desktop
It is very easy to use, we can create numbers of charts through it which I think other tools lack in. Lots of online communities are there which have provided solutions to the basic issues. Its ODS(output delivery system) is also very effective. We can use SQL in it for …
A de minimis incentive was given to thank the reviewer for their time. The incentive was not used to bias or drive a particular response, nor was the incentive contingent on a positive endorsement. More Info
A de minimis incentive was given to thank the reviewer for their time. The incentive was not used to bias or drive a particular response, nor was the incentive contingent on a positive endorsement. TR verified that a representative sample of customers was invited. More Info
A de minimis incentive was given to thank the reviewer for their time. The incentive was not used to bias or drive a particular response, nor was the incentive contingent on a positive endorsement. More Info
Verified User
Chose Tableau Desktop
Tableau Desktop is powerful in terms of data sources and dashboarding creation. You can customize and fine-tune your graphics (color, size, text, tooltips and so on). You can make calculations on measures and dimensions. It's also has a cool geocoding function and maps layers.
A de minimis incentive was given to thank the reviewer for their time. The incentive was not used to bias or drive a particular response, nor was the incentive contingent on a positive endorsement. More Info
Verified User
Chose Tableau Desktop
Qlick is a good tool too but when handling more than 5G of data you better have a strong machine. Tibco is good too, but the business model doesn't suit us.
A de minimis incentive was given to thank the reviewer for their time. The incentive was not used to bias or drive a particular response, nor was the incentive contingent on a positive endorsement. More Info
A de minimis incentive was given to thank the reviewer for their time. The incentive was not used to bias or drive a particular response, nor was the incentive contingent on a positive endorsement. More Info
Qlik Sense is a program whose purpose is to greatly improve all your operations and use of all data in an organic way. The mission will always be to increase the economic and commercial processes of the company in a short time. I recommended it for its high technology, which was Created for this area, the results are successful. We have noticed how it has increased relationships with our clients thanks to the credibility and security that we provide.
A de minimis incentive was given to thank the reviewer for their time. The incentive was not used to bias or drive a particular response, nor was the incentive contingent on a positive endorsement. More Info
The best scenario is definitely to collect data from several sources and create dedicated dashboards for specific recipients. However, I miss the possibility of explaining these reports in more detail. Sometimes, we order a report, and after half a year, we don't remember the meaning of some data (I know it's our fault as an organization, but the tool could force better practices).
A de minimis incentive was given to thank the reviewer for their time. The incentive was not used to bias or drive a particular response, nor was the incentive contingent on a positive endorsement. More Info
A de minimis incentive was given to thank the reviewer for their time. The incentive was not used to bias or drive a particular response, nor was the incentive contingent on a positive endorsement. More Info
An excellent tool for data visualization, it presents information in an appealing visual format—an exceptional platform for storing and analyzing data in any size organization.
Through interactive parameters, it enables real-time interaction with the user and is easy to learn and get support from the community.
A de minimis incentive was given to thank the reviewer for their time. The incentive was not used to bias or drive a particular response, nor was the incentive contingent on a positive endorsement. More Info
A de minimis incentive was given to thank the reviewer for their time. The incentive was not used to bias or drive a particular response, nor was the incentive contingent on a positive endorsement. More Info
Qlik Sense is a constantly improving it's software and working with its' users to make it better. They are great at keeping their users informed of progress and care about delivering a quality product
A de minimis incentive was given to thank the reviewer for their time. The incentive was not used to bias or drive a particular response, nor was the incentive contingent on a positive endorsement. TR verified that a representative sample of customers was invited. More Info
Qlik Sense has a better and easy to learn user interface compared with other analytics tool which always help us to create regular and adhoc reports within the stipulated time frame and can be easily refreshed at a scheduled time and sent to multiple stakeholders for timely update regarding the Key metrics indicator.
A de minimis incentive was given to thank the reviewer for their time. The incentive was not used to bias or drive a particular response, nor was the incentive contingent on a positive endorsement. More Info
Tableau Desktop has proven to be a lifesaver in many situations. Once we've completed the initial setup, it's simple to use. It has all of the features we need to quickly and efficiently synthesize our data. Tableau Desktop has advanced capabilities to improve our company's data structure and enable self-service for our employees.
When used as a stand-alone tool, Tableau Desktop has unlimited uptime, which is always nice. When used in conjunction with Tableau Server, this tool has as much uptime as your server admins are willing to give it. All in all, I've never had an issue with Tableau's availability.
It is admittedly hard to train a group of people with disparate levels of ability coming in, but the software is so easy to use that this is not a huge problem; anyone who can follow simple instructions can catch up pretty quickly.
A de minimis incentive was given to thank the reviewer for their time. The incentive was not used to bias or drive a particular response, nor was the incentive contingent on a positive endorsement. More Info
Again, training is the key and the company provides a lot of example videos that will help users discover use cases that will greatly assist their creation of original visualizations. As with any new software tool, productivity will decline for a period. In the case of Tableau, the decline period is short and the later gains are well worth it.
A de minimis incentive was given to thank the reviewer for their time. The incentive was not used to bias or drive a particular response, nor was the incentive contingent on a positive endorsement. More Info
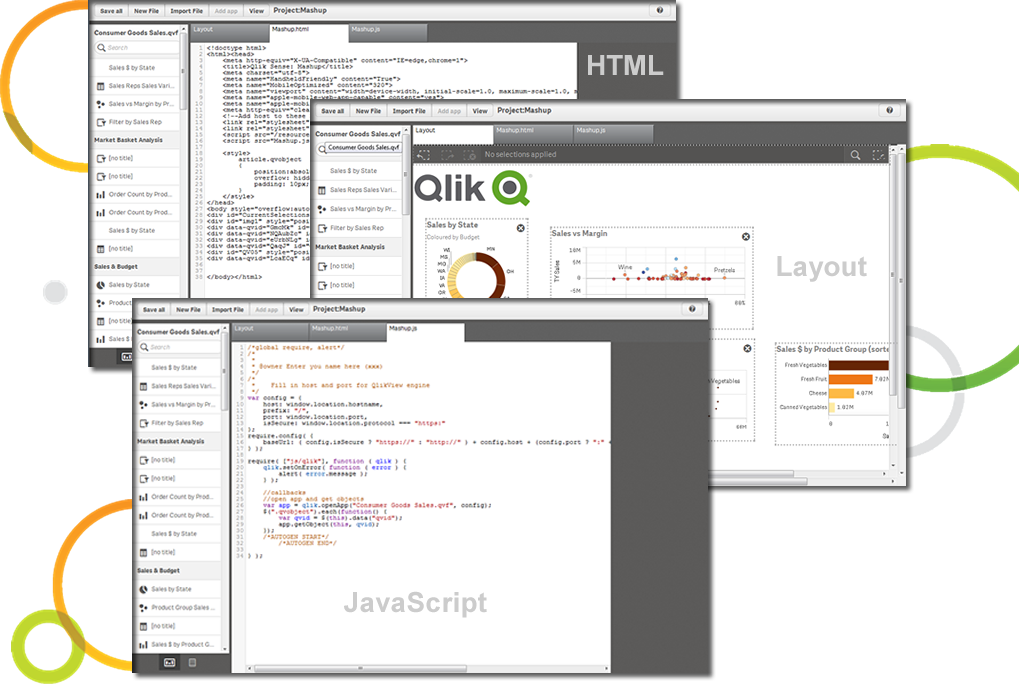
The customization of the platform opens up plenty of other options depending on the use cases. The API layer is incredibly rich and makes integration of Qlik based visualization into web pages a simple and effective pattern. It's been very easy to use with a great community made up of professionals. Qlik Sense has introduces artificial Intelligence into my data visualization and reporting activity.
Tableau was acquired years ago, and has provided good value with the content created.
Ongoing maintenance costs for the platform, both to maintain desktop and server licensing has made the continuing value questionable when compared to other offerings in the marketplace.
Users have largely been satisfied with the content, but not with the overall performance. This is due to a combination of factors including the performance of the Tableau engines as well as development deficiencies.
A de minimis incentive was given to thank the reviewer for their time. The incentive was not used to bias or drive a particular response, nor was the incentive contingent on a positive endorsement. More Info