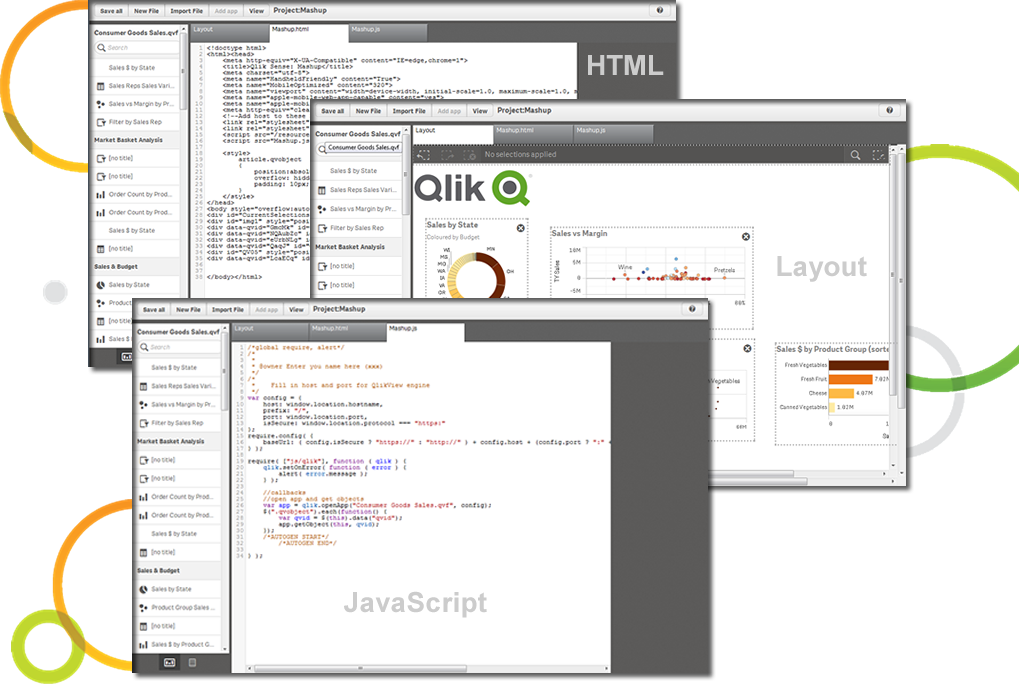
Qlik Sense® is a self-service BI platform for data discovery and visualization. It supports a full range of analytics use cases—data governance, pixel-perfect reporting, and collaboration. Its Associative Engine indexes and connects relationships between data points for creating actionable insights.
$200
per month
Tableau Cloud
Score7.9 out of 10
N/A
Tableau Cloud (formerly Tableau Online) is a self-service analytics platform that is fully hosted in the cloud. Tableau Cloud enables users to publish dashboards and invite colleagues to explore hidden opportunities with interactive visualizations and accurate data, from any browser or mobile device.
Qlik Sense is a program whose purpose is to greatly improve all your operations and use of all data in an organic way. The mission will always be to increase the economic and commercial processes of the company in a short time. I recommended it for its high technology, which was Created for this area, the results are successful. We have noticed how it has increased relationships with our clients thanks to the credibility and security that we provide.
A de minimis incentive was given to thank the reviewer for their time. The incentive was not used to bias or drive a particular response, nor was the incentive contingent on a positive endorsement. More Info
If you're using Tableau as the primary BI tool, then Tableau Cloud is well suited to publish and share the results with a wide(r) audience. It is well suited for various degrees of self-service proficiency, from pure consumers of analytical work to more advanced users who can use web editing for smaller or larger adjustments, and even for desktop power users who will publish their work to Tableau Cloud. It has many good ways to organize the content and make it easily accessible via search, favorites, folders, collections ("playlists for your data"), or history ("recents"). It might not be ideally suited if there are many on-prem sources to be used (even though there are options to connect them) or if you have very special requirements regarding custom server setup, which is limited in a shared cloud environment like Tableau Cloud.
A de minimis incentive was given to thank the reviewer for their time. The incentive was not used to bias or drive a particular response, nor was the incentive contingent on a positive endorsement. More Info
A de minimis incentive was given to thank the reviewer for their time. The incentive was not used to bias or drive a particular response, nor was the incentive contingent on a positive endorsement. More Info
Tableau Online is completely cloud based and that's why the reports and dashboards are accessible even on the go. One doesn't always need to access the office laptop to access the reports.
The visualizations are interactive and one can quickly change the level at which they want to view the information. For example, one person might be more interested in looking at the country level performances rather than client level. This is intuitive and one doesn't need to create multiple reports for the same.
The feature to ask questions in plain vanilla English language is great and helpful. For quick adhoc fact checks one can simply type what they are looking for and the Natural Language Programming algorithms under the hood parse the query, interpret it and then fetch the results accordingly in a visual form.
A de minimis incentive was given to thank the reviewer for their time. The incentive was not used to bias or drive a particular response, nor was the incentive contingent on a positive endorsement. More Info
A de minimis incentive was given to thank the reviewer for their time. The incentive was not used to bias or drive a particular response, nor was the incentive contingent on a positive endorsement. More Info
A de minimis incentive was given to thank the reviewer for their time. The incentive was not used to bias or drive a particular response, nor was the incentive contingent on a positive endorsement. More Info
Qlik Sense is a constantly improving it's software and working with its' users to make it better. They are great at keeping their users informed of progress and care about delivering a quality product
A de minimis incentive was given to thank the reviewer for their time. The incentive was not used to bias or drive a particular response, nor was the incentive contingent on a positive endorsement. TR verified that a representative sample of customers was invited. More Info
A de minimis incentive was given to thank the reviewer for their time. The incentive was not used to bias or drive a particular response, nor was the incentive contingent on a positive endorsement. More Info
Qlik Sense has a better and easy to learn user interface compared with other analytics tool which always help us to create regular and adhoc reports within the stipulated time frame and can be easily refreshed at a scheduled time and sent to multiple stakeholders for timely update regarding the Key metrics indicator.
A de minimis incentive was given to thank the reviewer for their time. The incentive was not used to bias or drive a particular response, nor was the incentive contingent on a positive endorsement. More Info
Based on comments from our clients, I awarded it this grade. Non-technical customers frequently compliment us on the ease with which they can utilize Tableau Online. Usability is rarely a source of contention amongst our customers. Few complaints have come from me as a user of our internal products.
A de minimis incentive was given to thank the reviewer for their time. The incentive was not used to bias or drive a particular response, nor was the incentive contingent on a positive endorsement. TR verified that a representative sample of customers was invited. More Info
Not only can you ask the support team for help, but you can also ask the community. Also with the community there is a vast amount of problems that have already been solved. The problem you are encountering has a likely chance of already being discussed and even solved in the community section saving you time from reaching out.
A de minimis incentive was given to thank the reviewer for their time. The incentive was not used to bias or drive a particular response, nor was the incentive contingent on a positive endorsement. More Info
I have not had any issues that require customer support from Tableau at this time, which speaks well to Tableau. I have taken an online course with Tableau and it was very professional and well done, so based on that I would assume a similar level of quality for their customer service.
A de minimis incentive was given to thank the reviewer for their time. The incentive was not used to bias or drive a particular response, nor was the incentive contingent on a positive endorsement. More Info
A de minimis incentive was given to thank the reviewer for their time. The incentive was not used to bias or drive a particular response, nor was the incentive contingent on a positive endorsement. More Info
A de minimis incentive was given to thank the reviewer for their time. The incentive was not used to bias or drive a particular response, nor was the incentive contingent on a positive endorsement. More Info
A de minimis incentive was given to thank the reviewer for their time. The incentive was not used to bias or drive a particular response, nor was the incentive contingent on a positive endorsement. More Info
A de minimis incentive was given to thank the reviewer for their time. The incentive was not used to bias or drive a particular response, nor was the incentive contingent on a positive endorsement. More Info
The customization of the platform opens up plenty of other options depending on the use cases. The API layer is incredibly rich and makes integration of Qlik based visualization into web pages a simple and effective pattern. It's been very easy to use with a great community made up of professionals. Qlik Sense has introduces artificial Intelligence into my data visualization and reporting activity.
In determining whether to go with Tableau Online versus Alteryx, two important factors stood out in determining our go-to solution. First, while Alteryx is an impressive tool for data cleansing, it did not stack up in terms of data visualization capabilities. Tableau, on the other hand, provided us everything we needed in terms of visualizing our data and analytics. The second factor is cost. Well neither solution would be considered cheap, Tableau was the more cost effective solution for our needs.
A de minimis incentive was given to thank the reviewer for their time. The incentive was not used to bias or drive a particular response, nor was the incentive contingent on a positive endorsement. More Info
A de minimis incentive was given to thank the reviewer for their time. The incentive was not used to bias or drive a particular response, nor was the incentive contingent on a positive endorsement. TR verified that a representative sample of customers was invited. More Info
A de minimis incentive was given to thank the reviewer for their time. The incentive was not used to bias or drive a particular response, nor was the incentive contingent on a positive endorsement. More Info