TrustRadius: an HG Insights company

Save this comparison

Save this comparison

Add Product

Recommended Comparisons

    Overview
    ProductRatingMost Used ByProduct SummaryStarting Price

    Microsoft Power BI

    Score8.5 out of 10
    N/AMicrosoft Power BI is a visualization and data discovery tool from Microsoft. It allows users to convert data into visuals and graphics, visually explore and analyze data, collaborate on interactive dashboards and reports, and scale across their organization with built-in governance and security.

    $10

    per month per user

    Powerslide

    Score9.5 out of 10
    N/ACreated in 2019, Powerslide is a data storytelling and data visualization solution. This software helps business users to create usages around data. Powerslide is a solution for data analysis, visualization and presentation. Interactive and collaborative, Powerslide aims to answer data issues in a simple, practical and design interface, and help users simplify the analysis and communication of…N/A
    Pricing
    Microsoft Power BIPowerslide
    Editions & Modules
    No answers on this topic
    No answers on this topic
    Offerings
    Pricing Offerings
    Microsoft Power BIPowerslide
    Free Trial
    YesYes
    Free/Freemium Version
    YesNo
    Premium Consulting/Integration Services
    NoNo
    Entry-level Setup FeeNo setup feeOptional
    Additional DetailsOur rates are flexible and adapt to the size and use of your organization. Contact us and let’s discuss about it.
    More Pricing Information
    Community Pulse
    Microsoft Power BIPowerslide
    Considered Both Products
    Microsoft
    No answer on this topic
    Datarocks
    No answer on this topic
    Key User Insights
    Would buy again
    95%
    Would buy again
    101 Answers
    No answers on this topic
    Delivers good value for the price
    99%
    Delivers good value for the price
    96 Answers
    No answers on this topic
    Happy with the feature set
    97%
    Happy with the feature set
    103 Answers
    No answers on this topic
    Lived up to sales and marketing promises
    98%
    Lived up to sales and marketing promises
    63 Answers
    No answers on this topic
    Implementation went as expected
    94%
    Implementation went as expected
    67 Answers
    No answers on this topic
    Features
    Microsoft Power BIPowerslide
    BI Standard Reporting
    Comparison of BI Standard Reporting features of Microsoft Power BI and Powerslide
    Feature
    Microsoft Power BI
    8.8
    140 Ratings
    8% above category average
    Powerslide
    8.8
    2 Ratings
    5% above category average
    Pixel Perfect reports8.5120 Ratings8.52 Ratings
    Customizable dashboards10.0140 Ratings9.02 Ratings
    Report Formatting Templates8.0128 Ratings9.02 Ratings
    Ad-hoc Reporting
    Comparison of Ad-hoc Reporting features of Microsoft Power BI and Powerslide
    Feature
    Microsoft Power BI
    8.2
    140 Ratings
    2% above category average
    Powerslide
    9.5
    2 Ratings
    17% above category average
    Drill-down analysis7.0139 Ratings9.52 Ratings
    Formatting capabilities9.0138 Ratings00 Ratings
    Integration with R or other statistical packages8.0103 Ratings00 Ratings
    Report sharing and collaboration9.0135 Ratings9.52 Ratings
    Report Output and Scheduling
    Comparison of Report Output and Scheduling features of Microsoft Power BI and Powerslide
    Feature
    Microsoft Power BI
    8.6
    134 Ratings
    3% above category average
    Powerslide
    9.2
    2 Ratings
    9% above category average
    Publish to Web8.0129 Ratings9.02 Ratings
    Publish to PDF9.0122 Ratings9.52 Ratings
    Report Versioning9.0102 Ratings9.01 Ratings
    Report Delivery Scheduling8.0104 Ratings00 Ratings
    Delivery to Remote Servers9.074 Ratings00 Ratings
    Data Discovery and Visualization
    Comparison of Data Discovery and Visualization features of Microsoft Power BI and Powerslide
    Feature
    Microsoft Power BI
    8.7
    136 Ratings
    9% above category average
    Powerslide
    9.0
    2 Ratings
    10% above category average
    Pre-built visualization formats (heatmaps, scatter plots etc.)9.0131 Ratings00 Ratings
    Location Analytics / Geographic Visualization8.0122 Ratings9.02 Ratings
    Predictive Analytics9.0102 Ratings00 Ratings
    Pattern Recognition and Data Mining9.01 Ratings00 Ratings
    Access Control and Security
    Comparison of Access Control and Security features of Microsoft Power BI and Powerslide
    Feature
    Microsoft Power BI
    8.6
    127 Ratings
    1% above category average
    Powerslide
    -
    Ratings
    Multi-User Support (named login)9.0121 Ratings00 Ratings
    Role-Based Security Model9.0102 Ratings00 Ratings
    Multiple Access Permission Levels (Create, Read, Delete)10.0111 Ratings00 Ratings
    Report-Level Access Control7.01 Ratings00 Ratings
    Single Sign-On (SSO)8.394 Ratings00 Ratings
    Mobile Capabilities
    Comparison of Mobile Capabilities features of Microsoft Power BI and Powerslide
    Feature
    Microsoft Power BI
    8.0
    117 Ratings
    2% above category average
    Powerslide
    -
    Ratings
    Responsive Design for Web Access8.0111 Ratings00 Ratings
    Mobile Application7.793 Ratings00 Ratings
    Dashboard / Report / Visualization Interactivity on Mobile7.7112 Ratings00 Ratings
    Application Program Interfaces (APIs) / Embedding
    Comparison of Application Program Interfaces (APIs) / Embedding features of Microsoft Power BI and Powerslide
    Feature
    Microsoft Power BI
    8.4
    80 Ratings
    8% above category average
    Powerslide
    -
    Ratings
    REST API8.072 Ratings00 Ratings
    Javascript API9.956 Ratings00 Ratings
    iFrames8.055 Ratings00 Ratings
    Java API8.046 Ratings00 Ratings
    Themeable User Interface (UI)8.163 Ratings00 Ratings
    Customizable Platform (Open Source)8.444 Ratings00 Ratings
    Best Alternatives
    Microsoft Power BIPowerslide
    Small Businesses
    Cyfe
    Score8.8 out of 10
    Looker Studio
    Score7.6 out of 10
    Medium-sized Companies
    Zendesk Explore
    Score8.7 out of 10
    Jet Reports
    Score9.5 out of 10
    Enterprises
    Jaspersoft Community Edition
    Score9.7 out of 10
    Grafana
    Score8.7 out of 10
    All AlternativesView all alternativesView all alternatives
    User Ratings
    Microsoft Power BIPowerslide
    Likelihood to Recommend
    8.5
    (142 ratings)
    9.5
    (2 ratings)
    Likelihood to Renew
    9.0
    (2 ratings)
    -
    (0 ratings)
    Usability
    7.9
    (58 ratings)
    -
    (0 ratings)
    Support Rating
    10.0
    (53 ratings)
    -
    (0 ratings)
    Implementation Rating
    9.0
    (1 ratings)
    -
    (0 ratings)
    Data Sharing and Collaboration
    8.5
    (82 ratings)
    -
    (0 ratings)
    Data Sources
    9.0
    (81 ratings)
    -
    (0 ratings)
    User Testimonials
    Microsoft Power BIPowerslide
    Likelihood to Recommend
    Microsoft
    Has significantly improved collation of data and visualisation especially with business across Europe. Has given me the ability to see the Site availability at the click of a button to see which Site is in the "money" and seize opportunities based on Market data
    Incentivized
    Read full review
    Datarocks
    It has allowed us as an organization to clearly deliver our numbers to our collaborators, but above all to the heads of our teams and company. Not being entirely professional, it is easy to use for someone who does not understand the function of these numbers or hard data.
    Incentivized
    Read full review
    Pros
    Microsoft
    • Options for data source connections are immense. Not just which sources, but your options for *how* the data is brought in.
    • Constant updates (this is both good and bad at times).
    • User friendliness. I can get the data connections set up and draft some quick visuals, then release to the target audience and let them expand on it how they want to.
    Incentivized
    Read full review
    Datarocks
    • Collaborative fractures helped a lot.
    • Dashboards are really unique.
    Read full review
    Cons
    Microsoft
    • It would be easier for users could Microsoft Power BI and Excel used the same programming languages.
    • Would like to see the online version of Microsoft Power BI be as powerful as the desktop version.
    • Publishing a Microsoft Power BI file online and then having to save the file is somewhat redundant.
    • Would like to export each page or chart as an image.
    Incentivized
    Read full review
    Datarocks
    • Increase the variety of fonts
    • Make templates less serious or business
    Incentivized
    Read full review
    Likelihood to Renew
    Microsoft
    Microsoft Power BI is an excellent and scalable tool. It has a learning curve, but once you get past that, the sky is the limit and you can build from the most simple to the most complex dashboards. I have built everything from simple reports with only a few data points to complex reports with many pages and advanced filtering.
    Read full review
    Datarocks
    No answers on this topic
    Usability
    Microsoft
    Automating reporting has reduced manual data processing by 50-70%, freeing up analysts for higher-value tasks. A finance team that previously spent 20+ hours per week on Excel-based reports now does it in minutes with Microsoft Power BI's automated Real-time dashboards have shortened decision cycles by 30-40%, enabling leadership to react quickly to sales trends, operational bottlenecks, and customer behavior.
    Incentivized
    Read full review
    Datarocks
    No answers on this topic
    Support Rating
    Microsoft
    It is a fantastic tool, you can do almost everything related with data and reports, it is a perfect substitutive of Power Point and Excel with a high evolution and flexibility, and also it is very friendly and easy to share. I think all companies should have Power BI (or other BI tool) in their software package and if they are in the MS Suite, for sure Power BI should be the one due to all the benefits of the MS ecosystem.
    Incentivized
    Read full review
    Datarocks
    No answers on this topic
    Implementation Rating
    Microsoft
    It was integrated with our erp easily and was accessible on cloud.
    Incentivized
    Read full review
    Datarocks
    No answers on this topic
    Alternatives Considered
    Microsoft
    Microsoft Power BI is free. If I didn't want to create a custom platform (i.e. my organization insisted on an existing platform that I *had* to use), I'd use Microsoft Power BI. For any start-up or SMB, I'd just use Claude & Grok to build it quickly, also for free. Would not pay for Tableau or Sigma anymore. Not worth it at all.
    Incentivized
    Read full review
    Datarocks
    Powerslide stands out for having templates that help you easily organize hard data and more delicate information such as numbers and statistics. By having many ways to present and edit it in one place, it makes this a page with variety and empathy with its user.
    Incentivized
    Read full review
    Return on Investment
    Microsoft
    • Power BI usage reduced the effort of analytical reports creation by about 80%
    • Empowered all the level of employee to be more vigilant of the data and business insights, gained the profit of 8% overall.
    • AI-powered predictive analytics improved forecasting accuracy by 17%, that topped the overall sales.
    Incentivized
    Read full review
    Datarocks
    • Our collaborators do not get bored in meetings and even if it is a lot of information, seeing it in an interesting design makes them pay attention and like to be informed of the numbers they manage to obtain with their work.
    Incentivized
    Read full review
    ScreenShots

    Microsoft Power BI Screenshots

    Screenshot of Microsoft Power BI - Turns insights into impact for business usersScreenshot of Power BI integrates easily with Microsoft 365Screenshot of Microsoft Power BI - AI-Powered CapabilitiesScreenshot of Microsoft Power BI - Copilot can be used to create reportsScreenshot of Microsoft Power BI - Data HubScreenshot of Microsoft Power BI - Scales as organizational needs grow

    Powerslide Screenshots

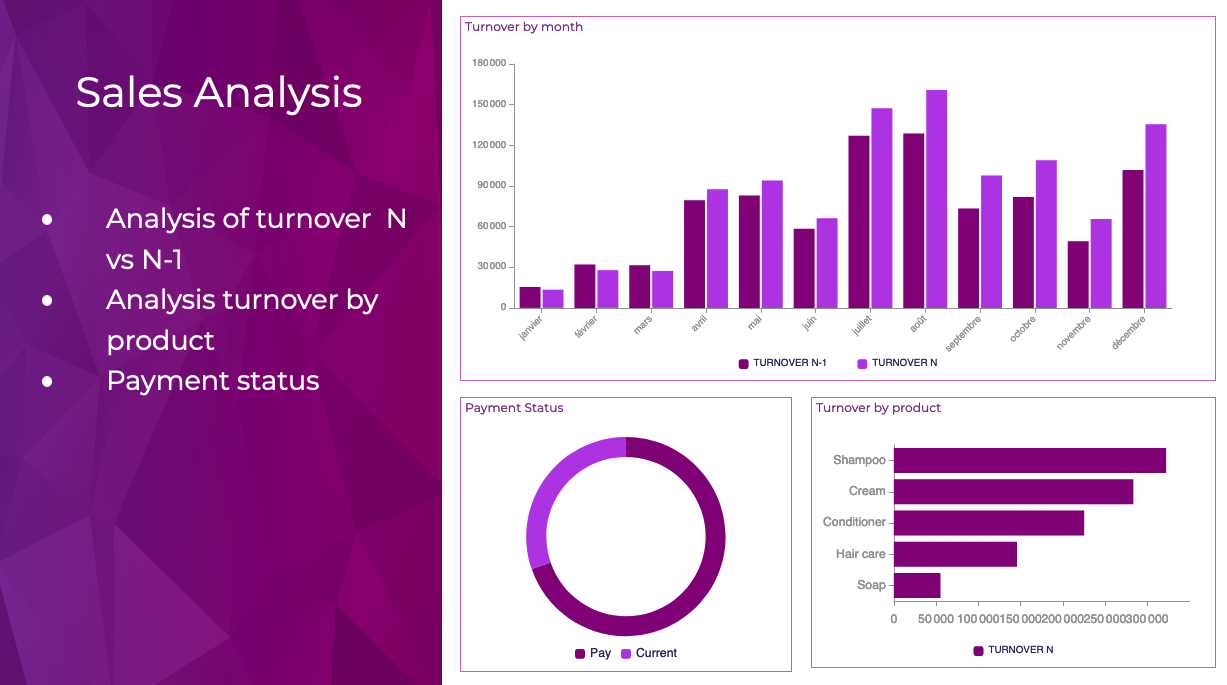
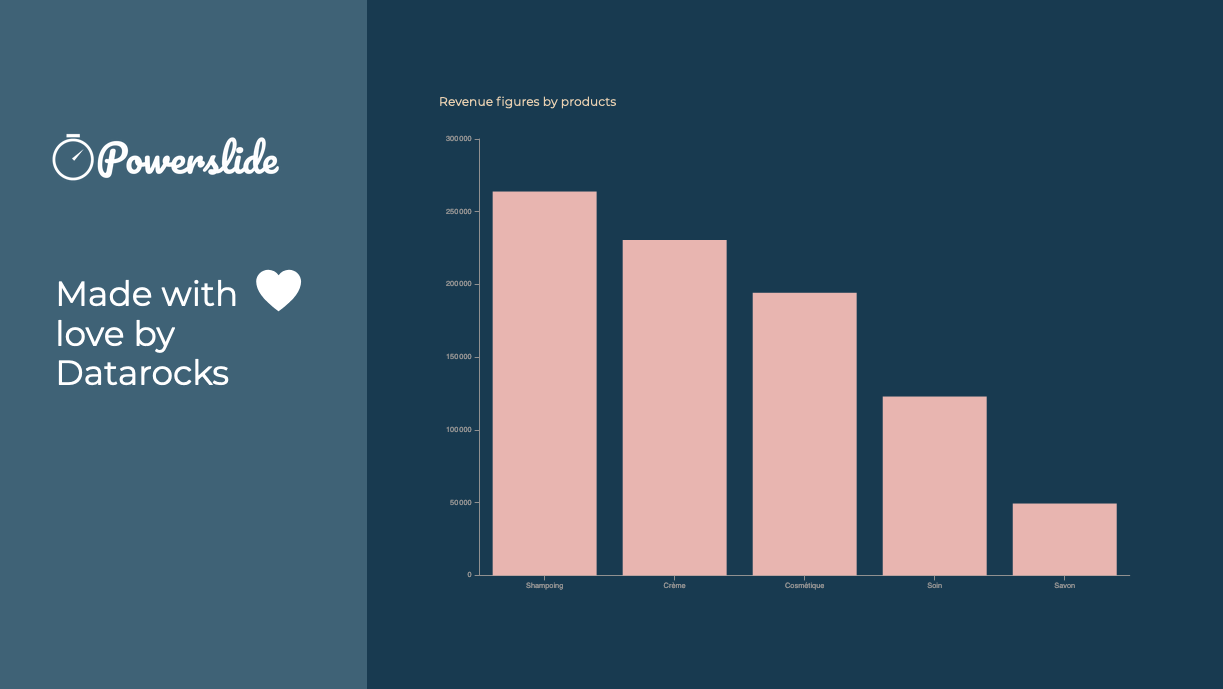
    Screenshot of Reporting and dashboards have never been easier to achieve. Interactive, Powerslide takes you to the heart of your data and helps you take better decisions. Simple to use, you can build your graphics in seconds with drag-and-drop and let our suggestion algorithms guide you.Screenshot of Powerslide complies to your graphic chart. Define your color palette and Powerslide takes care of the rest.Screenshot of Powerslide is THE solution provided with love by DatarocksScreenshot of Take advantage of real-time collaboration to work as a team on the same project. Time-saving and flexibility await you !