Power BI for Office 365 allowed users to model and analyze data, and query large datasets with complex natural language queries. It has been discontinued in favor of other editions of Power BI going forward.
N/A
Qlik Sense
Score 7.4 out of 10
N/A
Qlik Sense® is a self-service BI platform for data discovery and visualization. It supports a full range of analytics use cases—data governance, pixel-perfect reporting, and collaboration. Its Associative Engine indexes and connects relationships between data points for creating actionable insights.
$200
per month
Pricing
Power BI For Office 365 (discontinued)
Qlik Sense
Editions & Modules
No answers on this topic
Starter
$200
per month
Standard
$825
per month
Premium
$2,750
per month
Qlik Sense Enterprise on Windows
Contact Sales
Enterprise
Custom Quote
Offerings
Pricing Offerings
Power BI For Office 365 (discontinued)
Qlik Sense
Free Trial
No
No
Free/Freemium Version
No
No
Premium Consulting/Integration Services
No
No
Entry-level Setup Fee
No setup fee
No setup fee
Additional Details
—
—
More Pricing Information
Community Pulse
Power BI For Office 365 (discontinued)
Qlik Sense
Features
Power BI For Office 365 (discontinued)
Qlik Sense
BI Standard Reporting
Comparison of BI Standard Reporting features of Product A and Product B
Power BI For Office 365 (discontinued)
9.0
Ratings
10% above category average
Qlik Sense
8.5
Ratings
4% above category average
Pixel Perfect reports
9.00 Ratings
8.30 Ratings
Customizable dashboards
8.00 Ratings
8.90 Ratings
Report Formatting Templates
10.00 Ratings
8.20 Ratings
Ad-hoc Reporting
Comparison of Ad-hoc Reporting features of Product A and Product B
Power BI For Office 365 (discontinued)
9.5
Ratings
16% above category average
Qlik Sense
8.6
Ratings
7% above category average
Drill-down analysis
9.00 Ratings
8.90 Ratings
Formatting capabilities
9.00 Ratings
8.20 Ratings
Integration with R or other statistical packages
10.00 Ratings
8.40 Ratings
Report sharing and collaboration
10.00 Ratings
9.00 Ratings
Report Output and Scheduling
Comparison of Report Output and Scheduling features of Product A and Product B
Power BI For Office 365 (discontinued)
9.5
Ratings
13% above category average
Qlik Sense
8.8
Ratings
6% above category average
Publish to Web
10.00 Ratings
8.80 Ratings
Publish to PDF
10.00 Ratings
8.80 Ratings
Report Versioning
9.00 Ratings
8.80 Ratings
Report Delivery Scheduling
9.60 Ratings
8.80 Ratings
Delivery to Remote Servers
8.70 Ratings
8.80 Ratings
Data Discovery and Visualization
Comparison of Data Discovery and Visualization features of Product A and Product B
If you want to create a visual dashboard or report that utilises various data sources then PowerBI can do this. It is great in that it takes your on-premises data and stores it on Microsoft servers where it can interact with it faster, reducing load on your own servers, while being efficient in what it transfers out. We have found it not well suited if you wanted to publish a simple report to many staff as they may all need a Pro license which can get expensive. Even if embedding the report onto a shared platform like SharePoint, it will not display if the users doesn't have a PowerBI Pro license.
Qlik Sense is a program whose purpose is to greatly improve all your operations and use of all data in an organic way. The mission will always be to increase the economic and commercial processes of the company in a short time. I recommended it for its high technology, which was Created for this area, the results are successful. We have noticed how it has increased relationships with our clients thanks to the credibility and security that we provide.
Ease of use. Most people have experience working with Excel. If you know how to create pivots, you can use Power BI.
Data extraction and transformation (ETL). ETL is a joy with Power Query. It is intuitive, simple and a magical experience to transform poor data into something useful.
Visuals. Power BI is beautiful to behold, especially Power View.
Maps. The interactive maps are great built-in tools.
Cost You cannot find anything cheaper than Power BI, unless you want to give it to every user in your company.
Like many Microsoft products, you can get by with a small understanding of the product, but to truly realize the entire potential does take a while to learn.
Hooking up SQL databases to the cloud version is a more complex than just querying right into the database from the desktop version.
Not a lot of room for customization as we were used to in QlikView
UI and default navigation can be very clunky and not user friendly
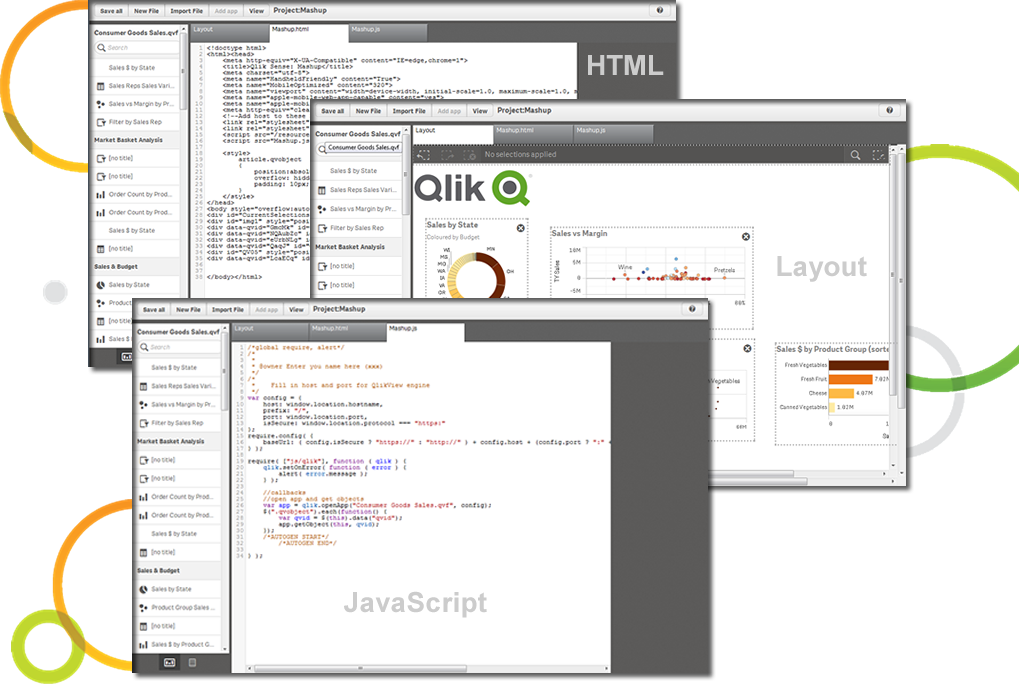
Although the backend is fantastic, the front end experience leaves a lot to be desired. As a developer you don't have a lot of options to customized your app unless you turn to Javascript, CSS and HTML. This is not a common stack you would find in most BI developers
If I were a small business owner, I would likely use Power BI for Office 365 for the sheer fact that I would get the Office licensing I need, along with powerful capabilities. As a Microsoft Partner, we continue to see Microsoft invest heavily in the Power BI capabilities, and will continue to implement and support BI solutions around this product, as we believe this is in the best interest of our clients.
Qlik Sense is a constantly improving it's software and working with its' users to make it better. They are great at keeping their users informed of progress and care about delivering a quality product
We are satisfied with the functionality and capabilities of Power BI. Product is cost effective and full-fill the reporting requirements of the organization. You can perform most of the report level complex analysis with the help of DAX which makes Power BI very powerful analytic tool. Power BI for Office 365 has gone away and Power BI is the next evolution of it. Power BI comes with your Office 365 E5 subscription or you can purchase licensing for it separately.
Qlik Sense has a better and easy to learn user interface compared with other analytics tool which always help us to create regular and adhoc reports within the stipulated time frame and can be easily refreshed at a scheduled time and sent to multiple stakeholders for timely update regarding the Key metrics indicator.
as of now there is strong community for Power BI, you can get solution for most of your problems from there. Also you can send your error to Microsoft as well. After every 15 days they release updates to overcome all the issues of defects.
Not only can you ask the support team for help, but you can also ask the community. Also with the community there is a vast amount of problems that have already been solved. The problem you are encountering has a likely chance of already being discussed and even solved in the community section saving you time from reaching out.
One main competitor of Power BI is Tableau. Tableau has been around longer than Power BI so it can feel a little more refined in areas, however Power BI is catching up quickly. Tableau can be more expensive than Power BI. If you want more features and more refinement, and don't mind extra cost, then Tableau may be a better choice. But if you want something that's integrated with many things in O365, and are satisfied with fewer bells and whistles, Power BI may be the better option.
The customization of the platform opens up plenty of other options depending on the use cases. The API layer is incredibly rich and makes integration of Qlik based visualization into web pages a simple and effective pattern. It's been very easy to use with a great community made up of professionals. Qlik Sense has introduces artificial Intelligence into my data visualization and reporting activity.
As a Microsoft Partner implementing Business Intelligence solutions, Power BI has removed the barrier for our clients to begin the "BI journey". So often, projects get hung up in that early phase of procuring and installing/configuring expensive hardware and software. Just simply getting started and designing a beginning solution has allowed our clients to see results in 1-2 weeks using their data that might have taken months to achieve otherwise.
One significant ROI example is process improvement. In many cases, individuals or teams are spending days each month gathering data from multiple sources for reporting to their constituents. We are reducing these times to minutes by automating many of the data collection and integration processes that were previously manual.
The impact has undoubtedly been positive, it is difficult to quantify it, however in terms of effectiveness or efficiency I give it a 90%.
I don't give it 100% because to use the complete package you have to pay, and it's not that cheap and on the other hand because it has some deficiencies, such as technical support and some issues like windows that are not so friendly and easy to work with.