Phrazor vs. SAS Visual Analytics

Overview
ProductRatingMost Used ByProduct SummaryStarting Price
Phrazor
Score 7.0 out of 10
N/A
Phrazor summarises data into a few bullet points, highlighting key insights required for decision making. It aims to help enterprises make their reports and insights easier to comprehend by writing a narrative along with each report. With Phrazor, users don't have to spend time analyzing numbers. Phrazor writes language to explain the key insights in words. Key Features: CREATE EASY-TO-UNDERSTAND REPORTS with language-based narratives. EXPLORE HIDDEN…N/A
SAS Visual Analytics
Score 7.6 out of 10
Enterprise companies (1,001+ employees)
SAS Visual Analytics provides a complete platform for analytics visualization, enabling users to identify patterns and relationships in data that weren't initially evident. Interactive, self-service BI and reporting capabilities are combined with out-of-the-box advanced analytics so everyone can discover insights from any size and type of data, including text.N/A
Pricing
PhrazorSAS Visual Analytics
Editions & Modules
No answers on this topic
SAS Visual Analytics for SAS Cloud
$0
Annual By Users: 5, 10, 20
Offerings
Pricing Offerings
PhrazorSAS Visual Analytics
Free Trial
YesYes
Free/Freemium Version
YesNo
Premium Consulting/Integration Services
NoNo
Entry-level Setup FeeNo setup feeNo setup fee
Additional DetailsSAS Visual Statistics and SAS Office Analytics are also available as add-ons.
More Pricing Information
Community Pulse
PhrazorSAS Visual Analytics
Features
PhrazorSAS Visual Analytics
BI Standard Reporting
Comparison of BI Standard Reporting features of Product A and Product B
Phrazor
8.5
Ratings
4% above category average
SAS Visual Analytics
8.3
Ratings
2% above category average
Customizable dashboards8.00 Ratings8.00 Ratings
Report Formatting Templates9.00 Ratings9.00 Ratings
Pixel Perfect reports00 Ratings8.00 Ratings
Ad-hoc Reporting
Comparison of Ad-hoc Reporting features of Product A and Product B
Phrazor
7.0
Ratings
14% below category average
SAS Visual Analytics
8.8
Ratings
9% above category average
Drill-down analysis8.00 Ratings9.00 Ratings
Formatting capabilities6.00 Ratings8.00 Ratings
Report sharing and collaboration7.00 Ratings10.00 Ratings
Integration with R or other statistical packages00 Ratings8.00 Ratings
Report Output and Scheduling
Comparison of Report Output and Scheduling features of Product A and Product B
Phrazor
9.0
Ratings
8% above category average
SAS Visual Analytics
9.2
Ratings
10% above category average
Publish to PDF9.00 Ratings9.00 Ratings
Publish to Web00 Ratings9.00 Ratings
Report Versioning00 Ratings9.00 Ratings
Report Delivery Scheduling00 Ratings10.00 Ratings
Delivery to Remote Servers00 Ratings9.00 Ratings
Data Discovery and Visualization
Comparison of Data Discovery and Visualization features of Product A and Product B
Phrazor
5.5
Ratings
37% below category average
SAS Visual Analytics
9.7
Ratings
20% above category average
Pre-built visualization formats (heatmaps, scatter plots etc.)5.00 Ratings10.00 Ratings
Predictive Analytics6.00 Ratings9.00 Ratings
Location Analytics / Geographic Visualization00 Ratings10.00 Ratings
Access Control and Security
Comparison of Access Control and Security features of Product A and Product B
Phrazor
8.0
Ratings
6% below category average
SAS Visual Analytics
8.3
Ratings
2% below category average
Multi-User Support (named login)8.00 Ratings9.00 Ratings
Multiple Access Permission Levels (Create, Read, Delete)8.00 Ratings8.00 Ratings
Role-Based Security Model00 Ratings8.00 Ratings
Single Sign-On (SSO)00 Ratings8.00 Ratings
Mobile Capabilities
Comparison of Mobile Capabilities features of Product A and Product B
Phrazor
-
Ratings
SAS Visual Analytics
8.7
Ratings
10% above category average
Responsive Design for Web Access00 Ratings10.00 Ratings
Mobile Application00 Ratings9.00 Ratings
Dashboard / Report / Visualization Interactivity on Mobile00 Ratings9.00 Ratings
Application Program Interfaces (APIs) / Embedding
Comparison of Application Program Interfaces (APIs) / Embedding features of Product A and Product B
Phrazor
-
Ratings
SAS Visual Analytics
9.2
Ratings
17% above category average
REST API00 Ratings10.00 Ratings
Javascript API00 Ratings9.00 Ratings
iFrames00 Ratings9.00 Ratings
Java API00 Ratings9.00 Ratings
Themeable User Interface (UI)00 Ratings9.00 Ratings
Customizable Platform (Open Source)00 Ratings9.00 Ratings
Best Alternatives
PhrazorSAS Visual Analytics
Small Businesses
BrightGauge
BrightGauge
Score 9.0 out of 10
BrightGauge
BrightGauge
Score 9.0 out of 10
Medium-sized Companies
Reveal
Reveal
Score 10.0 out of 10
Reveal
Reveal
Score 10.0 out of 10
Enterprises
Kyvos Semantic Intelligence Layer
Score 9.9 out of 10
Kyvos Semantic Intelligence Layer
Score 9.9 out of 10
All AlternativesView all alternativesView all alternatives
User Ratings
PhrazorSAS Visual Analytics
Likelihood to Recommend
7.0
(0 ratings)
9.0
(0 ratings)
Likelihood to Renew
-
(0 ratings)
9.3
(0 ratings)
Usability
8.0
(0 ratings)
6.0
(0 ratings)
Support Rating
9.0
(0 ratings)
8.0
(0 ratings)
User Testimonials
PhrazorSAS Visual Analytics
Likelihood to Recommend
Phrazor is well suited for use in larger companies, especially those that operate globally and need to get region-specific or country-specific data and reports. I found Phrazor to be less appropriate for use in smaller companies (especially non-profit organizations) that may not benefit from extensive reporting. Non-profit organizations don't necessarily have projected sales growth and inventory costs.
Read full review
SAS Business Intelligence is more suited to organizations which are already using SAS as the primary software for their analytics needs. Learning curve is relatively shorter for teams already skilled in BASE SAS. For organizations already working with open source software like Julia and Python, it doesn't make much sense to use SAS BI.
Read full review
Pros
  • Custom reporting.
  • Report templates.
  • Unique data not found elsewhere.
Read full review
  • SAS BI makes it very easy to create interactive dashboards even for someone who is not from an IT background. For some specific requirements, basic knowledge of SQL is good enough.
  • A lot of functions have been predefined which makes it very convenient to create dashboards and reports. One doesn't need to be from an IT or a programming background to understand and create dashboards.
  • It supports other programming languages like R and also has a seamless API integration with various data management platforms.
Read full review
Cons
  • More training videos for beginners.
  • Customizable report printing layouts.
  • Additional reporting measures.
Read full review
  • Business Objects should provide a more consistent mobile/desktop interface so operation between the two is seamless
  • Business Objects needs to make it easier to query across disparate data sets such as Oracle to SQL to Mongo DB
  • Our installation of Business Objects does not natively allow the export of XLSX documents, only XLS
Read full review
Likelihood to Renew
No answers on this topic
There is no other product that can match SAS. There are some products that can compare to ETL but lack the analytics that SAS has. Others can perform a limited set of analytical procedures but lack the data processing that comes with SAS. Using thin client allows users to access data whenever they have an internet connection.
Read full review
Usability
Our company experienced some difficulty during implementation trying to get data imported and uploaded. We reached out to support and received much-needed assistance, and we were able to move forward with data importation. Several of our users, including myself, experienced some difficulty in understanding the system, so it took some time to use it fully. For a first-time user, there were almost too many filters and options to choose from.
Read full review
SAS BI is good for creating reports and dashboards and then sharing it with the users. It also has ability to manage access to the reports and dashboards but somehow with most of the world moving to open source languages R, Python and Julia, SAS BI feels to be archaic in terms of feature set and integrations it allow[s]. Also, comparing it with other Business Intelligence tools like Tableau and Microsoft BI, the functionality of SAS BI is very limited and doesn't justify the pricing.
Read full review
Support Rating
Great! Anytime I needed assistance and reached out to support, I received amazing help, and everyone was always very nice. The reason I did not rate support a ten is that often the hold time was quite long. When you are in a time crunch and need data immediately, it is frustrating not to get immediate support.
Read full review
When you call tech support, you are immediately routed to a person who can answer your question. Often they can answer on the spot. However, if they cannot, you are given a track number and then followed up with. There have been times when I have had multiple track numbers open and they will actually TRACK YOU DOWN to ensure that your problem has been resolved. Issues do not fall into black holes with SAS. They are also willing to do a WebEx with you to diagnose the problem by seeing your environment, which is always helpful.
Read full review
Alternatives Considered
I enjoyed using Phrazor better; however, as a new user, I was a bit frustrated getting started. Microsoft Power BI had more videos available online than I found. Phrazor had more adaptability and customization for our company, which overall made it a better fit over competitive products. My coworkers and I demoed Sisense, and we chose not to purchase it due to it not being a good fit.
Read full review
I have chosen SAS Visual Analytics because one of my colleagues suggests using the software for the same for our work. As earlier, we use to take a lot of time in analyzing the data but after using the SAS Visual Analytics software our work has improved and time has decreased. It's very helpful for us.
Read full review
Return on Investment
  • Great tool for creating annual budgets.
  • Reports and graphs that can be included in annual report - saved on marketing costs.
  • Able to import from excel which is a cost-saving tool for our company.
Read full review
  • SAS Visual Analytics licensing cost should be reduced to enable users to use it in mass scale.
  • More statistical and mathematical equations and theories should be converted into SAS functions for reusing.
  • Because of enriched ETL and reporting capabilities SAS Visual Analytics is most preferred by business users.
Read full review
ScreenShots

SAS Visual Analytics Screenshots

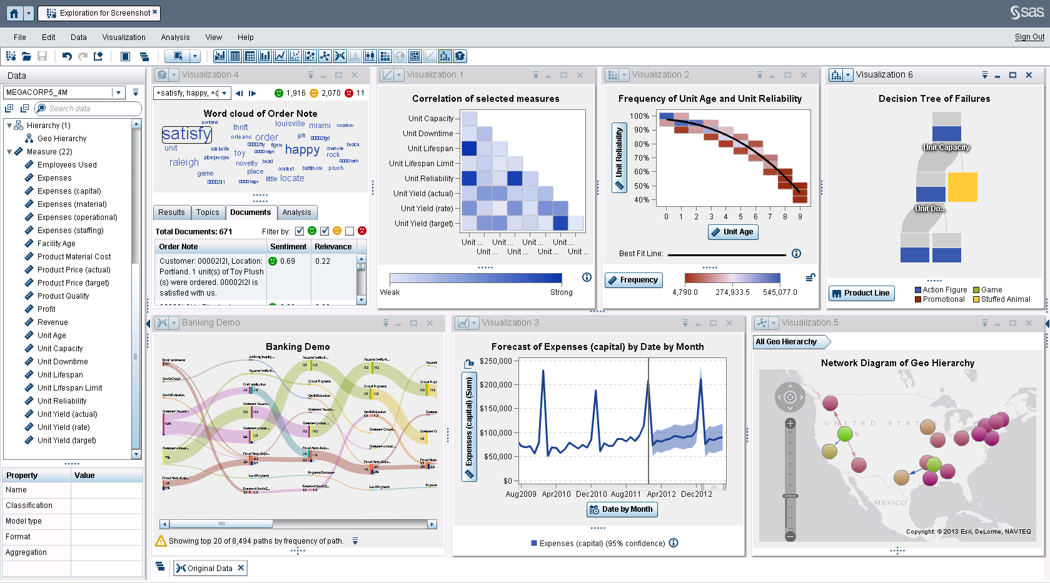
Screenshot of Explore your data using analytics and interactive data visualizations.